Ventilation & Carbon dioxide:
Good ventilation is important for indoor air quality, especially for reducing the concentrations of pollutants and airborne viruses (looking at you, COVID-19!).
Measuring carbon dioxide (CO₂) can be a useful proxy for monitoring indoor ventilation, with higher concentrations of CO₂ suggestive of poor air flow/mixing compared to lower concentrations. With something like a portable CO₂ monitor you can quickly get an idea on a space's air mix, how CO₂ concentrations change with occupancy, and the effectiveness of different ventilation strategies.
While reputable monitors can be bought ~ $250 USD, it can be infinitely more fun make your own (and maybe save yourself $150 along the way).
The CO₂ Cubed:
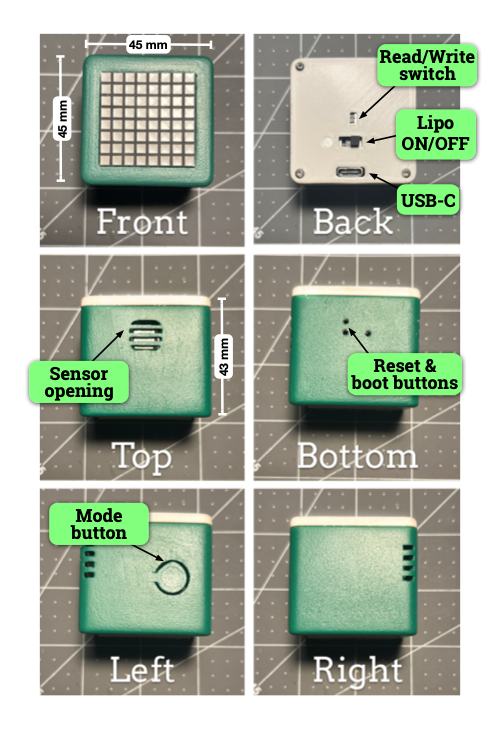
Measuring 45 x 45 x 42 mm (1.77 x 1.77 x 1.65 inches), the CO₂ Cubed is my own little portable CO₂ monitor, with an 8x8 bicolour LED matrix, lipo battery, 3D printed case, and wifi connectivity.
The matrix with it's 64 pixels of red, green, or orange really does align perfectly with relaying high, low, or medium CO₂ levels. It also provides me with an interesting challenge of how to properly convey icons and visualise data (my attempt at an Earth icon with just green and orange LEDS was interpreted as "a broken dragon coin?" by my partner, which… fair).

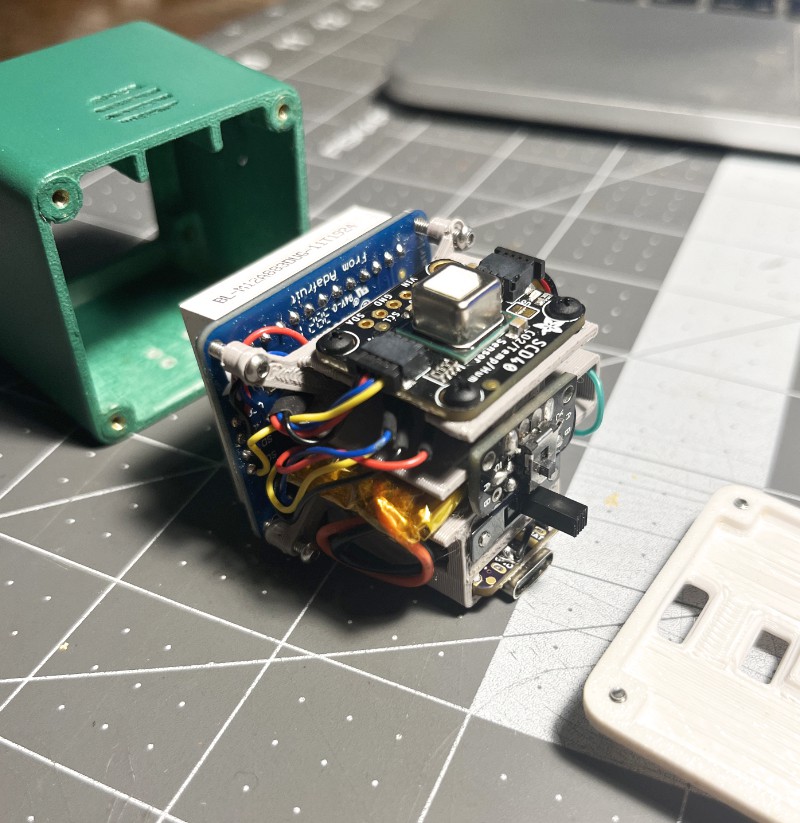
For the microcontroller, I'm using an Adafruit QT PY ESP32-S2 with onboard antenna. It's small and has enough PSRAM to run my programming language of choice, CircuitPython without me worrying about running out of memory. It also has wifi (more on that below).
The CO₂ sensor is Adafruit's breakout of the SCD-40. With a range of 400 - 2000 ppm and accuracy of ± 50 ppm + 5% it's ideal for indoor monitoring. As a bonus it also measures temperature and relative humidity (woo!) and has STEMMA QT connectors for easy solder-less connections (double woo!).
A momentary switch on the side of the Cube allows navigating menus and pages with short and long presses, while a slide switch on the back turns the lipo power on and off.
All the electronics are mounted onto a 3D printed frame that slides and fastens to an outer case via heat-set inserts. The outer case was 3D printed in PETG, sanded, filled, and painted. Consideration was given to reducing the amount of 'dead air' around the sensor, where CO₂ could be trapped and decrease the response time of the sensor.

Wifi & changing settings
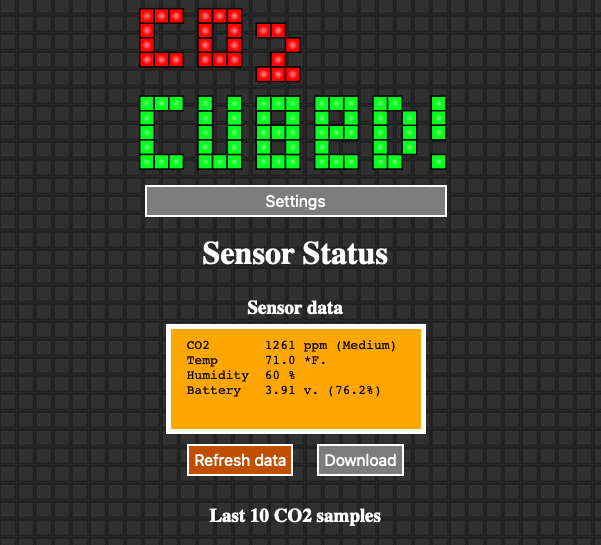
The Cube can optionally connect to wifi (because… of course). Primarily this allows me to send data to Adafruit IO to log and graph data over longer time periods, but it also gives me a way to change settings on-the-fly.
By generating it's own local webpage (either through connecting to a known wifi network or by hosting it's own private wifi), settings like LED brightness, page order, and the thresholds for low, medium, and high can be easily adjusted while out-and-about.
I'm still working on this aspect (HTTP servers and Javascript are new to me, and I've all but forgotten CSS), but it's slowly coming together.

Power
The Cube is powered from a 1s 350 mAh lipo battery and charged via the QT PY's USB-C port. Internally the lipo connects to a lipoly charger soldered to the QT PY, with an on/off switch and a voltage divider for basic battery monitoring.
Low power consumption wasn't a goal of this project. The cube draws 50 - 90 mA depending on whether wifi is on or not. In real world tests I get about 5 hours of continuous use with wifi, which could be greatly increased by using a biggeR battery aND by putting the microcontroller to sleep between readings.
Code
The Cube is coded in CircuitPython and relies on Adafruit's CircuitPython libraries.
COMING SOON: EXAMPLE CODE ON GITHUB
Data visualisation & Pages
[TO DO: IMAGES OF ALL THESE PAGES]
While I could have just made the matrix light up different colours to portray low, medium, and high CO₂ levels (and be done with the thing weeks ago), that's not really in the spirit of this project. Instead I've played around with different ways to visualise data with pages that can be cycled through with a short press of the switch on the side.
Here's a few of those pages:
CO₂ Moving bar graph
With each new reading a coloured bar is generated at the rightmost part of the matrix, while previous bars are shifted 1 pixel to the left. The height and colour of the bars are dependent upon the CO₂ level. With a width of 8 pixels and a reading every ~30 seconds, the matrix can display ~ 4 minutes worth of data. Pretty good for seeing a spike or a moderate increase/decrease in CO₂ levels.
CO₂ Pixels
Starting from the top left, each pixel represents a reading, with the colour representing a low, medium, or high CO₂ level. With 64 pixels and a reading every ~ 30 seconds, the matrix can display ~ 30 minutes of CO₂ data. When all 64 pixels are filled, the matrix is wiped and starts again from the top left.
CO₂ Arrows
A coloured arrow shows whether the current CO₂ level has increased, greatly increased, decreased, greatly decreased, or remained the same (± a buffer amount) compared to the previous reading. This can be handy to see short term trends in the CO₂ level.
CO₂ Braille pattern
It's hard to draw regular digits on the matrix without doing some kind of scrolling. 2 x 3 braille cells on the other hand do fit, with three placing comfortably across the matrix with a 1 pixel gap in-between. For readability, raised dots are always coloured red and flat dots green. While there isn't a colour change to show low, medium, and high CO₂ levels, you can quickly gauge whether the level is high just from the jump from three digits to four. Technically the braille patterns correspond to 'a-j' vs '0-9' because I haven't included the number register mark… but hey… it's teaching me braille patterns.
CO₂ Text
Numbers, that scroll. For a bit of flavour the background colour corresponds to low, medium, or high CO₂ levels.
CO₂/Temperature/Humidity
This one is just a simple bar graph that refreshes with a new reading. A letter on the left half of the matrix conveys whether the bar represents carbon dioxide, temperature, or humidity. The height and colour of the bar is dependent on levels for each of those variables.
 Thornhill!