 Guillermo Perez Guillen
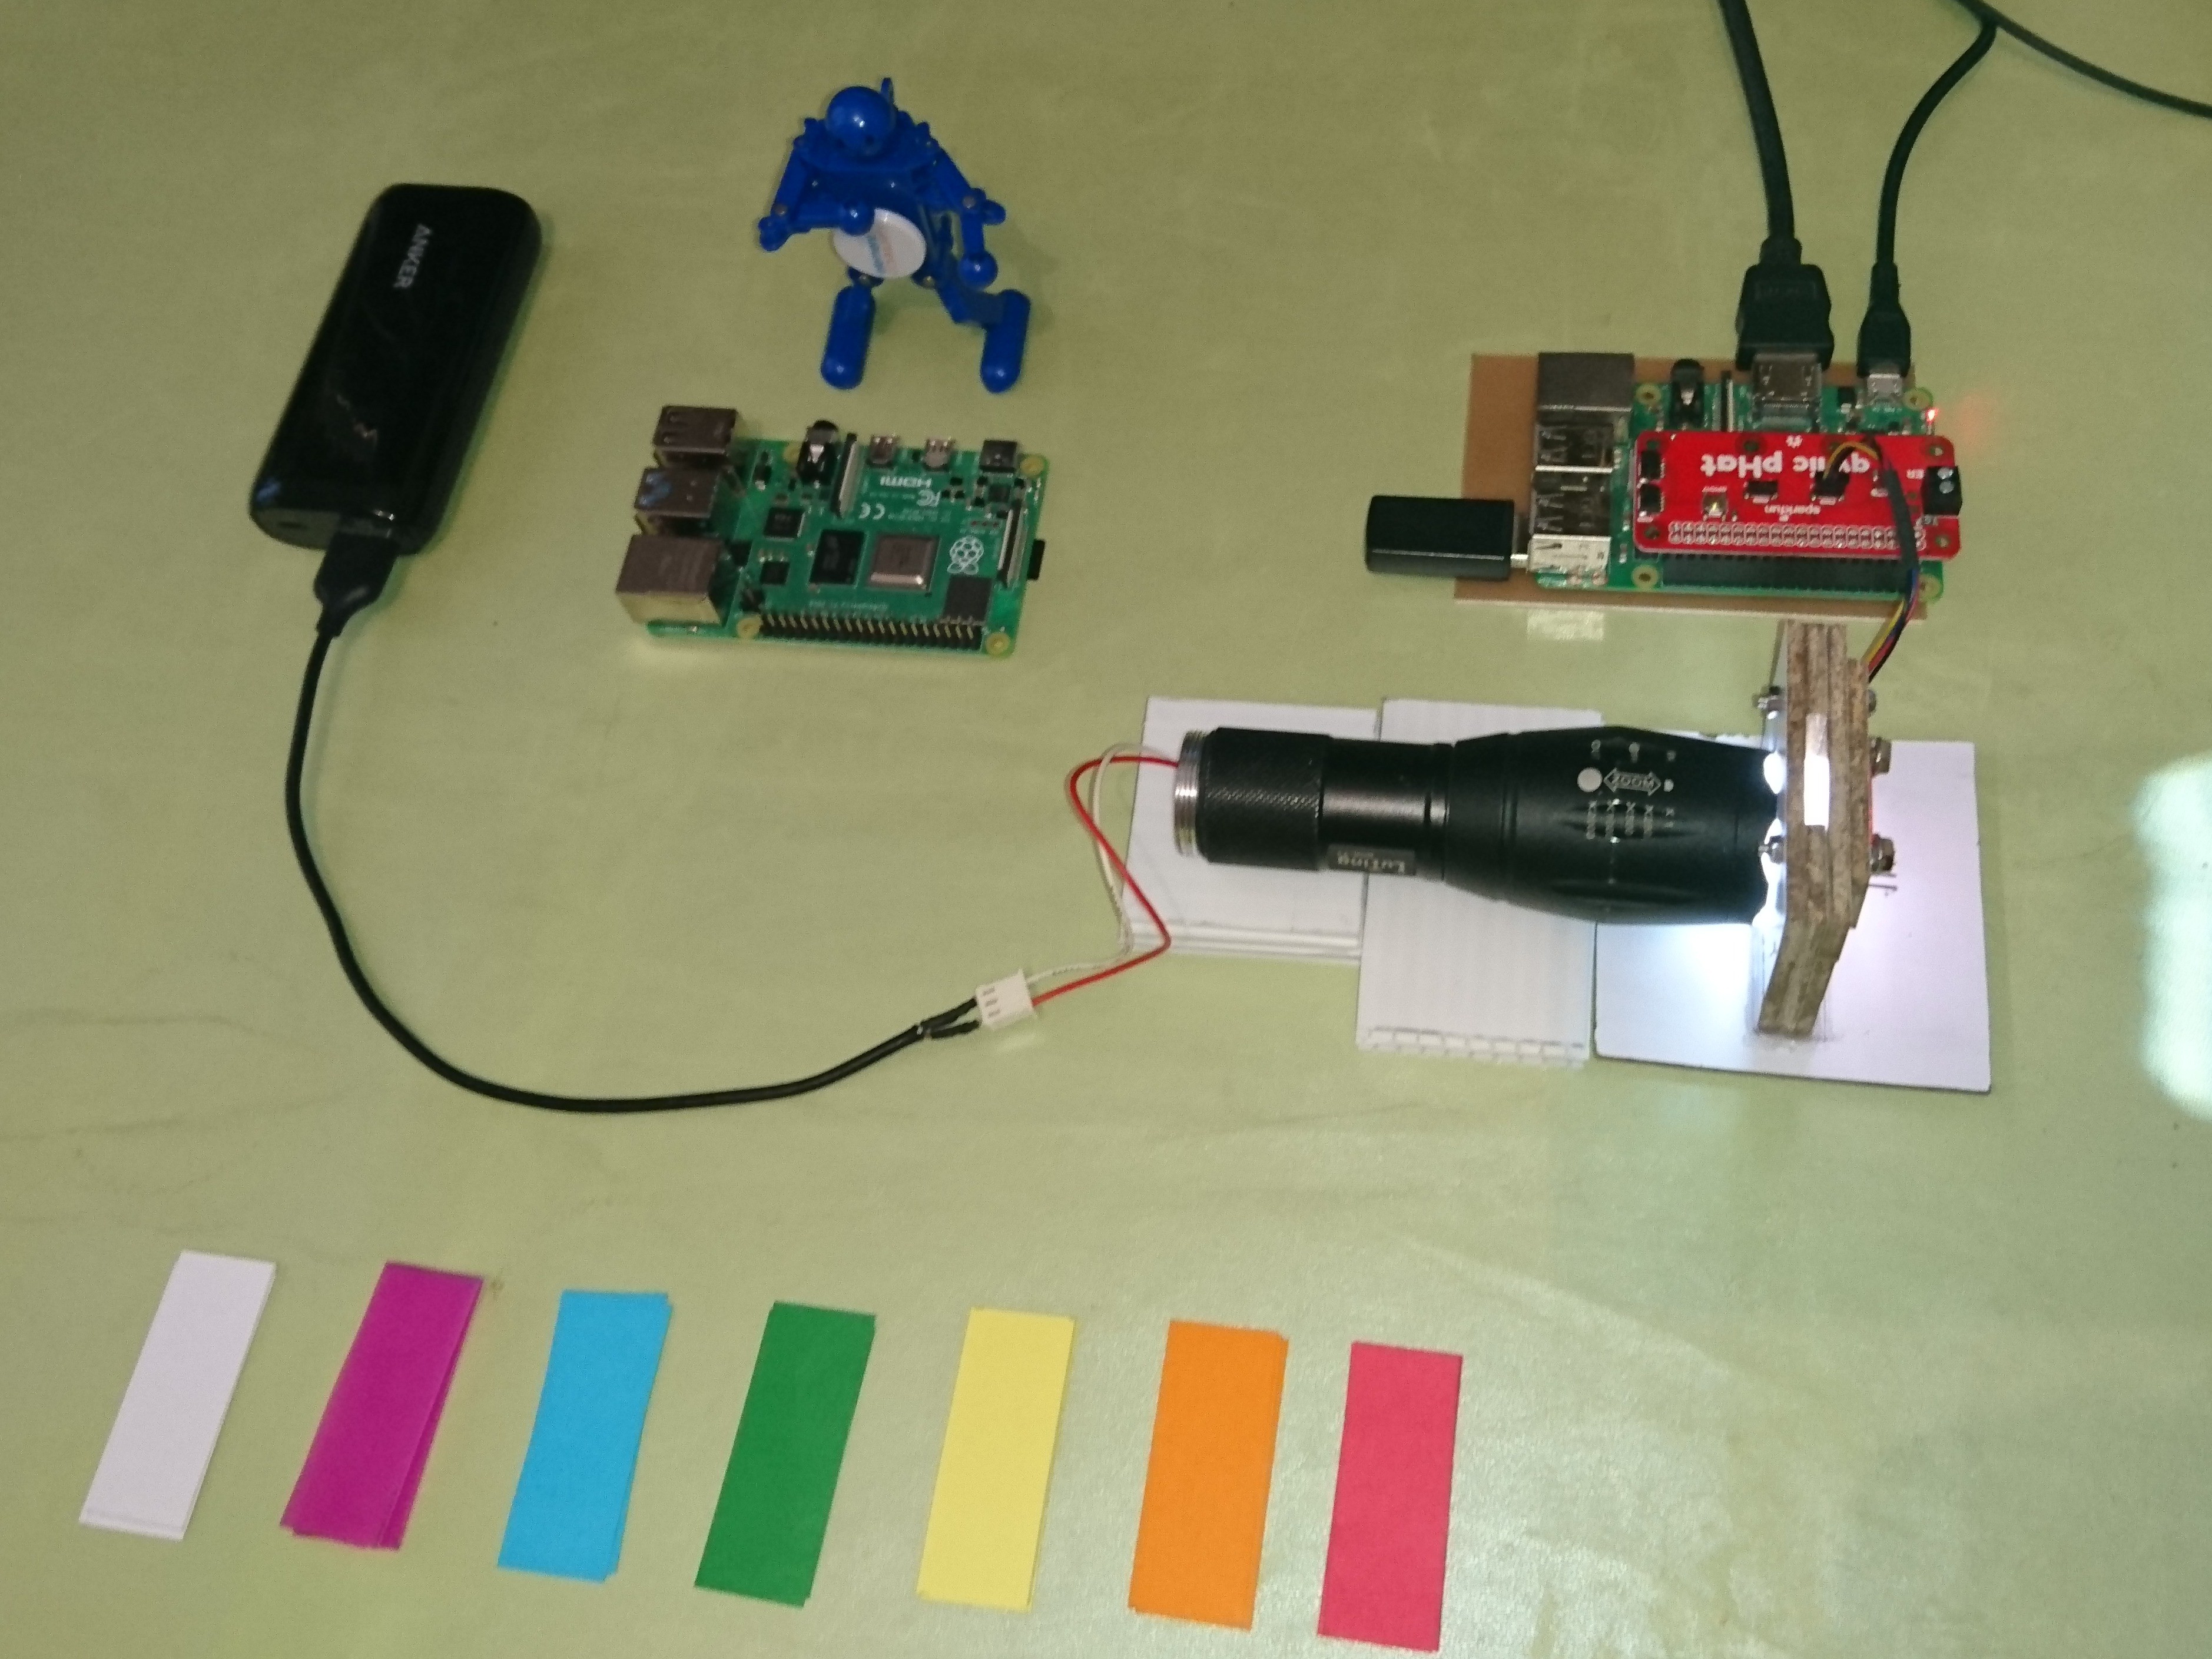
In this chapter I will show you how to assemble a filter spectrometer, as well as the first tests with the six colors that the AS7262 sensor detects. Personally I can tell you that this project is exceeding my expectations since it works fine.
Device Assembly
I used 3mm MDF board to build the filter spectrometer, as it has good tamper resistance and because it would allow me to experiment until I got the right dimensions to mount the AS7262 sensor. Below I show you the cuts I made.

The dimensions of the large strips are 20(W) x 60(L)mm, and the short ones are 20(W) x 20(L)mm. I have then joined them with Kola Loka glue as shown below.
The "U" shaped figure is placed in the middle of the "O" shaped figures. I have also put a base of 75(W) x 75(L)mm as shown in the image below.
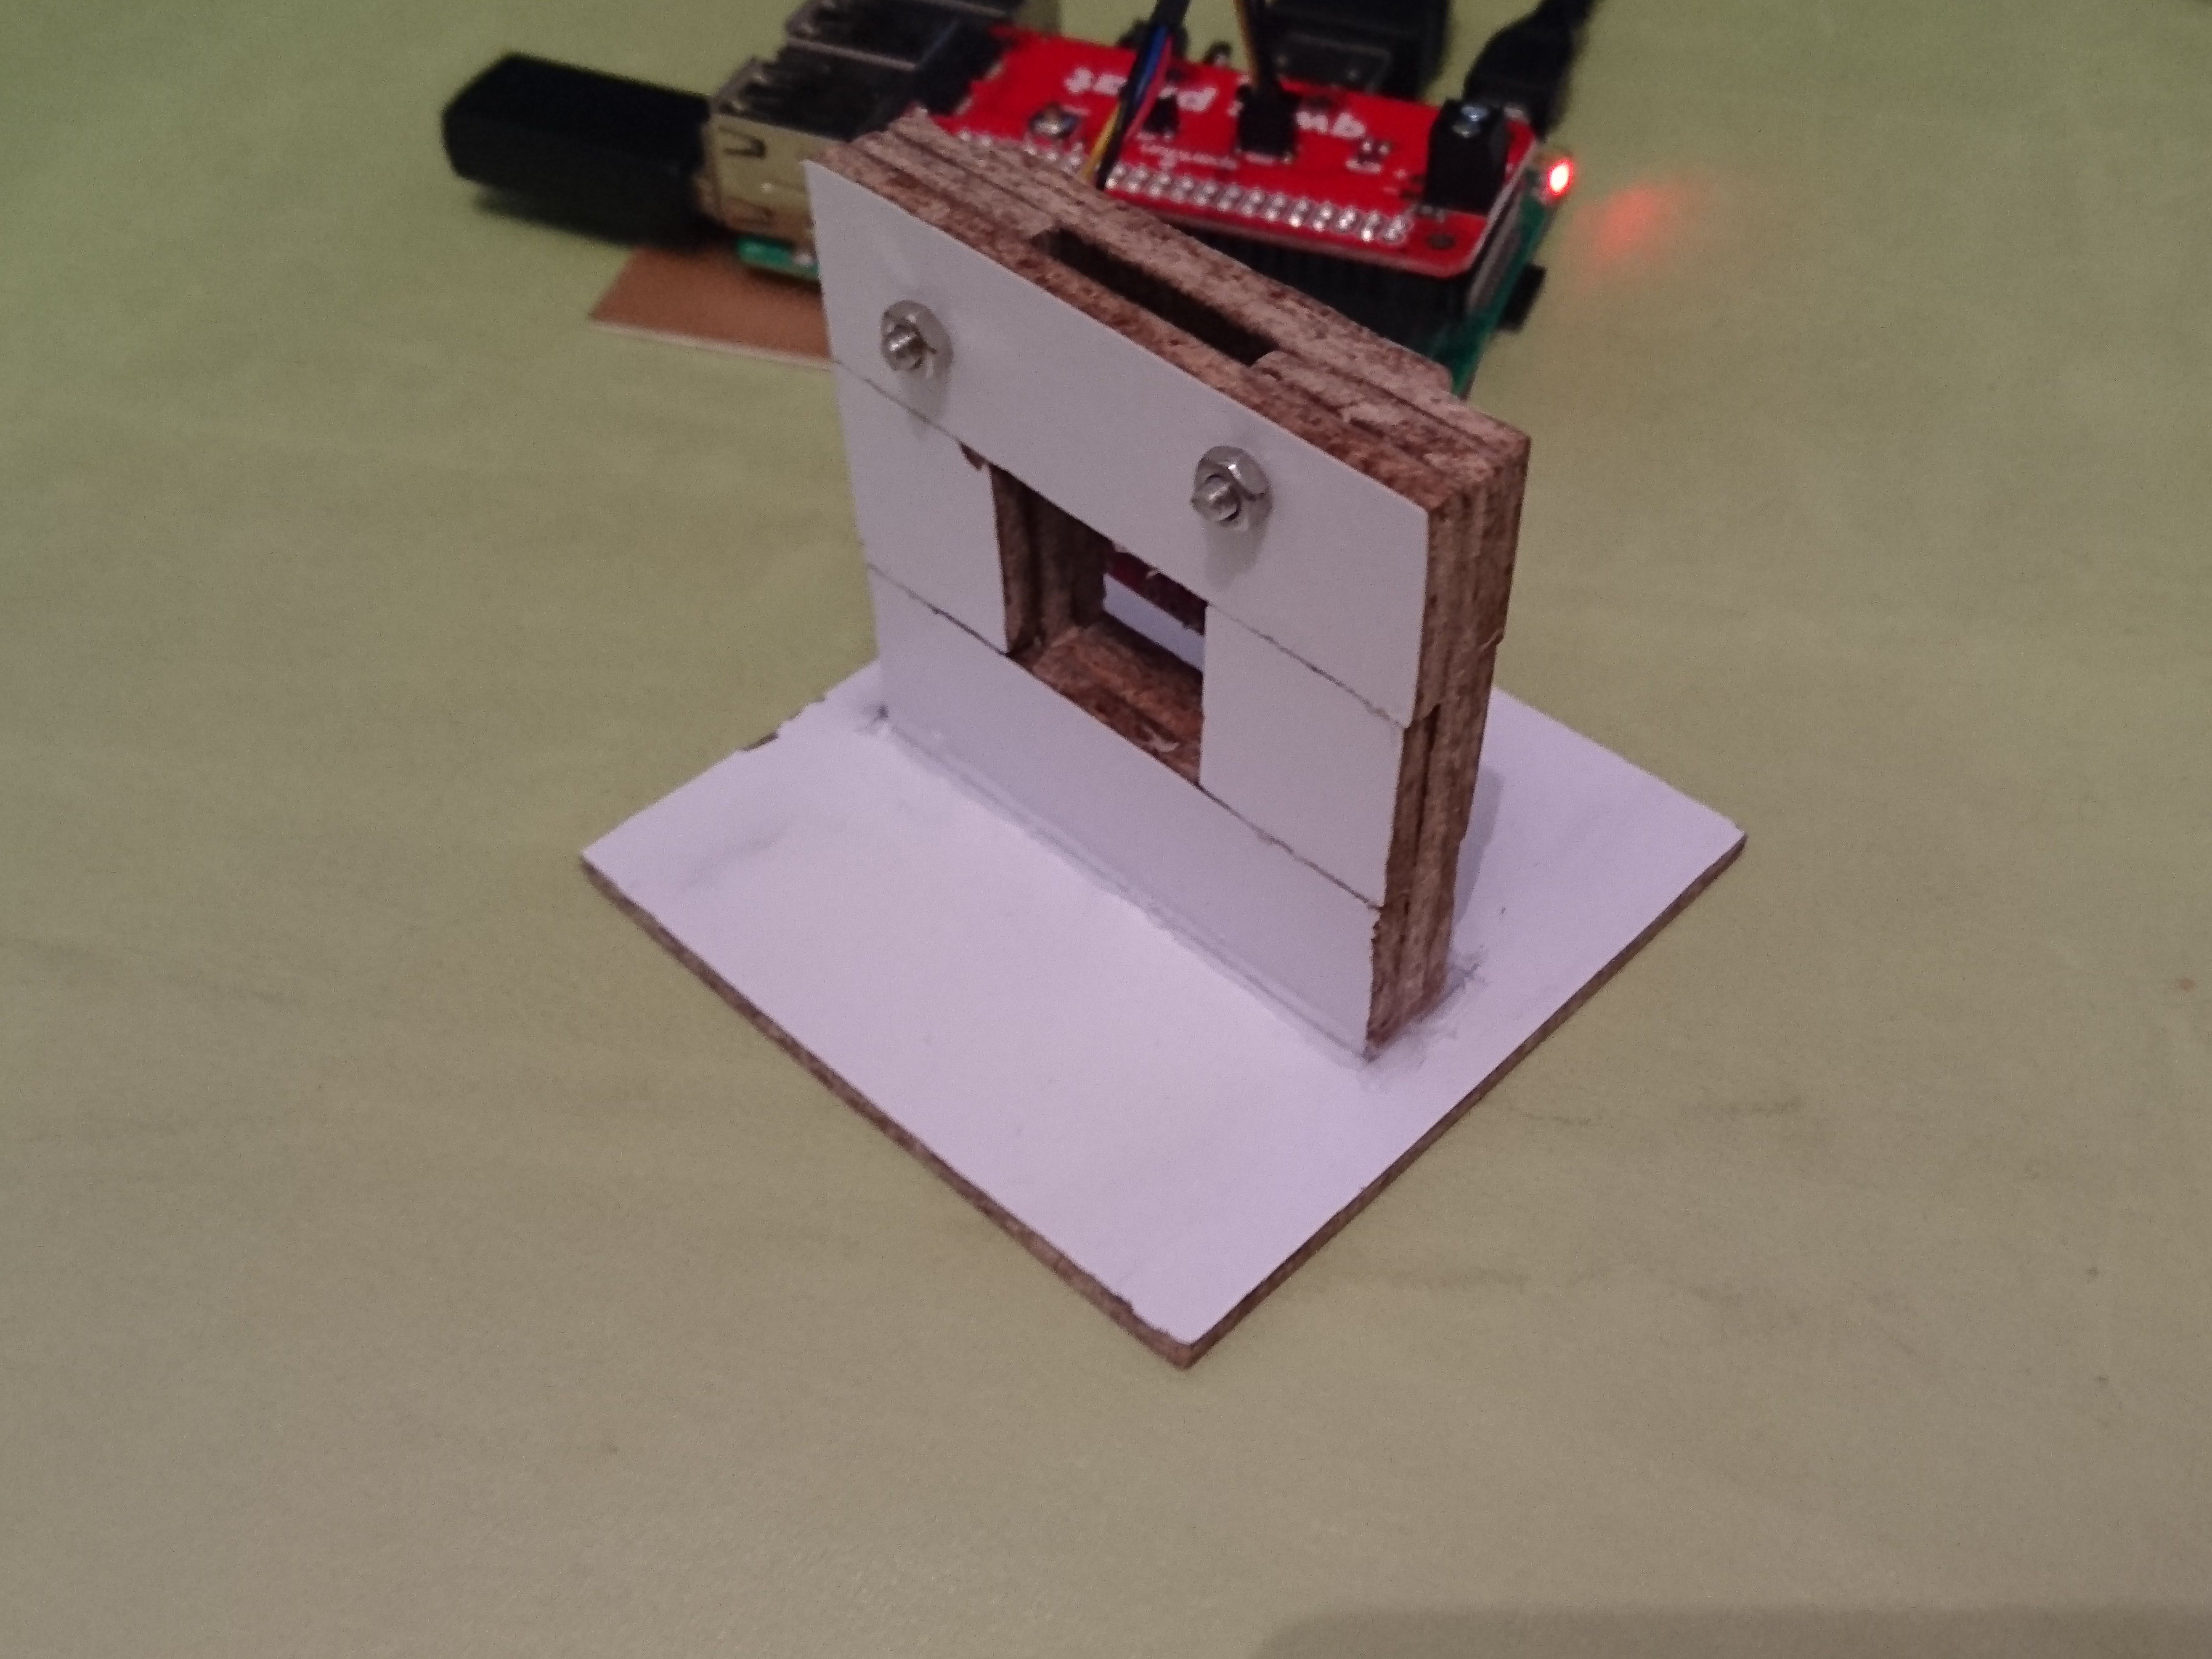
I have used wood sandpaper to reduce the protruding edges. In the end I have mounted the sensor by means of a 20(W) x 45(L)mm strip as shown in the following image.

You should also consider using a drill and silicone, as well as having four screws. Here, I think I spent more time trying to center the sensor.

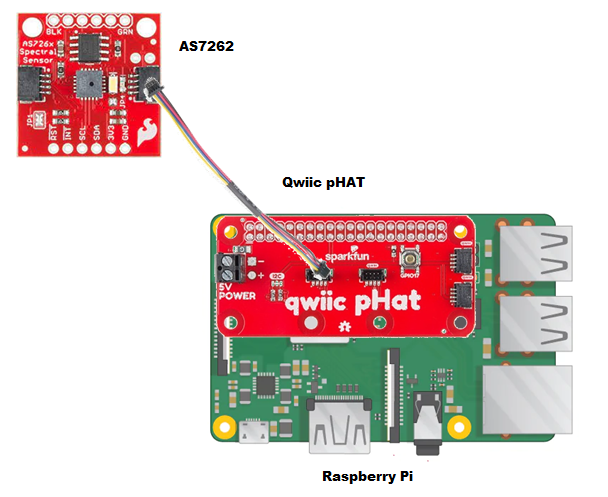
Schematic
I have carried out three experiments, which I describe below. The first two I have repeated the examples of the installed library, and the third example is a modification that I have made to capture data in a text file for future analysis.
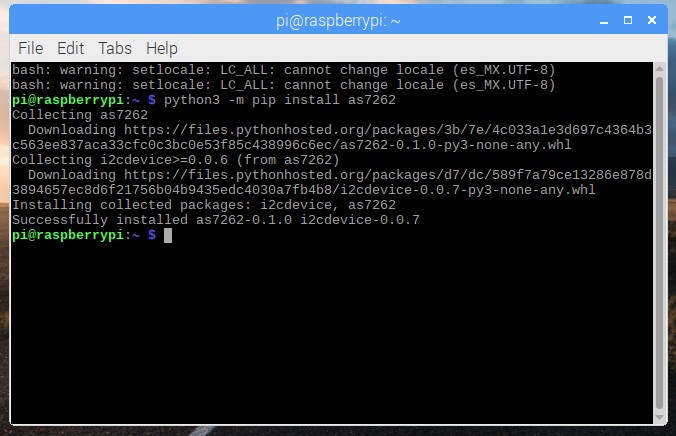
Library Installation
I have installed the library from the following github repository: https://github.com/pimoroni/as7262-python
It is a stable library and you just have to enter the following command:
python3 -m pip install as7262
Additionally, I have installed the following library that is used for the AS7262 (visible light) and AS7263 (infrared light) sensors: https://github.com/HeyLlama/as726x-python
git clone https://github.com/pimoroni/as7262-python

cd as7262-python

sudo ./install.sh --unstable

Spectrum
Below I show you the code of this example. Here we obtain the values of the spectrum of visible colors detected by the sensor (violet, blue, green, yellow, orange and red). Note that the AS7262 sensor has a 16-bit ADC, so it measures an integer part and a decimal part.
spectrum.py
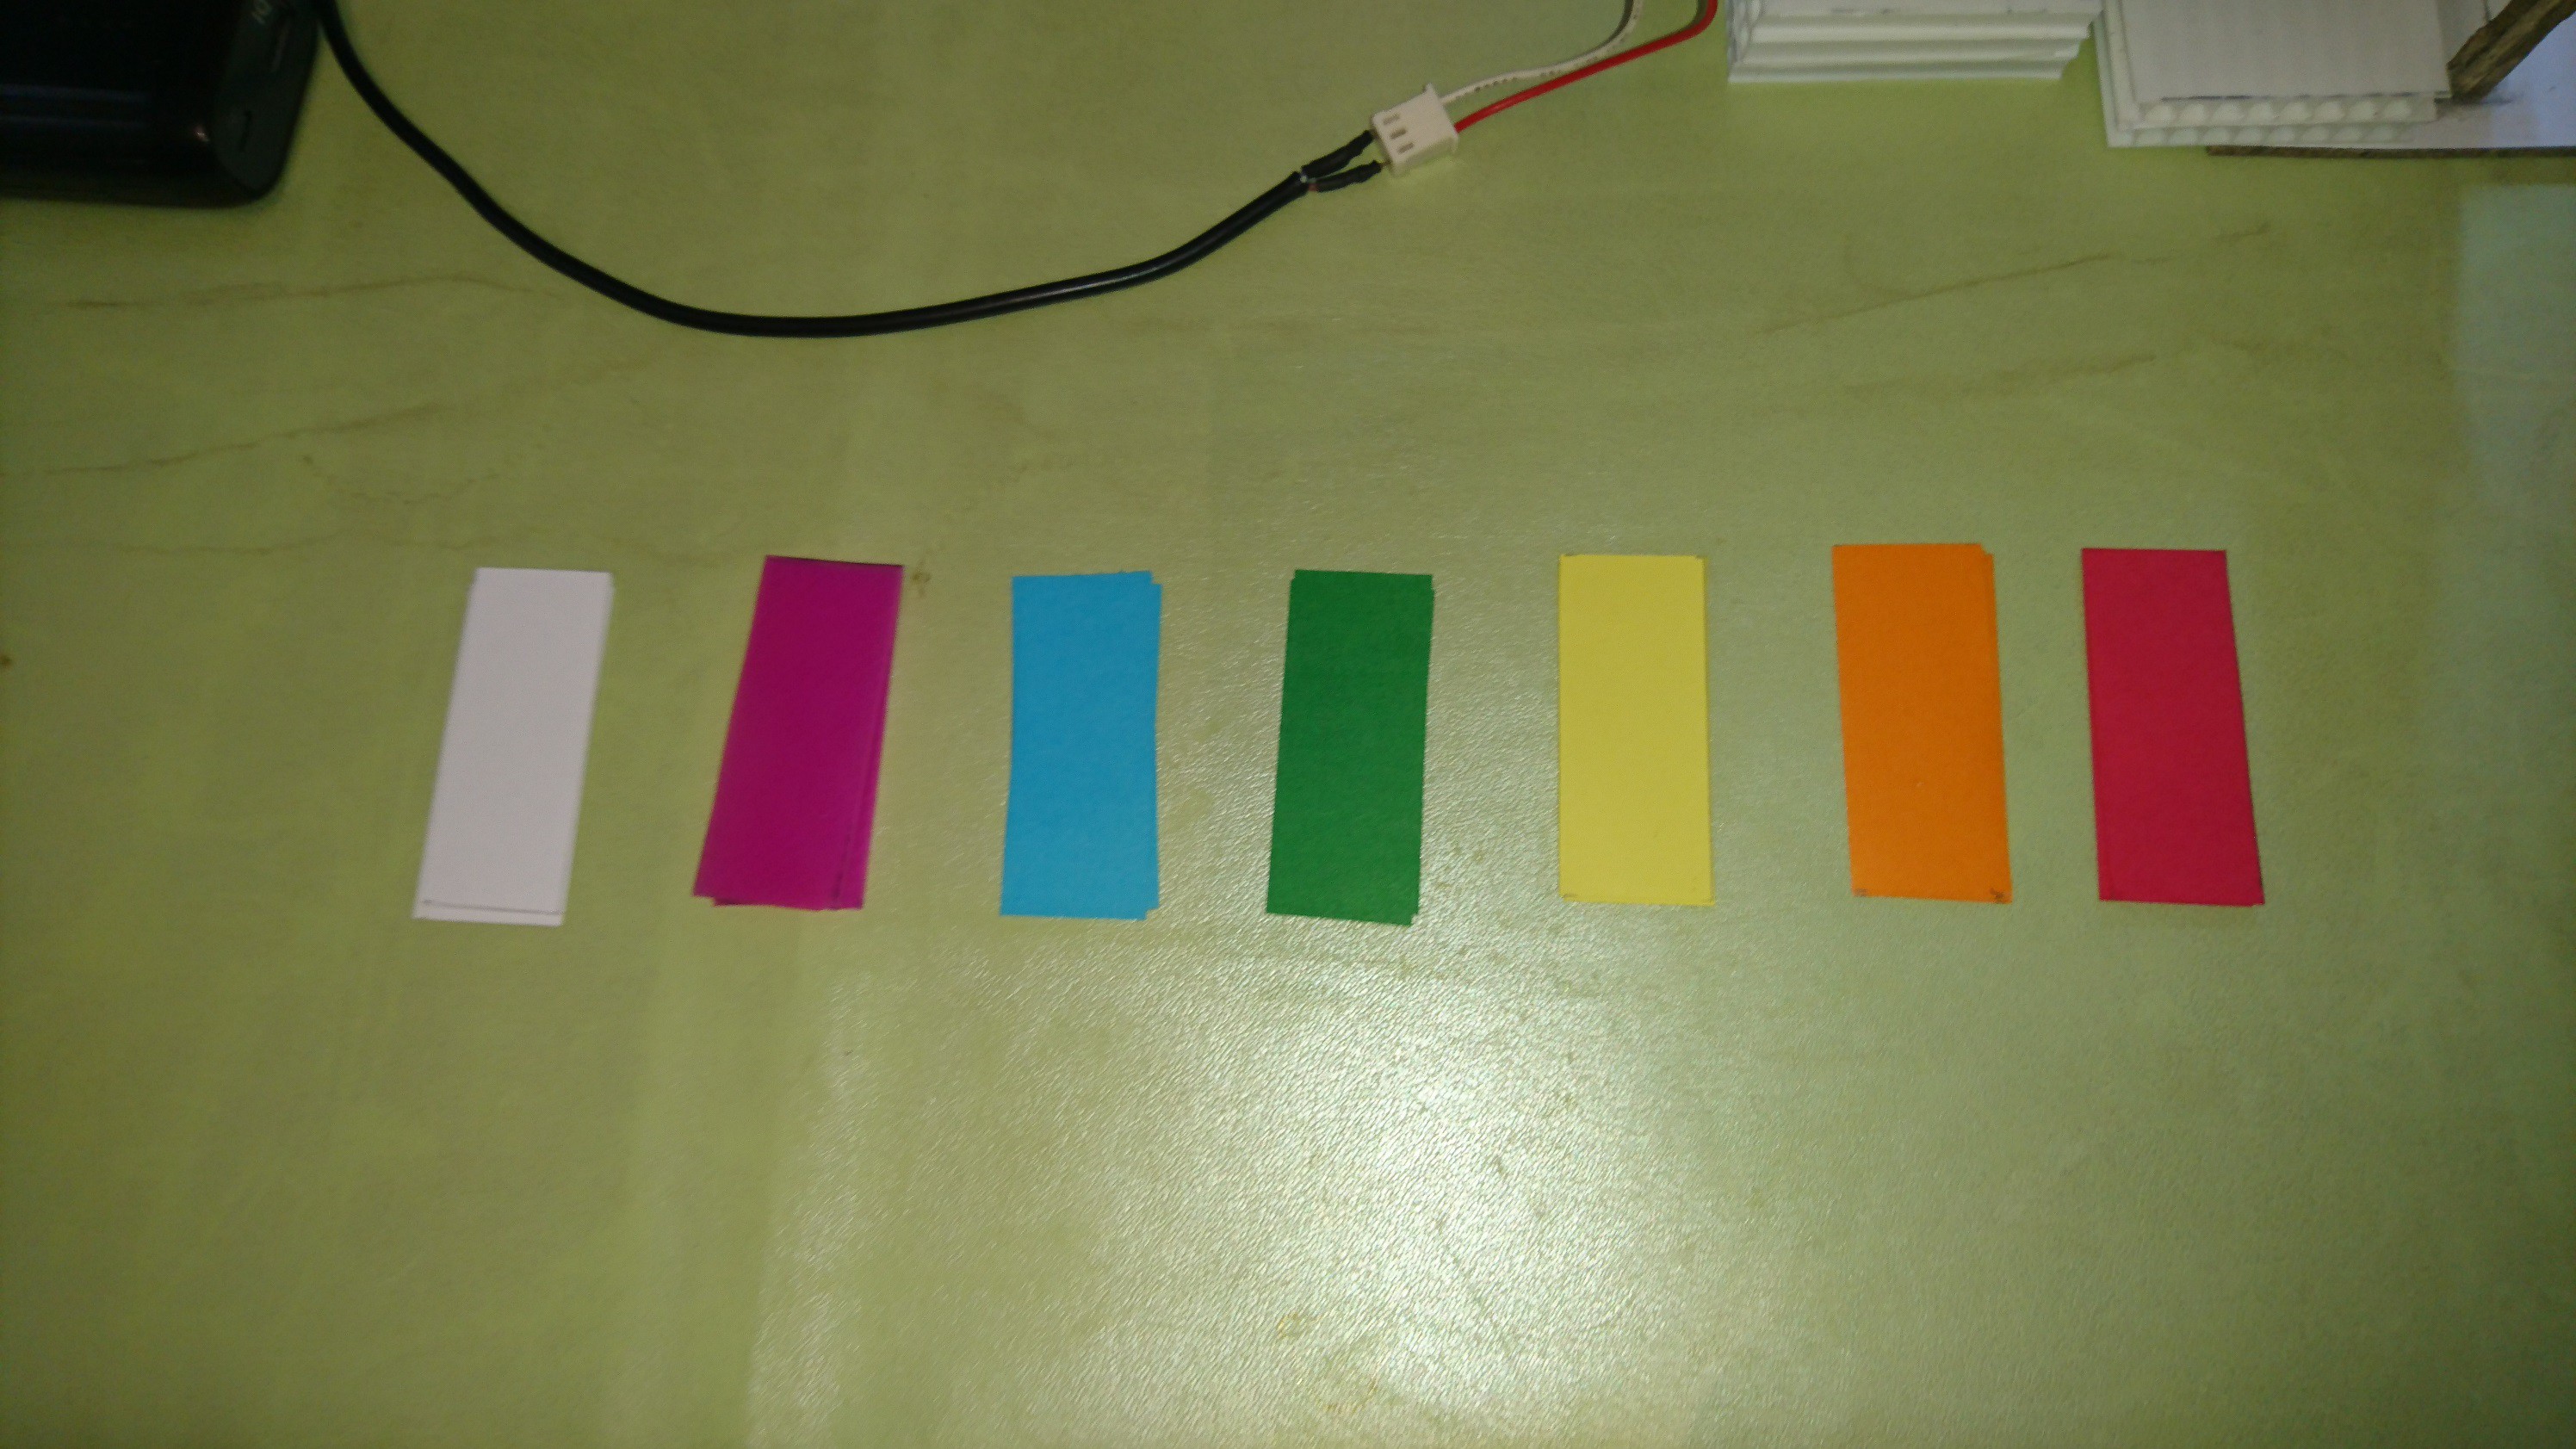
Before the test, I show you the colored filter strips that I used in my experiment. I have used strips of paper with color on both sides with the dimensions of 20(W) x 50(L)mm. Through experimentation, I discovered that sometimes inserting one color strip was enough, and in other cases two or three color strips were inserted to detect color satisfactorily.
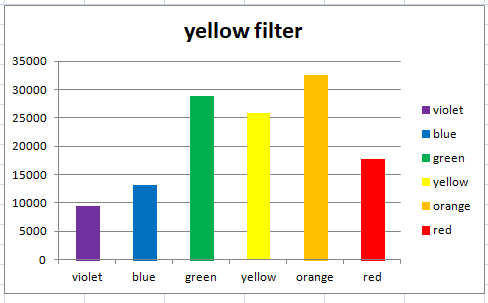
Bar Graph
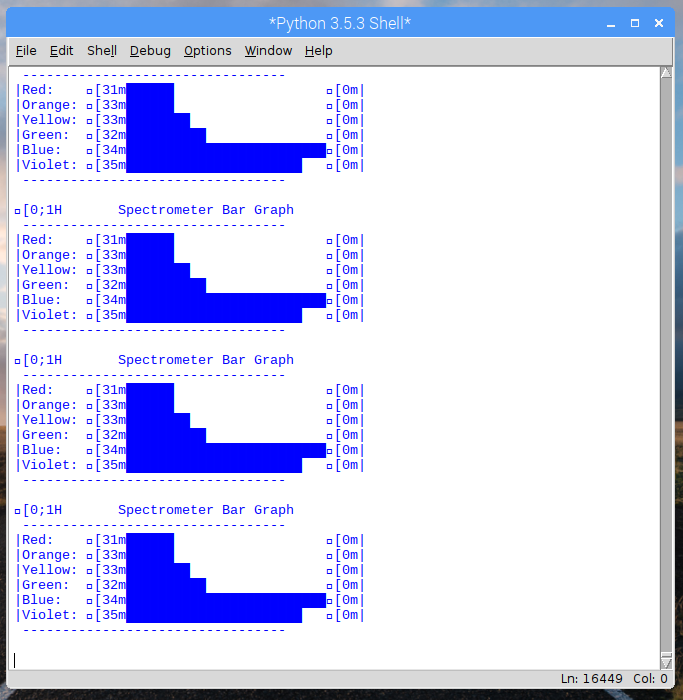
The following code shows us a bar graph of colors detected. Unlike the previous experiment, this one shows us the values qualitatively. In this way we can deduce that the filter absorbs one or more colors, and they are the same colors that the sensor detects.
bargraph.py
Below is an example of the graph obtained for the blue filter.
Data Captured
Here we use the AS7262 functions to operate the board. It begins with some initial setup, and then puts the board into measurement mode 2, which continuously takes measurements for all colours. This is returned as a list called "results", which is then printed in a mostly human-readable form. Additionally, a text file is created to save the sensor values each interaction, and the script is interrupted when we use Ctrl+C.
datacaptured.py
Below I show you an example of data captured for the green filter.
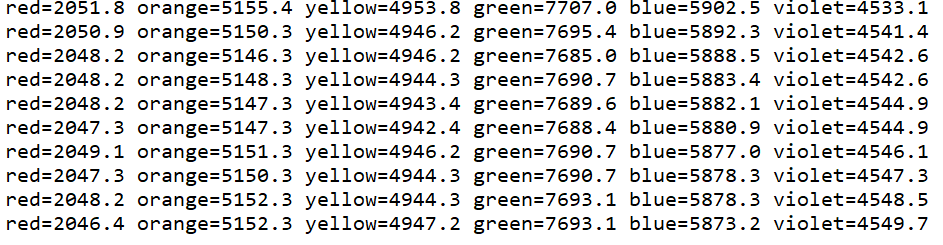
My idea is to use this data to make graphs in excel and analyze the information statistically.
Conclusion
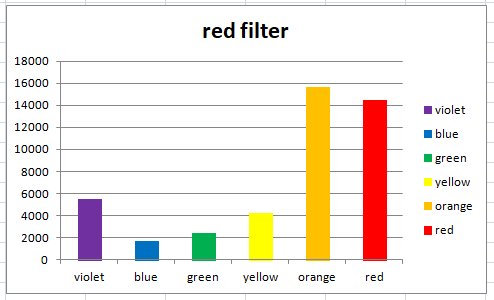
According to what was seen in chapter one (introduction), a part of the light emitted by the lamp reaches the AS7262 light sensor due to diffraction. Next I show you the most important conclusions with the color filters.
- A blue filter weakens the yellow, orange and red signals very strongly.

- In contrast, a red filter will block blue and green light strongly.
- A green filter will block red light.

- A yellow filter will block blue and violet light slightly.
Discussions
Become a Hackaday.io Member
Create an account to leave a comment. Already have an account? Log In.