 Hugh Brown (Saint Aardvark the Carpeted)
First paper: Elastic wave modes for the assessment of structural timber: Ultrasonic echo for building elements and guided waves for pole and pile structures (DOI: https://doi.org/10.1007/s13349-014-0087-2, though that goes to a paywalled copy) by Martin Krause, Ulrike Dackermann and Jianchun Li. This had a lot of good background on sound propagation in wood and ultrasonic tomography. It also covered the topic of reflections of ultrasonic pulses -- which is something I'm starting to wonder about.
What's really good here, though, is the section on guided waves -- waves generated in a finite body (here, they consider pilings) that reflect both off the end of the body and off discontinuities or changes in structure:
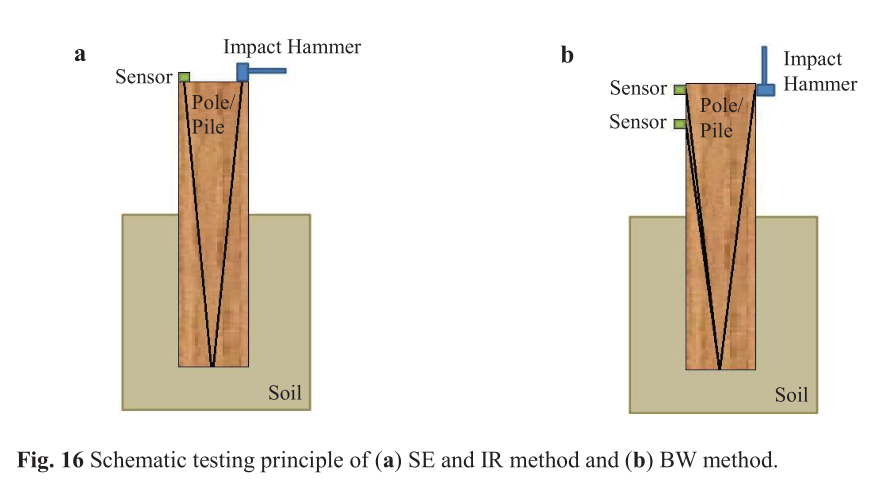
Here, "SE" is sonic echo; "BW" is bending wave. "IR", a third method not in that diagram, is impulse response. Sonic echo and impulse response use the same testing method: hammering the end of the pile. The difference is in how the data is analyzed: time (SE) vs frequency (IR). By contrast, BW hammers the side of the pile, sending a bending wave down the structure; multiple sensors are used to measure the reflected waves.
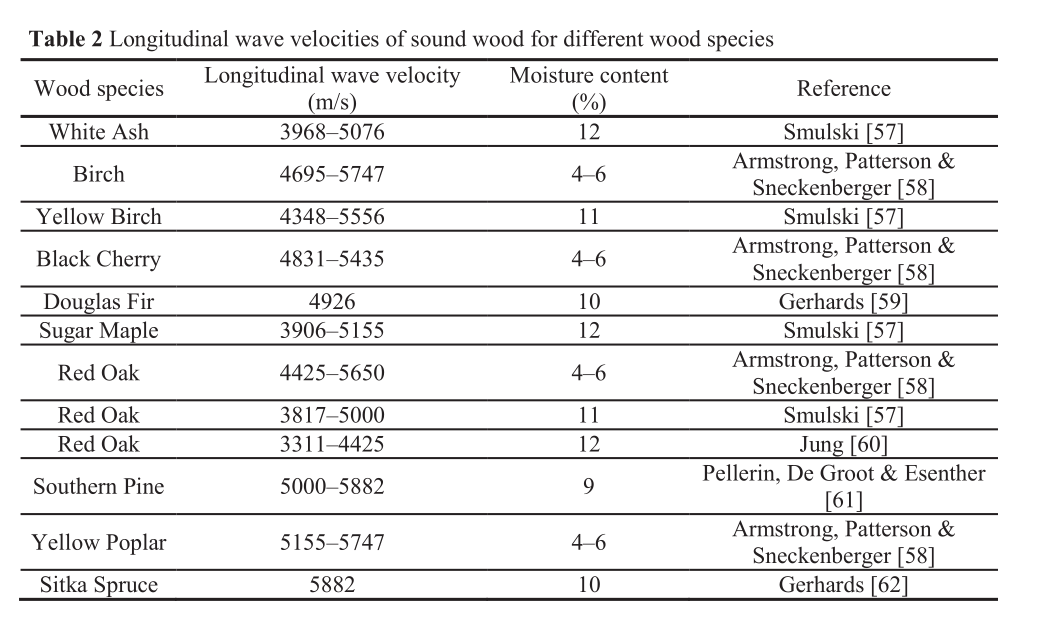
The guided wave technique seems closest to what I have in mind -- at least for initial testing with the 2x4 of Science(tm) -- and this section is quite valuable. So is the table of velocities in different sorts of wood:
The consideration of choice of impact device (hammer to you and me) is also interesting:
For the SE method, an ordinary hammer is sufficient, while for the IR method and the BW method, a modally tuned impact hammer equipped with a load cell is beneficial to capture the force of the impact needed to calculate FRF data. An important feature of the hammer is the type of the hammer tip (hard, medium or soft). While hard tips produce high energy signals at high frequencies, soft tips generate lower energy signals at lower frequencies. In general, it is important to execute an impact that produces a frequency spectrum that provides adequate information for GW analysis. For SE/IR testing, it is recommended to generate an impact with a frequency range of up to 5000 Hz, while for BW testing, frequencies up to 3000 Hz should be excited. A higher excitation frequency bandwidth can also be achieved by mounting a steel plate or inserting a steel bolt to the timber pile/pole and inducing the hammer impact at the steel plate or steel bolt. To generate high quality wave data, the hammer impact should produce signals of minimal signal attenuation. The researchers Pandey & Anthony [40] found that a hammer of about 1.4 kg with a medium density plastic tip produces a good combination of signal energy with minimal signal attenuation for high quality signal data.
Overall, a very interesting paper that's only slightly intimidating. 😅
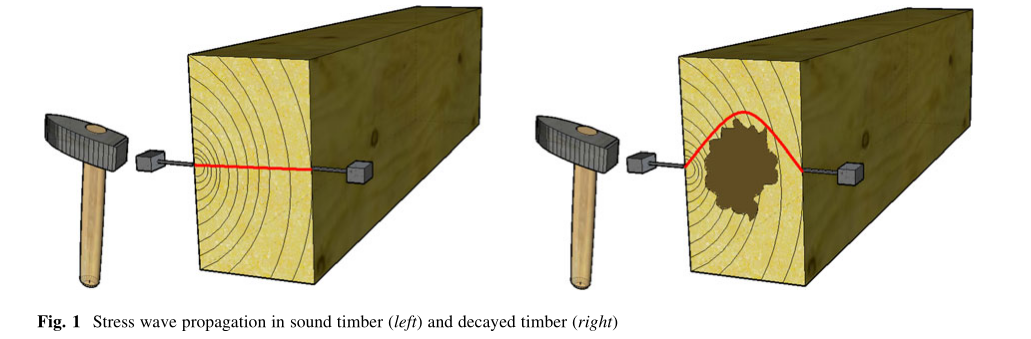
Next up, the closest paper to what I have in mind: In situ assessment of structural timber using stress-wave measurements (DOI: https://doi.org/10.1617/s11527-013-0095-4, though again that goes to a paywalled version) by Dackermann, U., Crews, K., Kasal, B. et al. Just look at figure 1:
This paper has some pretty practical considerations laid out: repetition of impacts to get average results (and throwing away the first measurement), considering moisture content and temperature, and my favourite part:
In general, if the stress wave velocity is lower than 10 % of the reference value or measurement results are fluctuating, the timber section should be suspected of having internal decay.
Off by an order of magnitude from what you were expecting? There might be some decay. 🤣 (The velocity table they include in this paper is the same as the one from the previous paper, BTW.) To be fair, they do outline all the things that go into that: transverse waves (left-hand illustration in figure 1) go about 1/5 to 1/3 the longitudinal speed; waiting for piezo sensors to warm up; and orientation of the wave with respect to growth rings
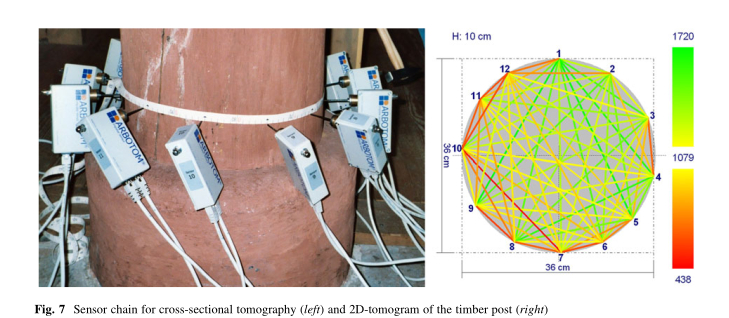
That first section is on simple time-of-flight measurement. The second, which covers tomography (both sonic and ultrasonic), is also interesting. Here's figure 7, showing an array of sensors around a timber post:
They show some cool results, including this composition of a number of scans (left side of the figure) of a test article with various things drilled out of it (right side of the figure):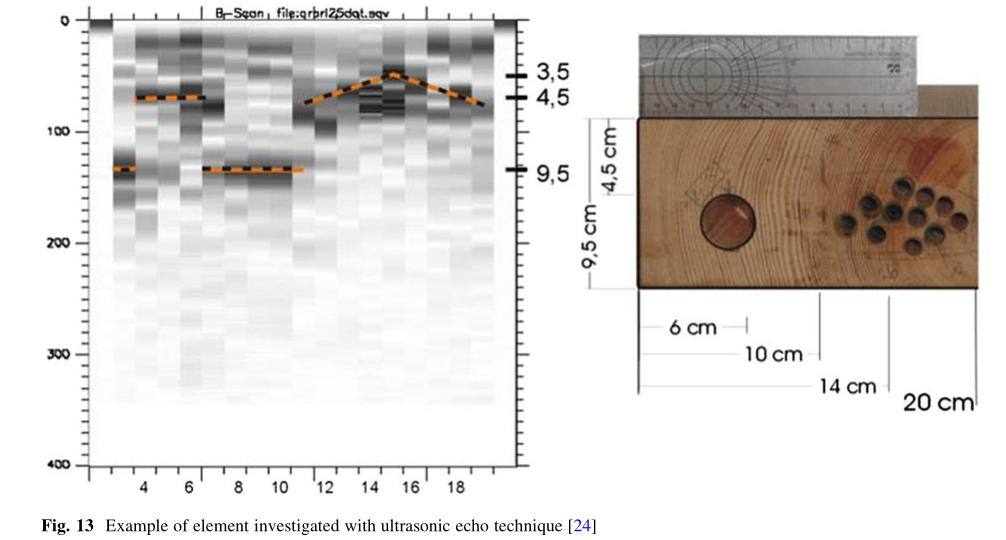
This was done with ultrasonic tomography:
In general, sonic stress wave assessment is suitable for timbers with a depth greater than 89 mm, while ultrasonic testing is appropriate for smaller sizes.
The paper gives this formula for calculating resolution: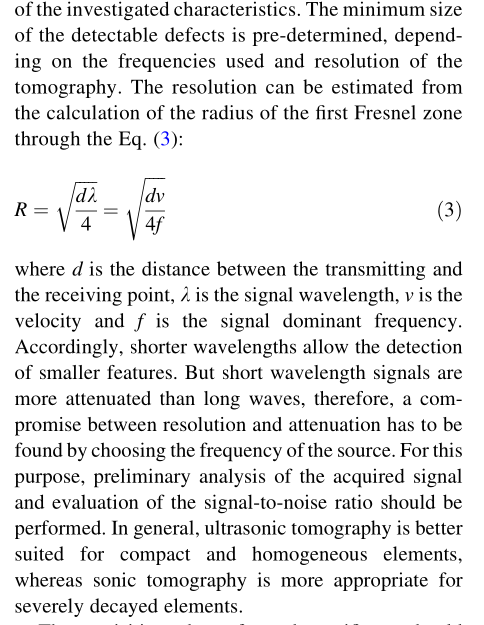
- Earlier in the paper, they discuss sending low frequency signals with a hammer, meaning < 10 kHz. Assuming a nominal frequency of 5000 Hz.
- For velocity, I'll use the very rough average of 4000 m/s for longitudinal stress wave velocities (Table 5 in the paper).
- For distance between transmitting and receiving, I'll say 1m.
Put that all together, and what I get is an estimated resolution of about 44 cm. I can make that better by decreasing the distance, increasing the frequency, or -- somehow -- lowering the velocity.
All these papers, btw, are in the Github repo I've created for this project.
Next up: some actual measurements!
Discussions
Become a Hackaday.io Member
Create an account to leave a comment. Already have an account? Log In.