 Hugh Brown (Saint Aardvark the Carpeted)
I've been using The 2x4 of Science as a test article for this project. Three piezo sensors were clamped in place on it:
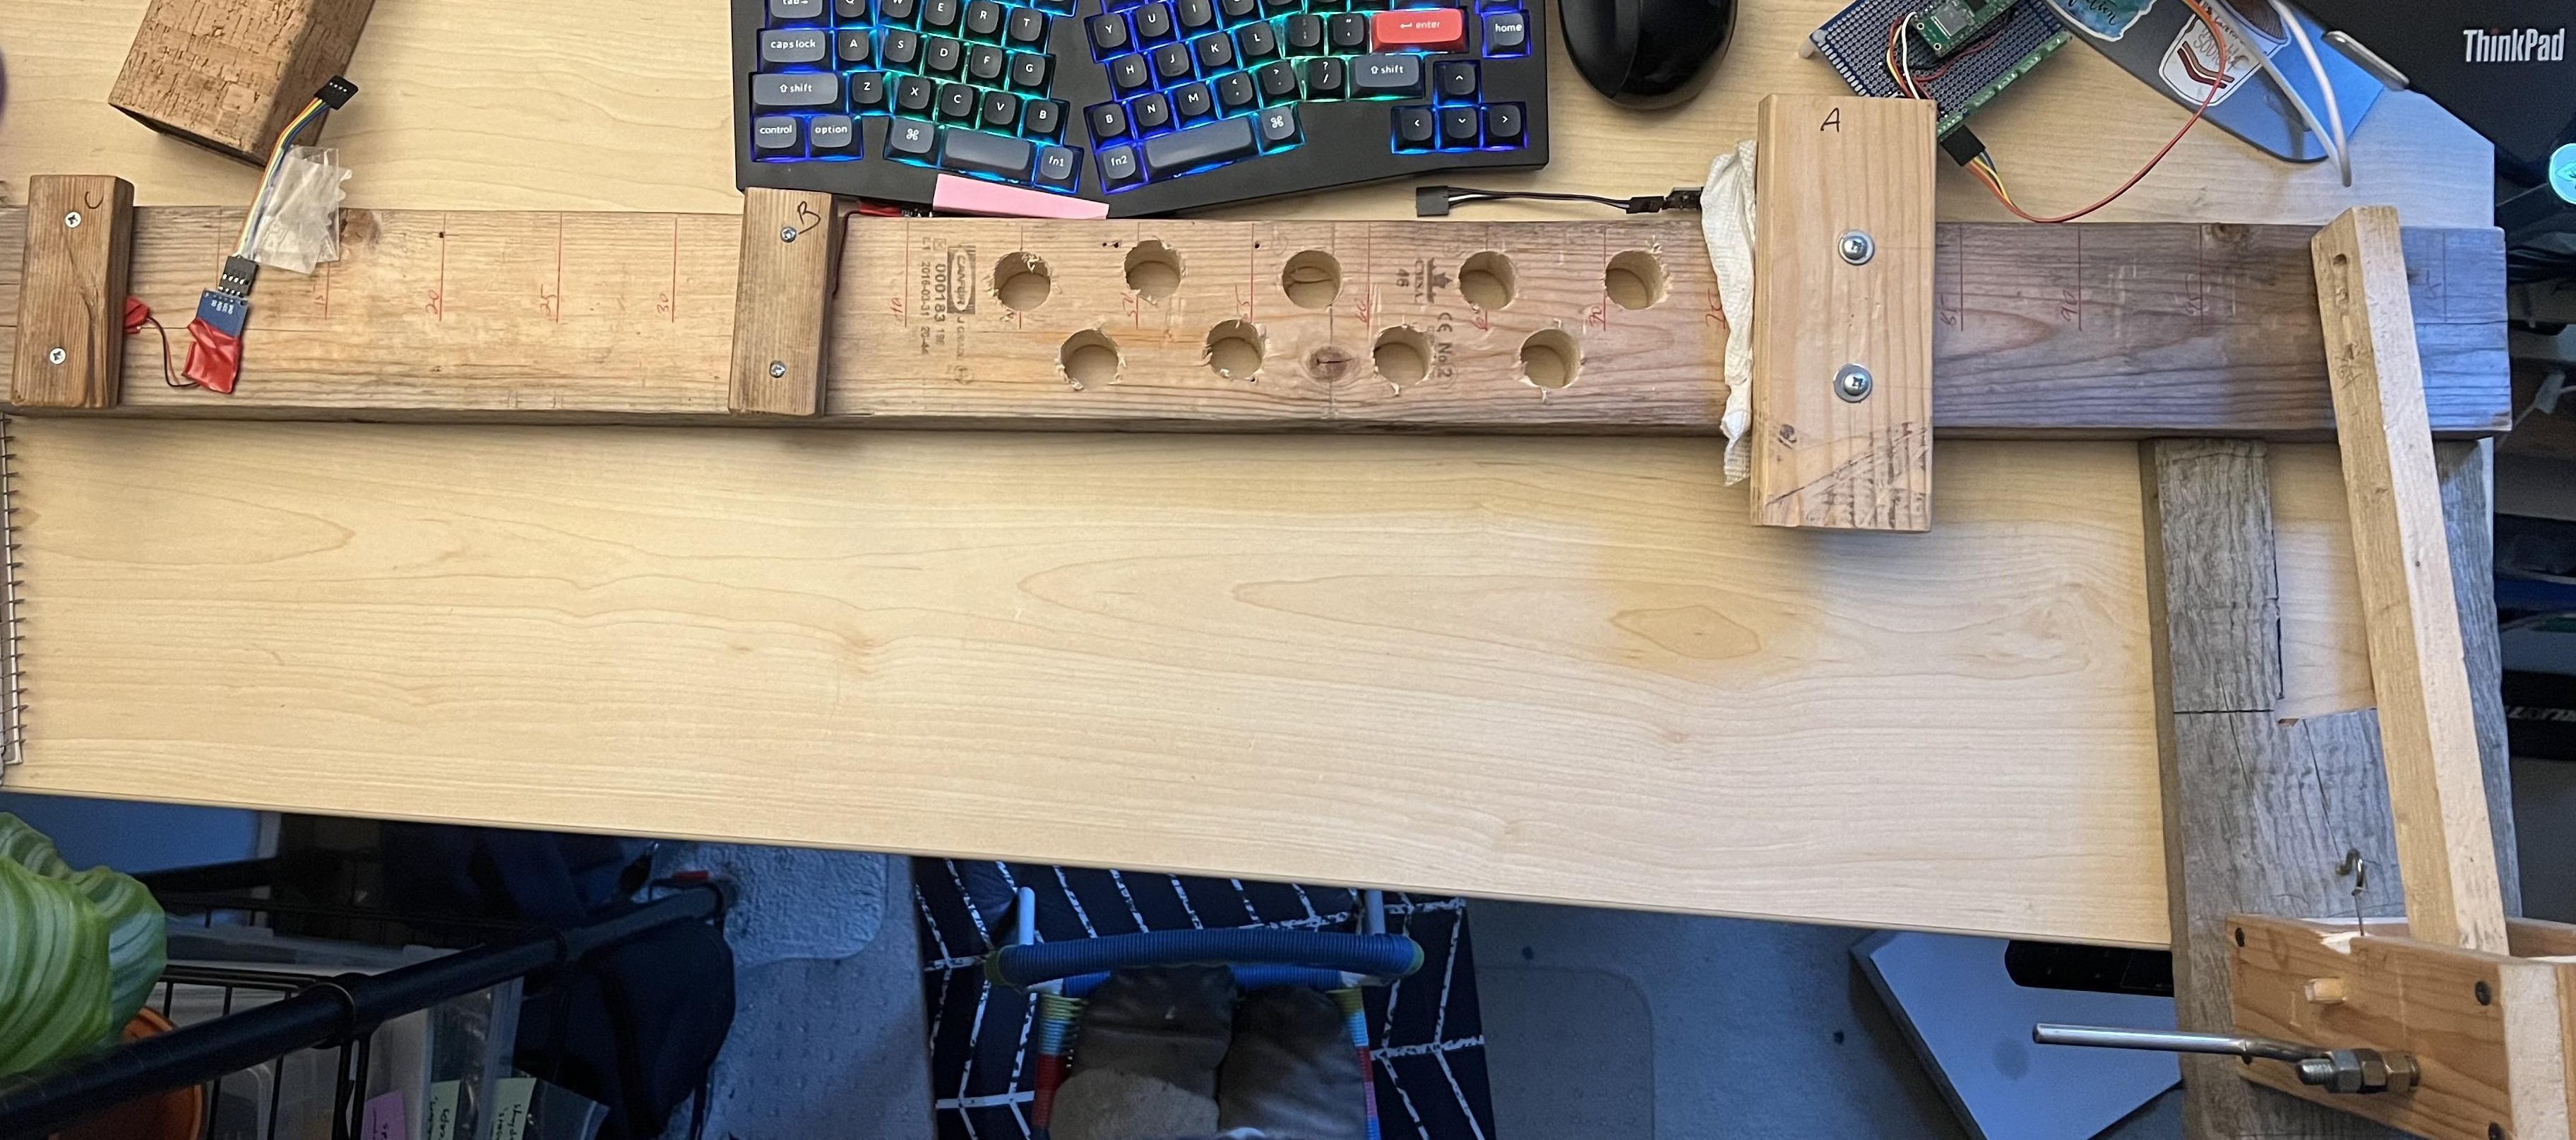
(Ignore the holes for now. I'm not always great about taking pictures as I go.)
A is on the right; B is in the middle; C is on the left. The red lines are 5 cm apart. Here's a table showing the distances they're set at:
| Sensor C | 5 cm |
| Sensor B | 35 cm |
| Sensor A | 80 cm |
| Hammer impact | 100 cm |
Thus, the distances for the three segments are:
- A → B: 45 cm
- B → C: 30 cm
- A → C: 75 cm
And since the hammer is at the 100cm mark, the vibration should hit A, then B, then C.
Data capture is, at the moment, tedious. I hook up the pico to my laptop, hook up two of the sensors (say, A and B) and start a screen session. I do a batch of 20 impacts; the timing for each one gets printed to my terminal: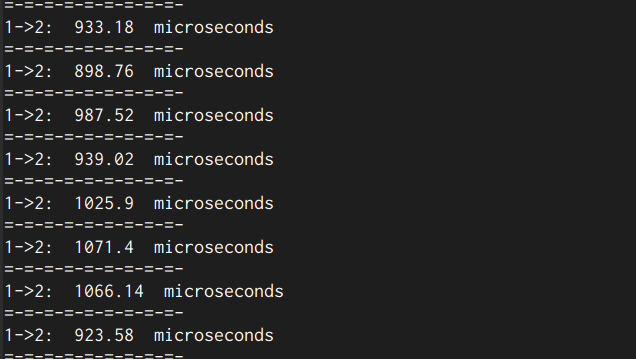
For extra fun, I made a point of tearing down the equipment between each run: disconnecting the sensors and the pico, taking the 2x4 of Science off the desk, then putting it all back together. I wanted to see if there was any difference being introduced by moving the equipment around.
And what did I find? Here's a strip graph (I think that's the right term) showing the results of 80 runs:
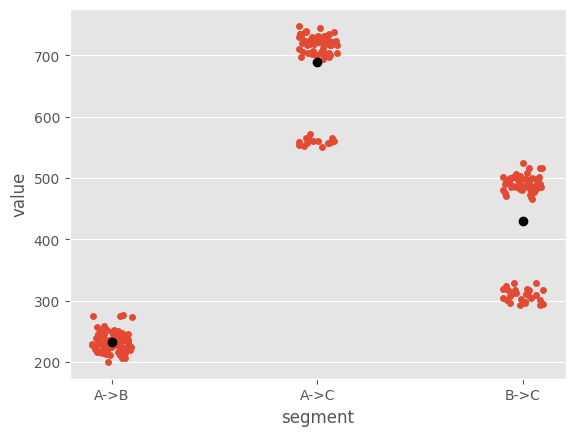
The Y axis is microseconds. For each segment the red dots are individual times, and the black dot is the mean. Remember, the hammer was beyond the A sensor, and vibration travelled from A → B → C. Here's what I notice:
- A → B is pretty tightly grouped. The mean of 250 microseconds is pretty clearly sensible.
- A → C (mean: 659 microseconds), and B →C (mean: 404 microseconds), by contrast, show two distinct groups each; the mean doesn't fit well with the B → C segment at all. More sophisticated Pandas work on my part could probably have made means for each cluster, but it's clear that we have two consistent groupings of times for each one.
- If you add the mean of A → B (250 microseconds) to the mean of B →C (404 microseconds), you get pretty damn close (654 microseconds) to the calculated mean of A → C (659 microseconds).
- If you take the two groups that have longer times for B → C (eyeball mean: 500 microseconds ) and A → C (eyeball mean: 725 microseconds), then the match isn't as good: 750 microseconds vs 725.
- Although it's not clear from the plot, the two groupings were not the result of moving the equipment around; the difference in times appeared in each of the four runs of 20 impacts.
| Sensor C | 5 cm |
| Sensor B | 35 cm |
| Hammer impact | 55 cm |
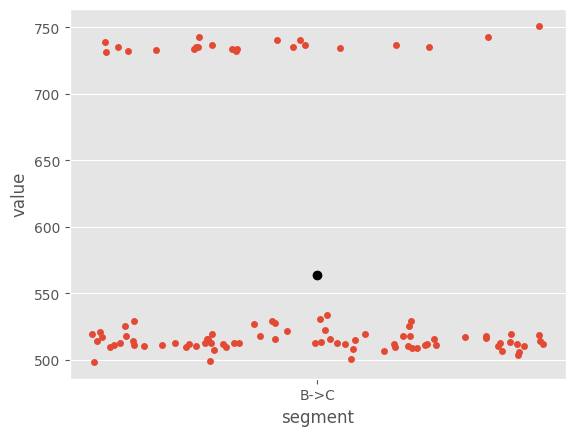
Also notice how the absolute time has changed: there's still about 200 microseconds between the groups, but now they're at ~525 and ~740 microseconds in this trial, vs 300 and 500 microseconds in the first.
I have a couple questions here:
- What's causing the split in times when the B → C segment is included?
- Echo/reflection?
- There's a knot in that segment (but there's also a knot in the A → B segment). If that's the cause, maybe moving the sensor to exclude it would consistify the data.
- Is it just reflecting off the end of the board? If so, getting a longer board might show this.
- Is there something about the software or the sensors that would sometimes pick up the first time the vibration goes past, but another time pick up its reflection instead?
- Software bug?
- Echo/reflection?
- What's causing the difference in times when I move the hammer?
And another thing: why do I need the hammer for consistent times? My understanding is that the speed of sound in a material does not change based on its loudness, but something about consistent impacts really makes timing, uh, consistent.
Discussions
Become a Hackaday.io Member
Create an account to leave a comment. Already have an account? Log In.