Dirk-WIllem van Gulik
So the rough plan is to get a good looking nautical map printed on the front of the PCB using this new Colourful Silkcreen PCB option at JLCPCB that was added to EasyEDA PRO. Then, inspired by the article ``THE SCIENCE OF REVERSE MOUNTED LEDS'', mount LEDs on the back of the map exactly in the spot of a lighthouse, buoy and so on. And them have some Arduino or similar flash these in the right patterns. And finally submit this to EasyEDA their Spark 2023 trial programme.
Lights
As to some background - maritime navigations at night relies in no small part on beacons, lighthouses and buoys with lights that flash in particular colours and lights. With a fair bit of coordination to make sure that any pattern than you can reasonably see (i.e. given the curvature of the earth and so on) is unique.

This is patterns, known more formally as Light characteristics, are shown on naval charts, in pilot guides and Almanacs. These use an abbreviated form; such as 'F R' or 'Oc R(4) 30'. Which then translates to it being a fixed red light; or a light that is occulted shortly 4 times in a 30 second period.
Now a lot of these codes may appear terribly underspecified (to a programmer or mathematician) and incomplete. This is largely as there is a historic assumption that most `flashing' lights do not actually flash (historically that would either be impossible with a flame; or burn our the filament at those high intensities). Instead - the flashing was achieved by shades moving in front of the light; typically by a set of these rotating around the light on a clockwork. And that meant that it was easier to occult (i.e. shortly dip rather than flash), and that patterns where easiest when they are regularly spaced within the repeat period. So there is a bit of mental model to apply when translating these codes into actual flashing patterns. But more about this later.
Maps
The next issue is that of maps. We could, of course, scan an existing naval map; and simply crop and scale this down to size. But that would be far too easy. Thanks to project such as OpenCPN, maps like OpenSeaMap, OpenNauticalChart and Open Street Maps have come leaps and bounds in recent years in terms of supporting sailors.
And thanks to their open APIs - it is not hard to extract the right vector data. In theory. And with lovely tools, such as Bernard R. Fischer his SMRender it is easy to just select some area and render a PNG, SVG or PDF with just the right data; in a nautical style. And to make things even easier; it the documentation even details how to extract the light characteristics.
Rasterizing
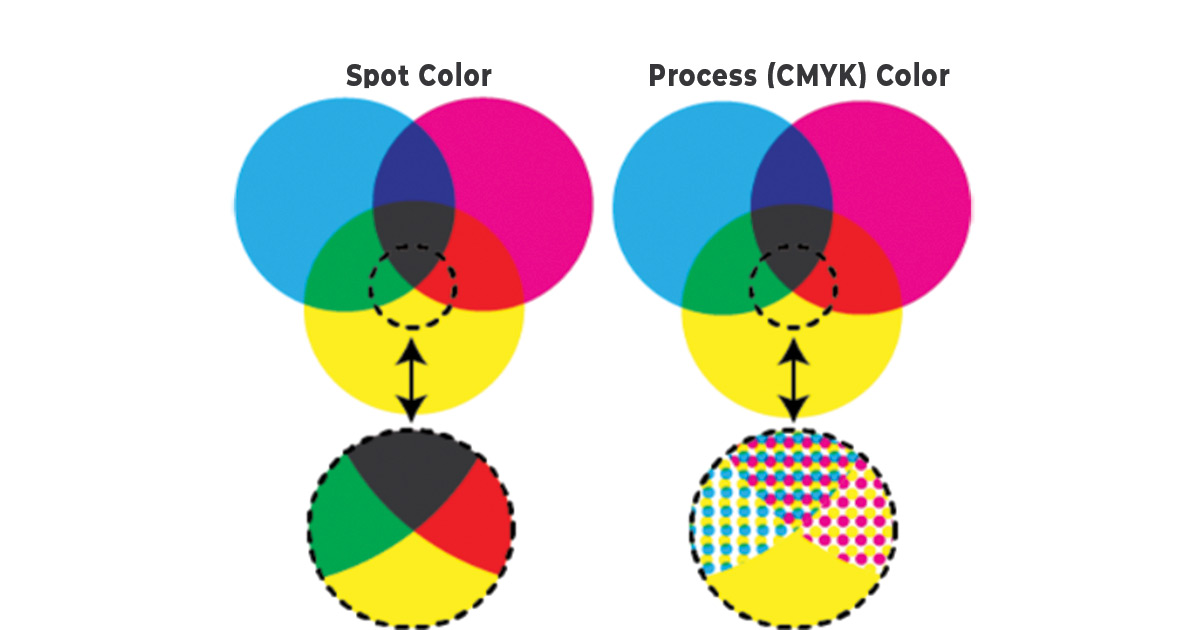
Now naval maps have historically been quite reliant on many layers of spot-colour printing; as opposed to a single CMYK run in which the dots are so small that they optically merge into a single colour. Now this poses a bit of a challenge because that historic spot-colour technique excels at very crisp, think (black) lines and large areas of one colour with abrupt changes possible. And over time - the chart makers have learned how to make really good use of this - improving the way information is presented in tandem with the printing technology.
Spot vs CMYK printing
CMYK however is quite `bad' at crips lines and areas of one subtle shade. This is as it relies on an optical trick of mixing 3 colours (Cyan(C), Magenta(M) and Yellow (Y)) to create the illusion of some other colour, like green, red or brown. With Black (or "Key", the final K of CMYK) thrown in as to get a rich black. And then using some sort of average diffusion (or dithering) to roughly get the right mix.
This works really well for things that have a natural flow and many shades; such as a photograph of a person or nature. But not exactly for the case where you have one area, say, in light blue, thin black line and then a darker blue area. The colours will blend a bit; and the black may smudge because it is touched by dots on either side.
The issue is made worse by the fact that modern CMYK printing is also reliant on a orthogonal raster; on pixels; which are at 90 degrees to each other. Which is fine for horizontal and vertical lines - but makes it hard to do very crips diagonal or curved lines. With still a lot of strategies and research to do better anti-alising and prevent bleeding.
The result of this is that our naval maps are rather ill suited for CMYK rasterisation. This in turns means that we should stay well away from anything that causes our image to stress the printing resolution. And ideally we should be able to second guess the way the vector image is translated into a raster; in particular the black.
As this process was quite new; EasyEDA and JLCPCB where not yet quite sure of their printing capability - but did know that the X/Y rastering would be around 1300 Dots Per inch (or the Square-root(2)x2 for the number of lines per inch at 45 degrees).
Test chart
To test this - a test chart was printed as part of the PCB:
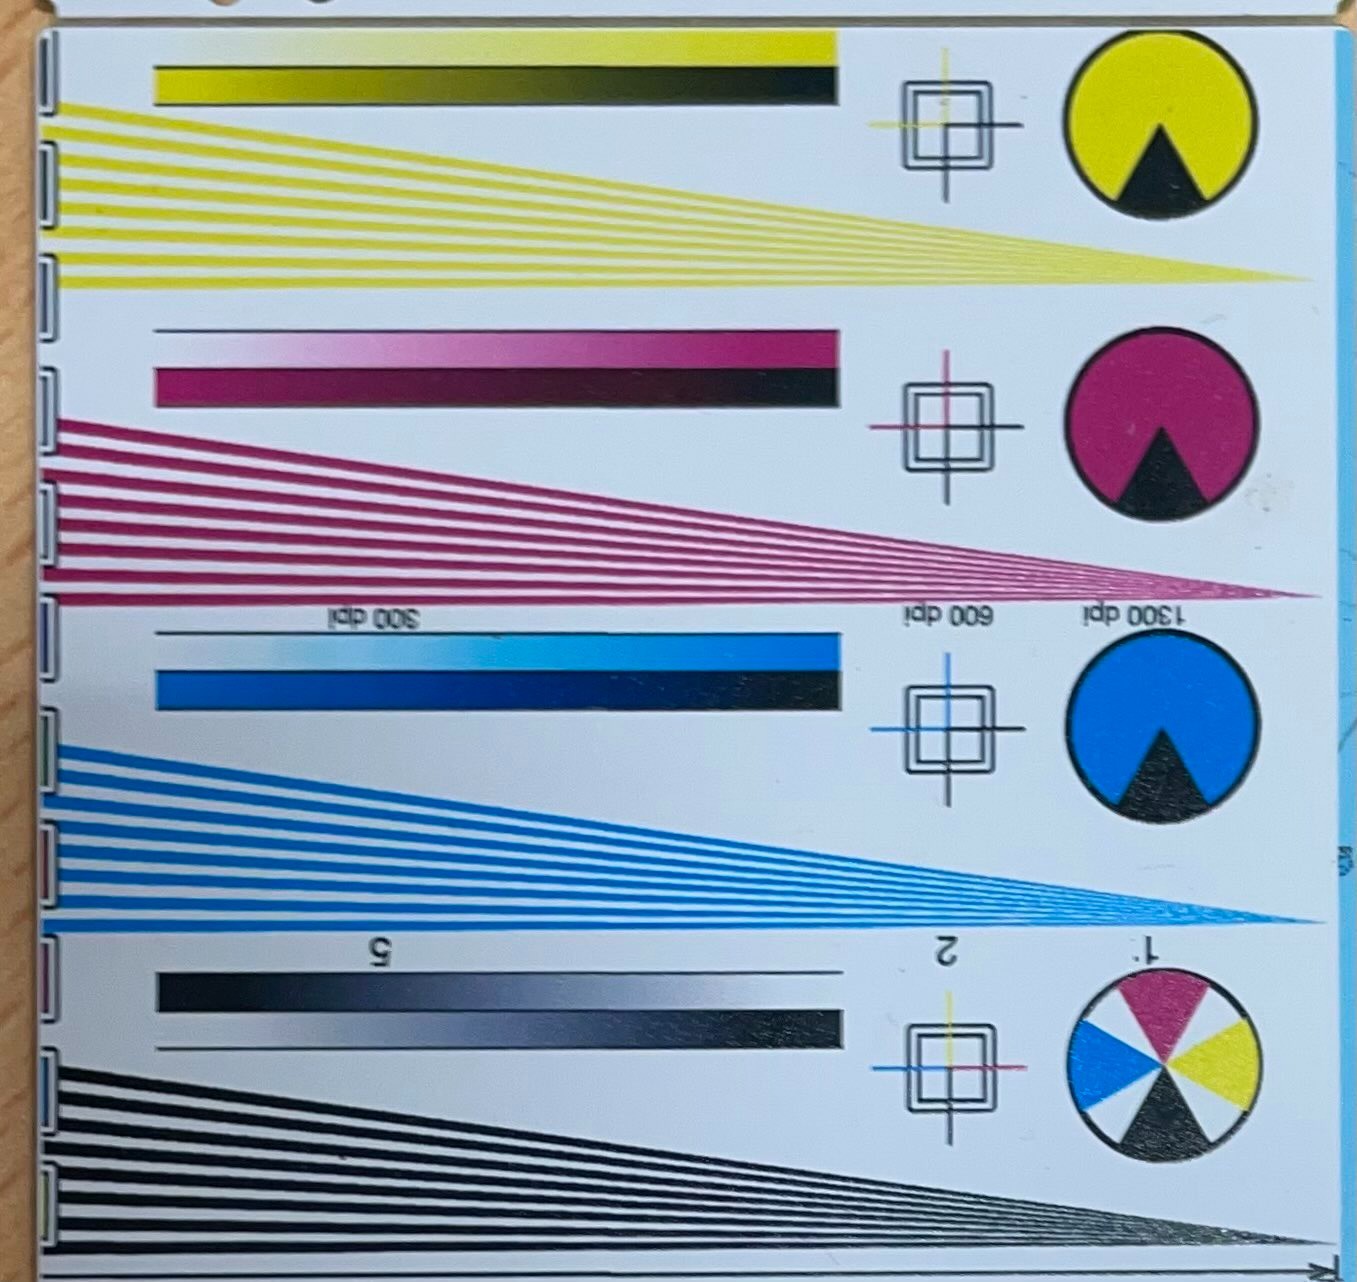
With on the left the original raster (printed twice; at 90 degree angles) and on the right the actual result. There was virtually no difference between the two orientations.
Looking at the details - we first see an almost perfect alignment between the CMYK - with the black somewhat overbearing but not winning/layered on last.
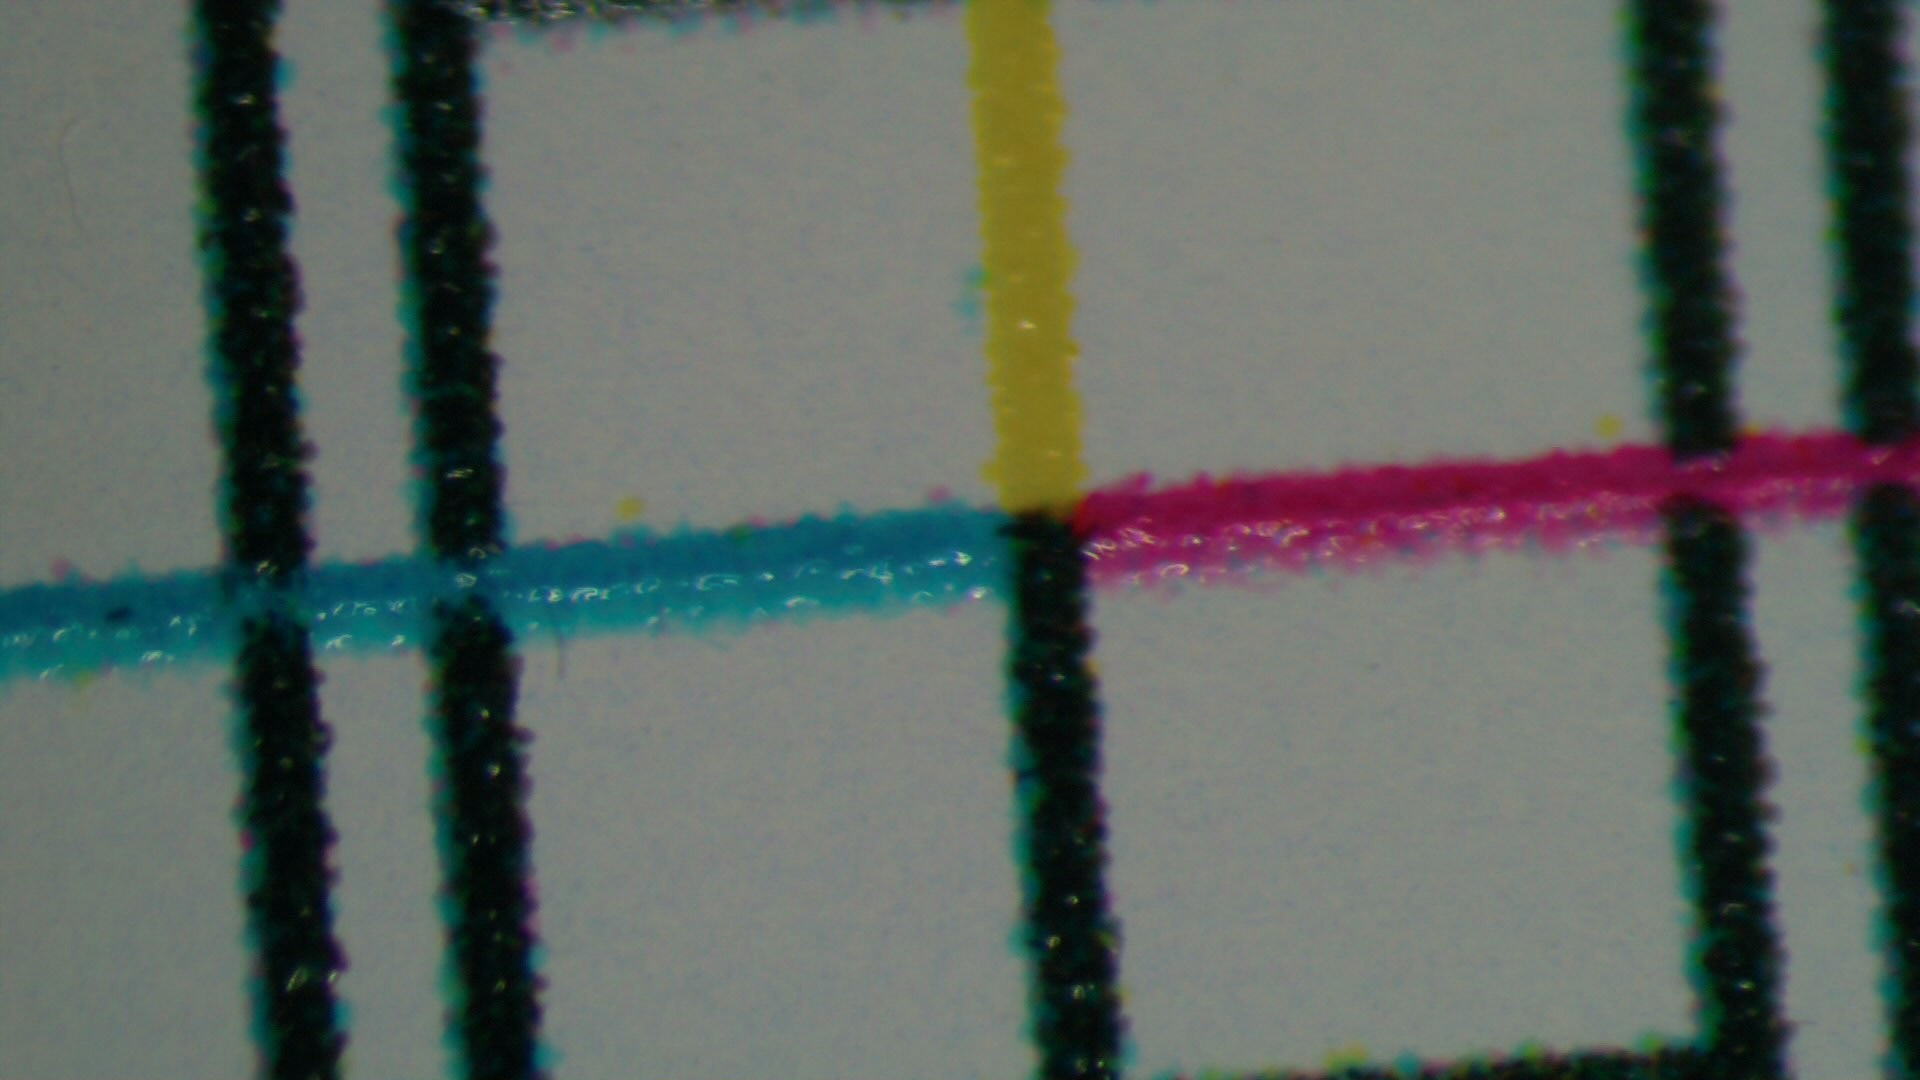
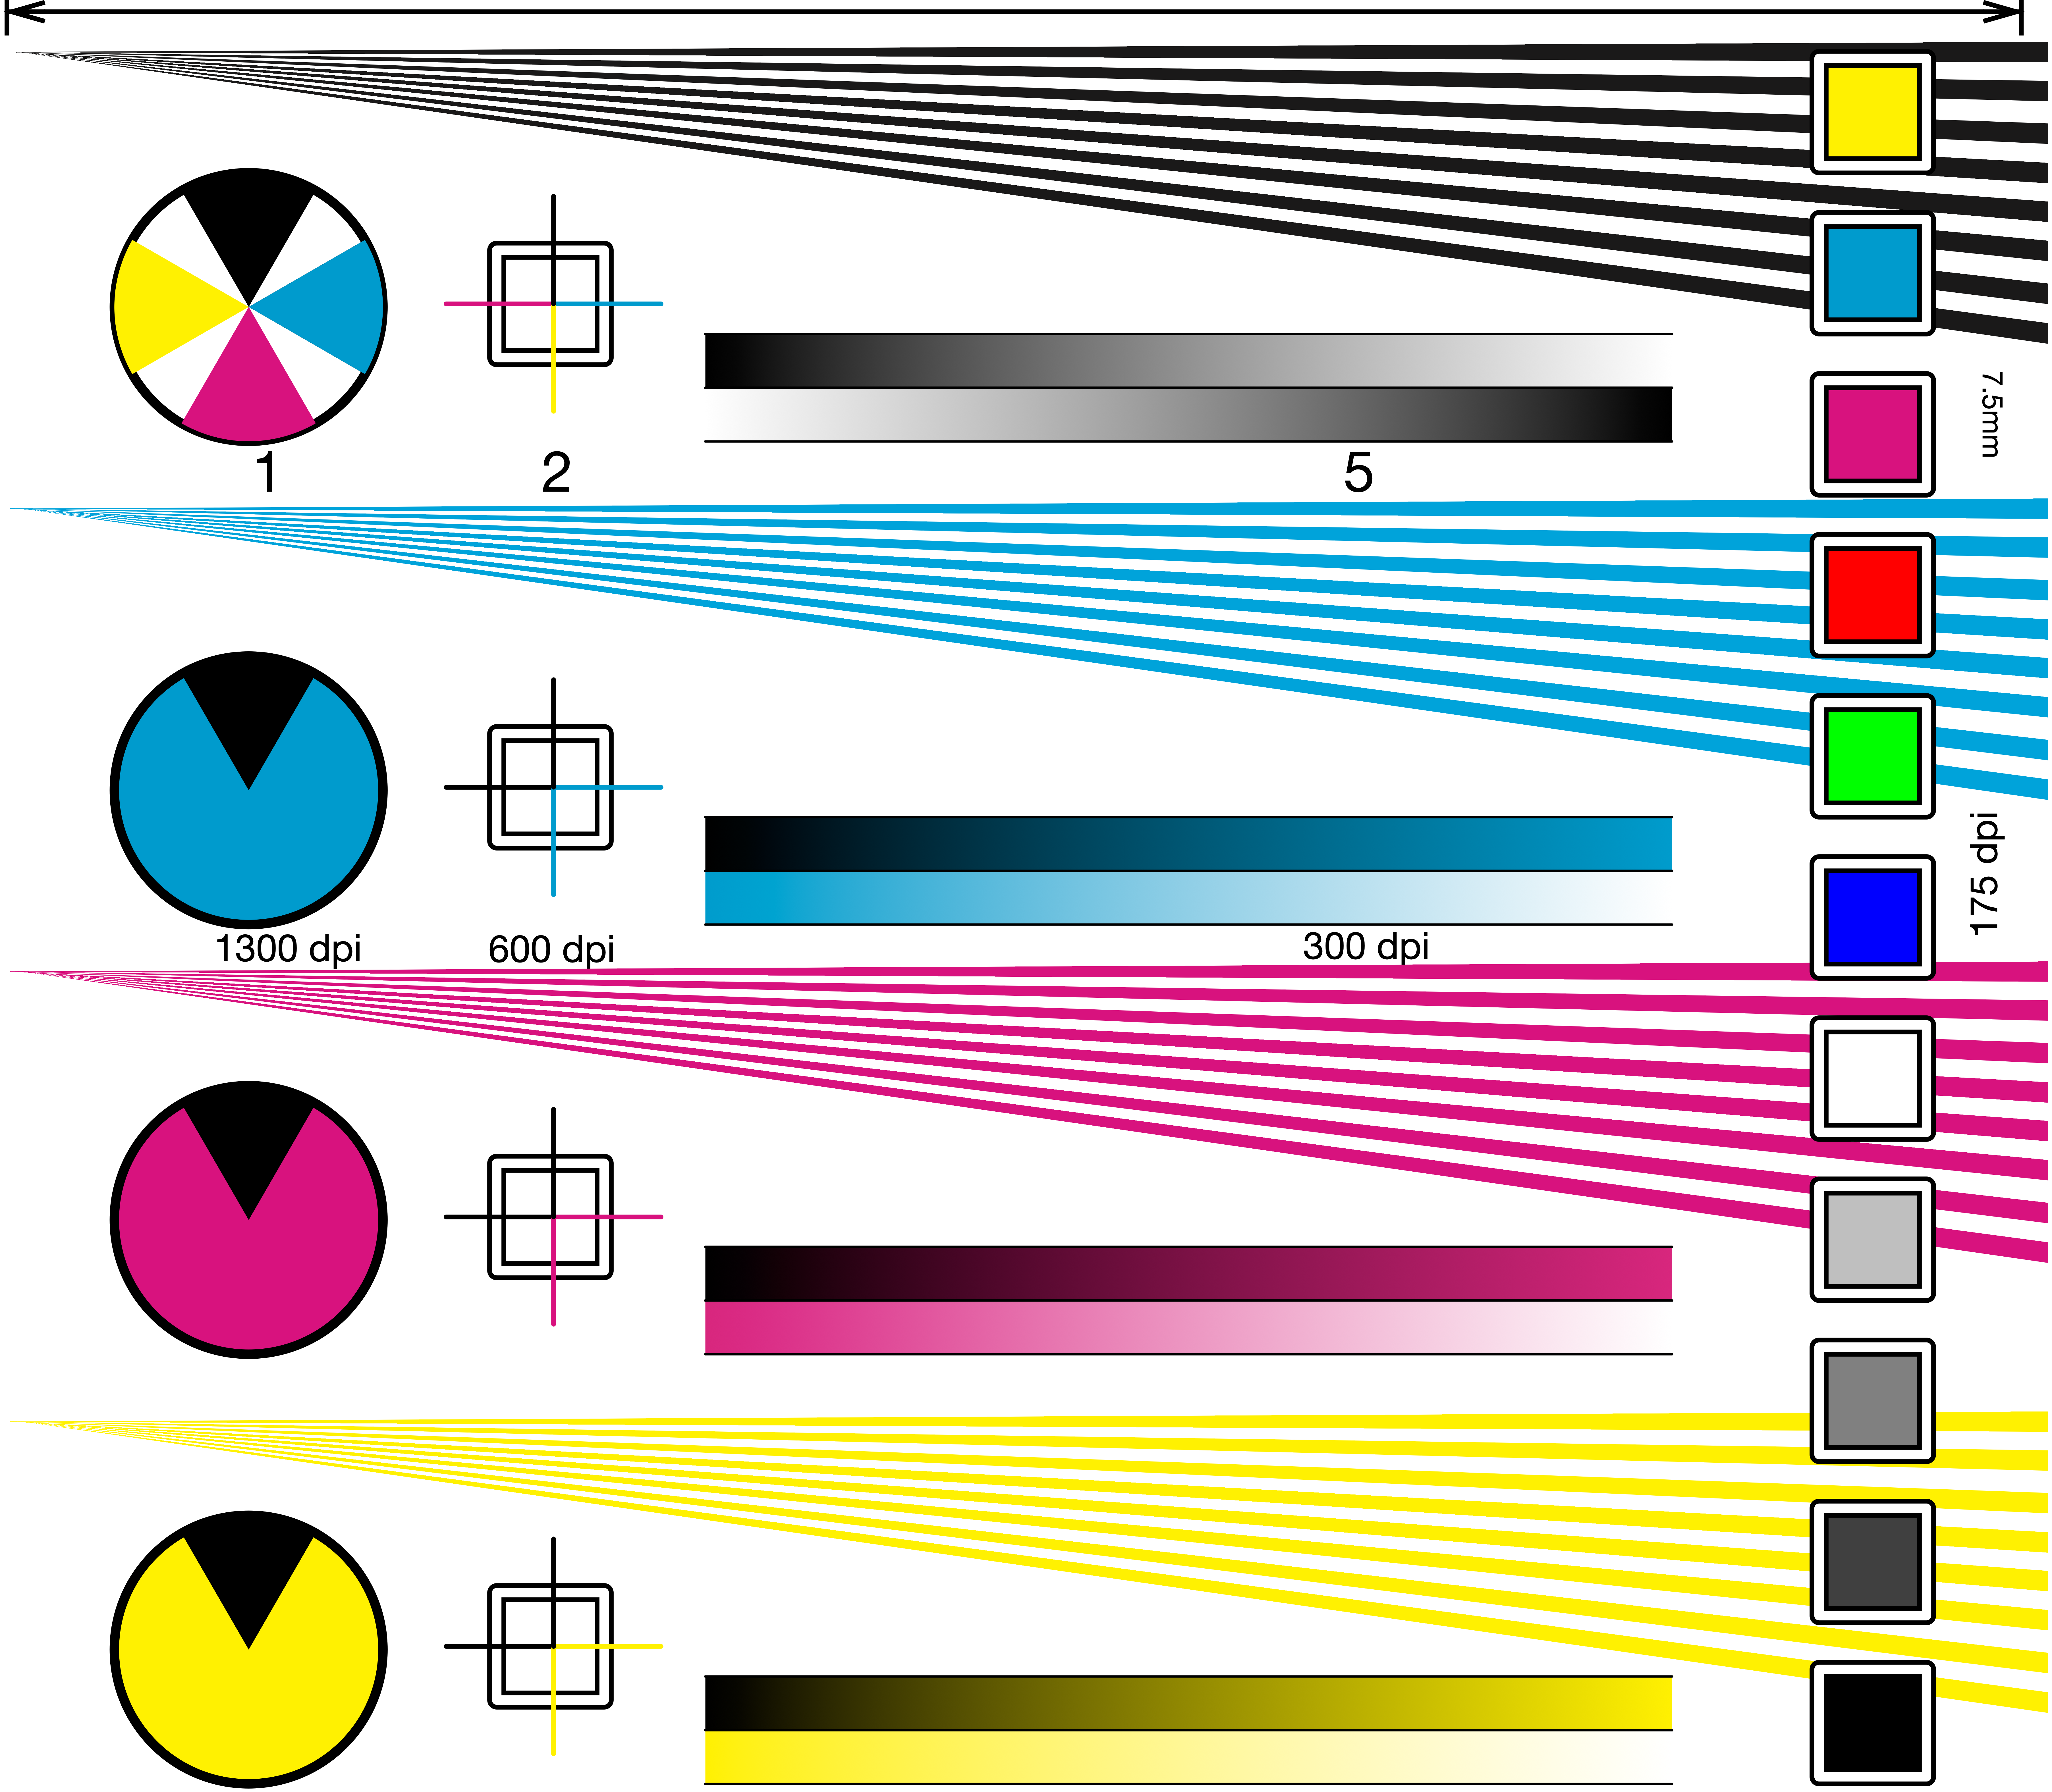
Looking at the lines - we get an idea of the rastering and actual line resolution:

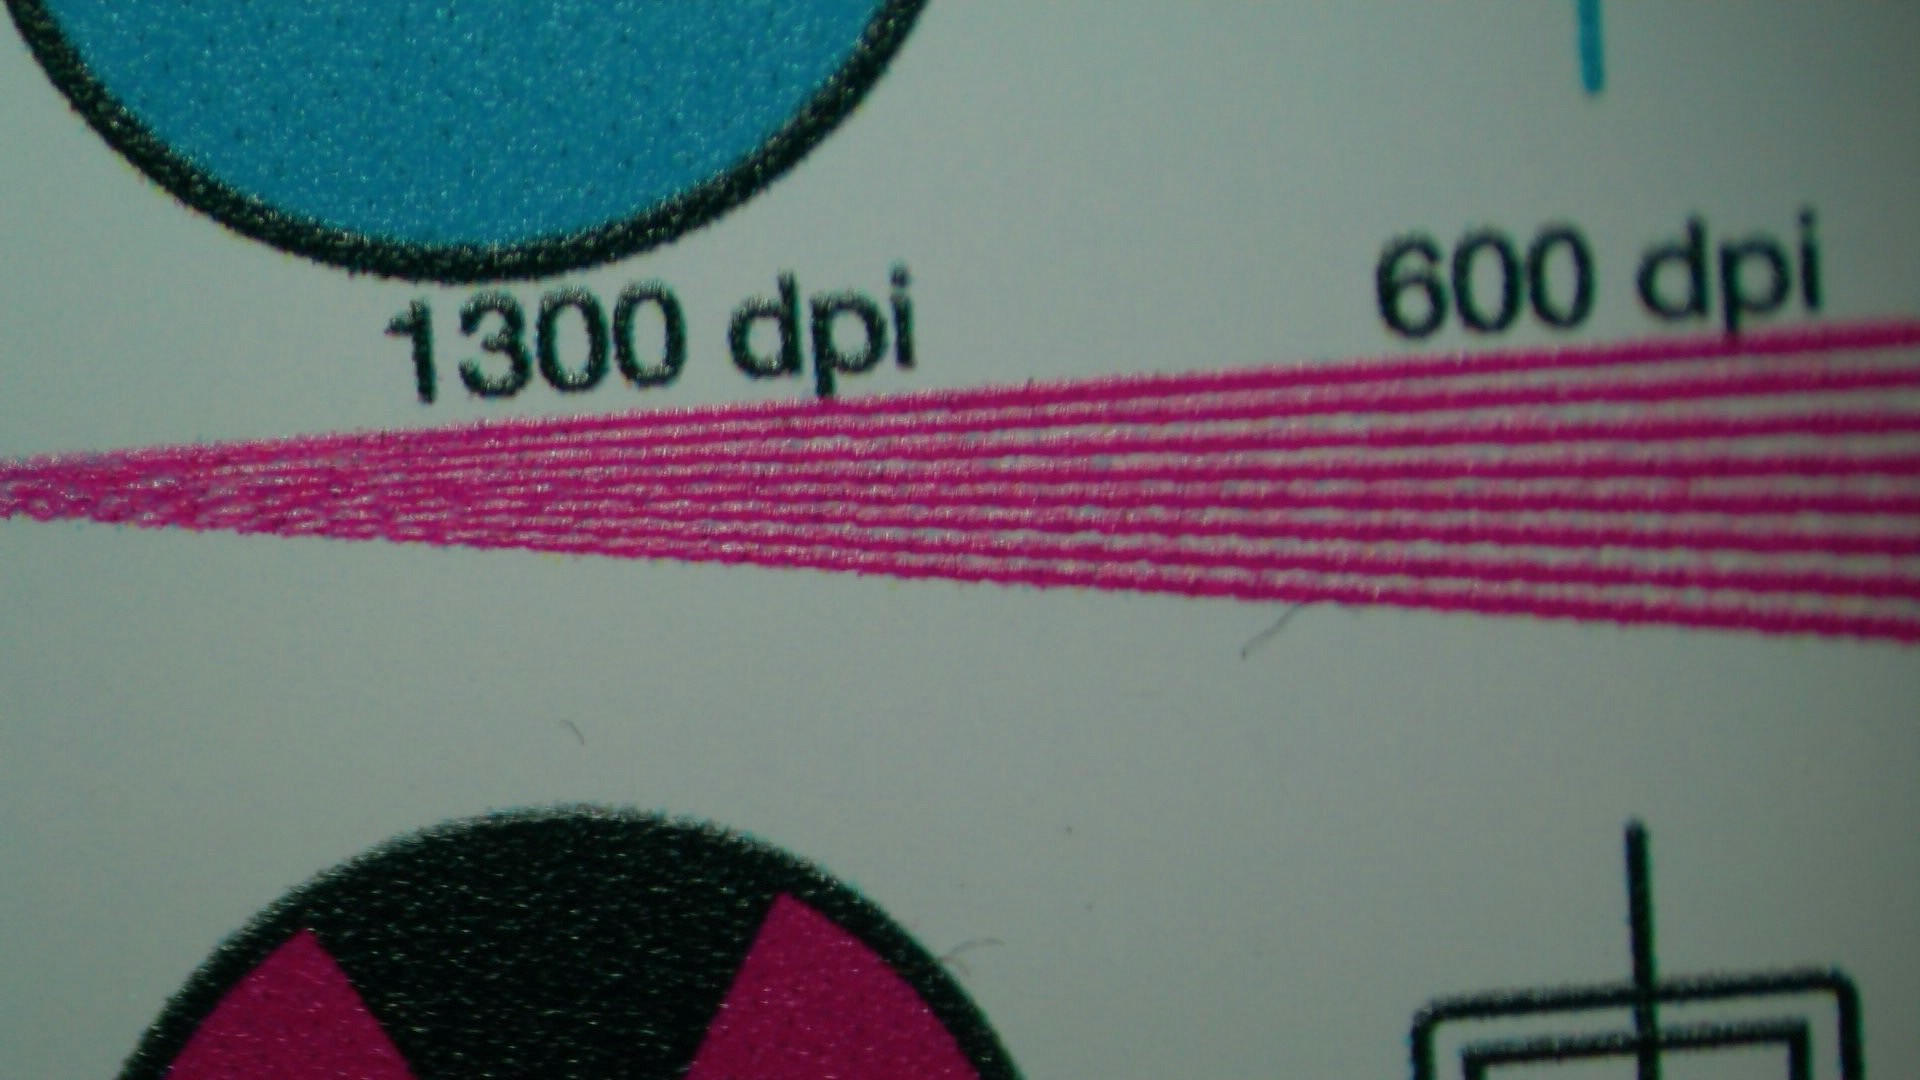

These show good line separation up to about a 1000 DPI if the angles are not overly hard. Enlarging the array around 1300 DPI shows:
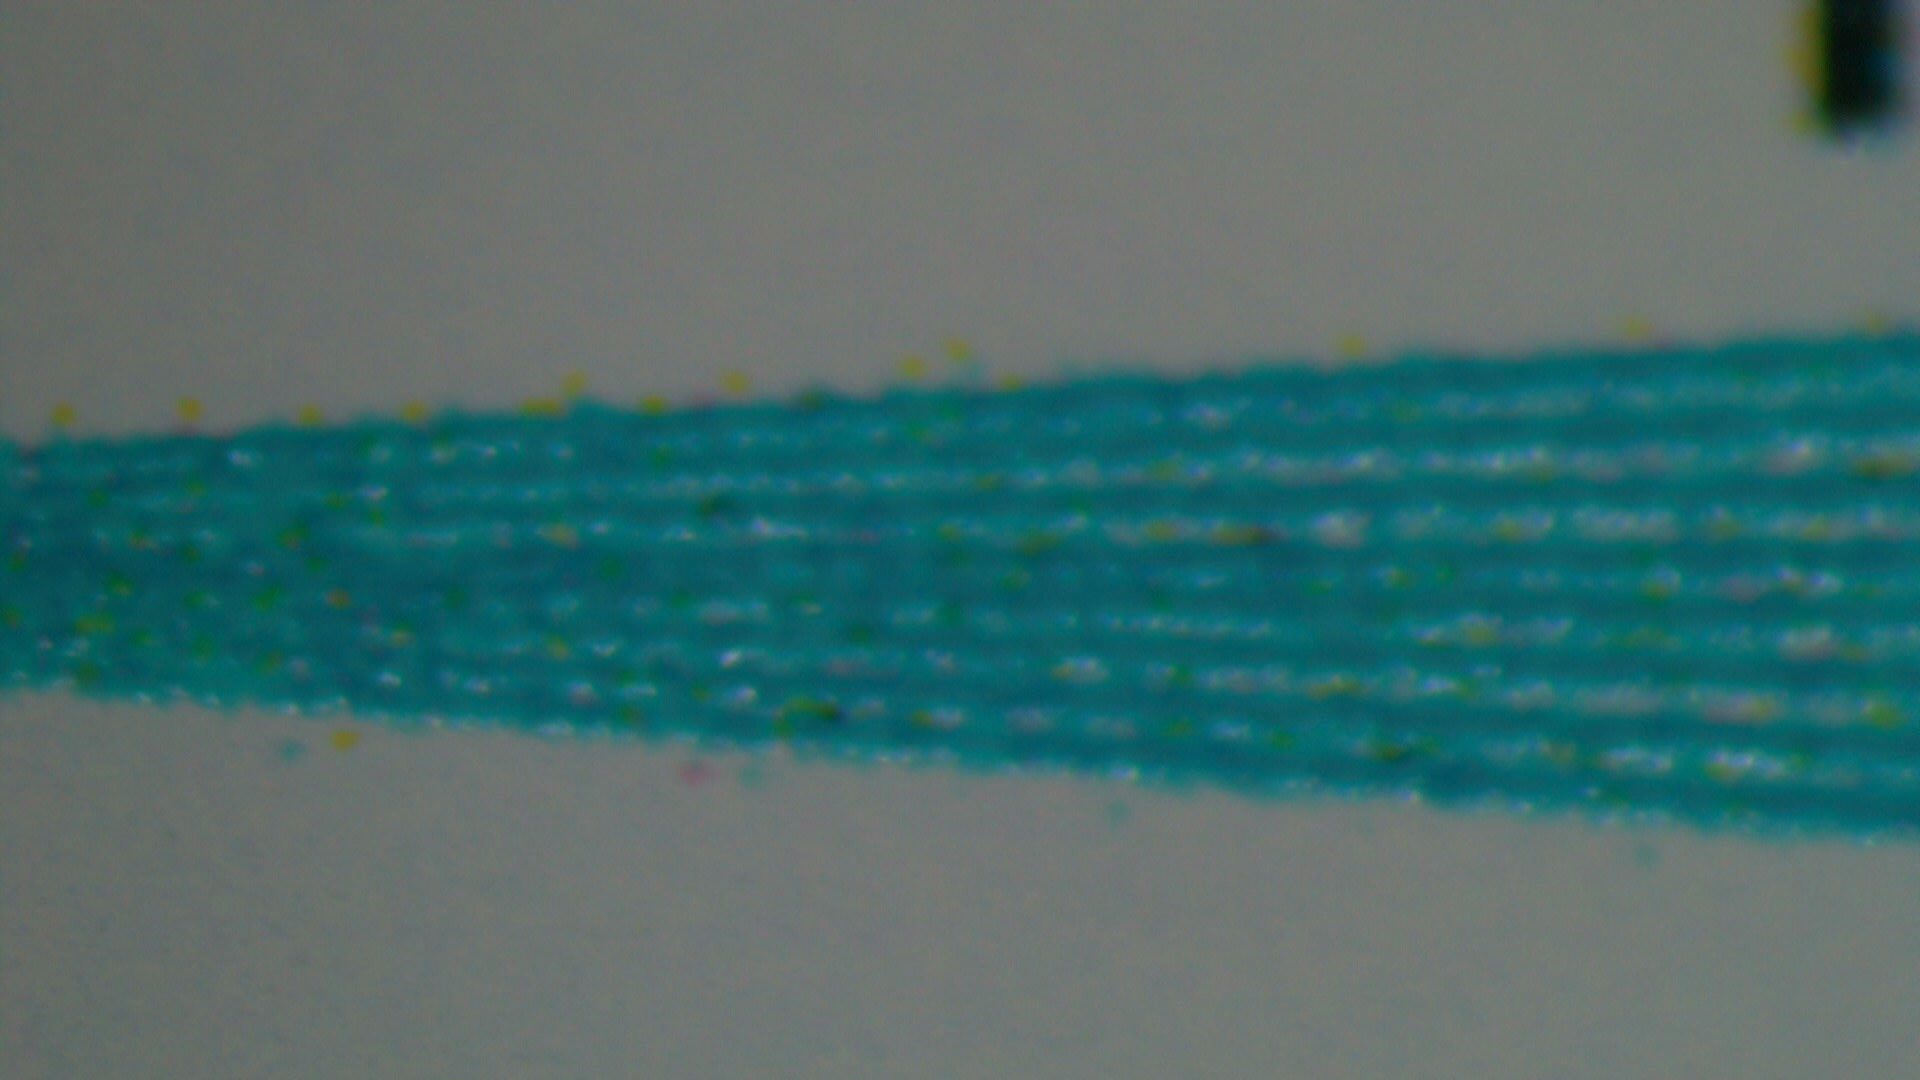
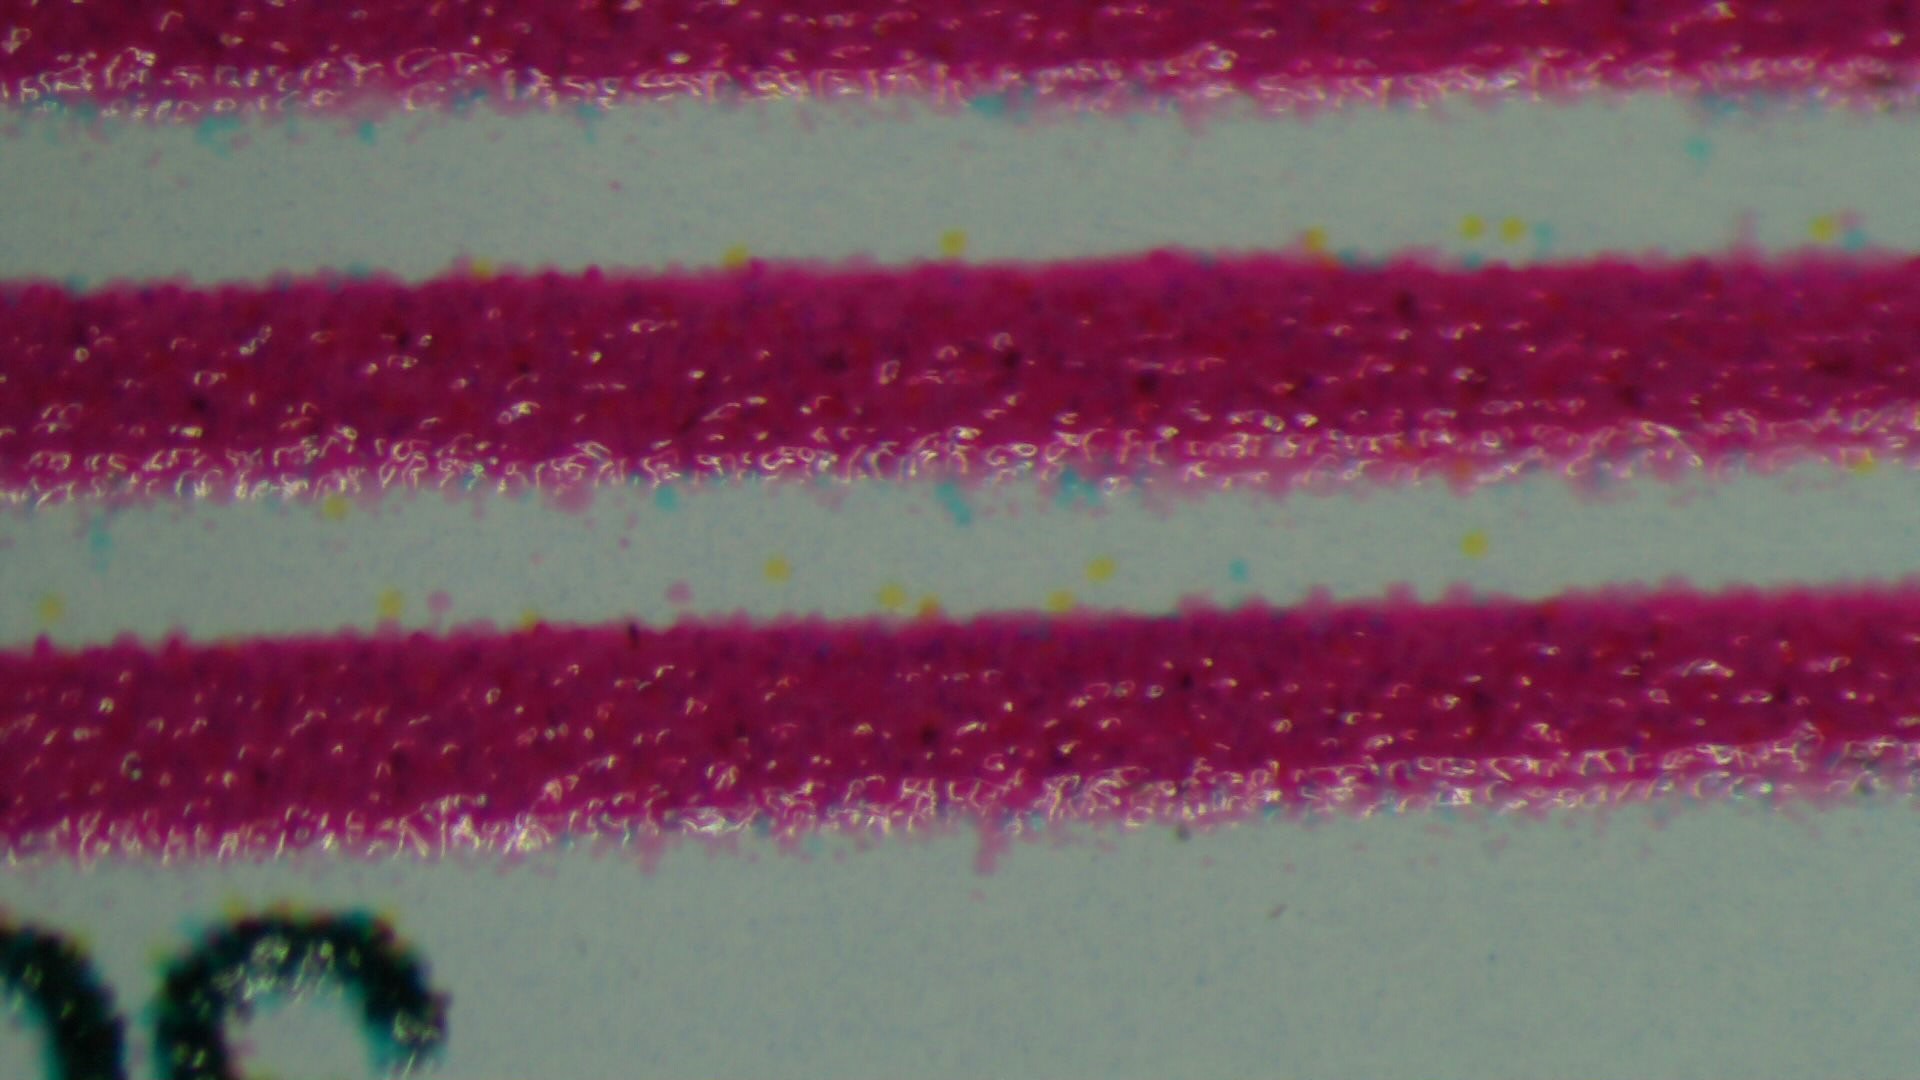
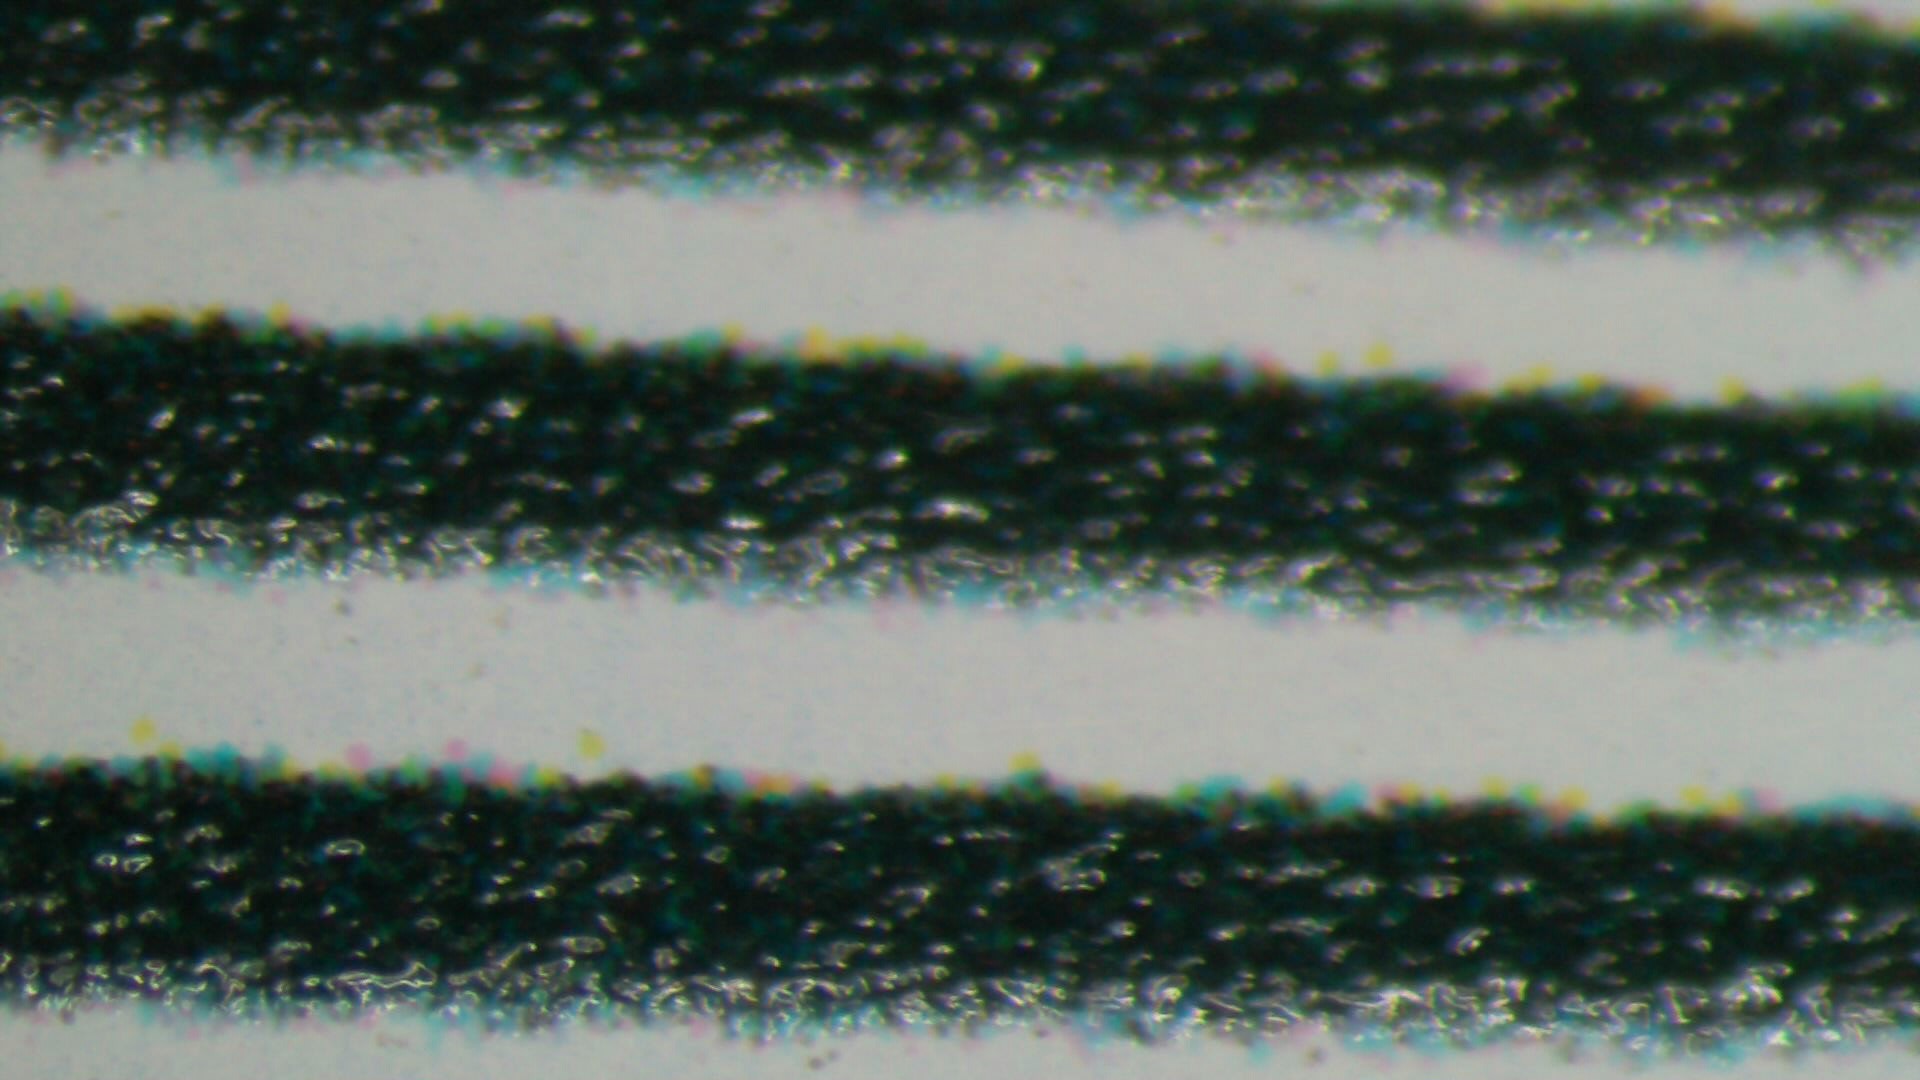
Which shows the the dithering is leaking a bit; and that the pure black is not build with just the key(black); but also gets an under print; and nearby dithering from the other colours.
It is easier to see this in the middle of the black and white grey-scale:
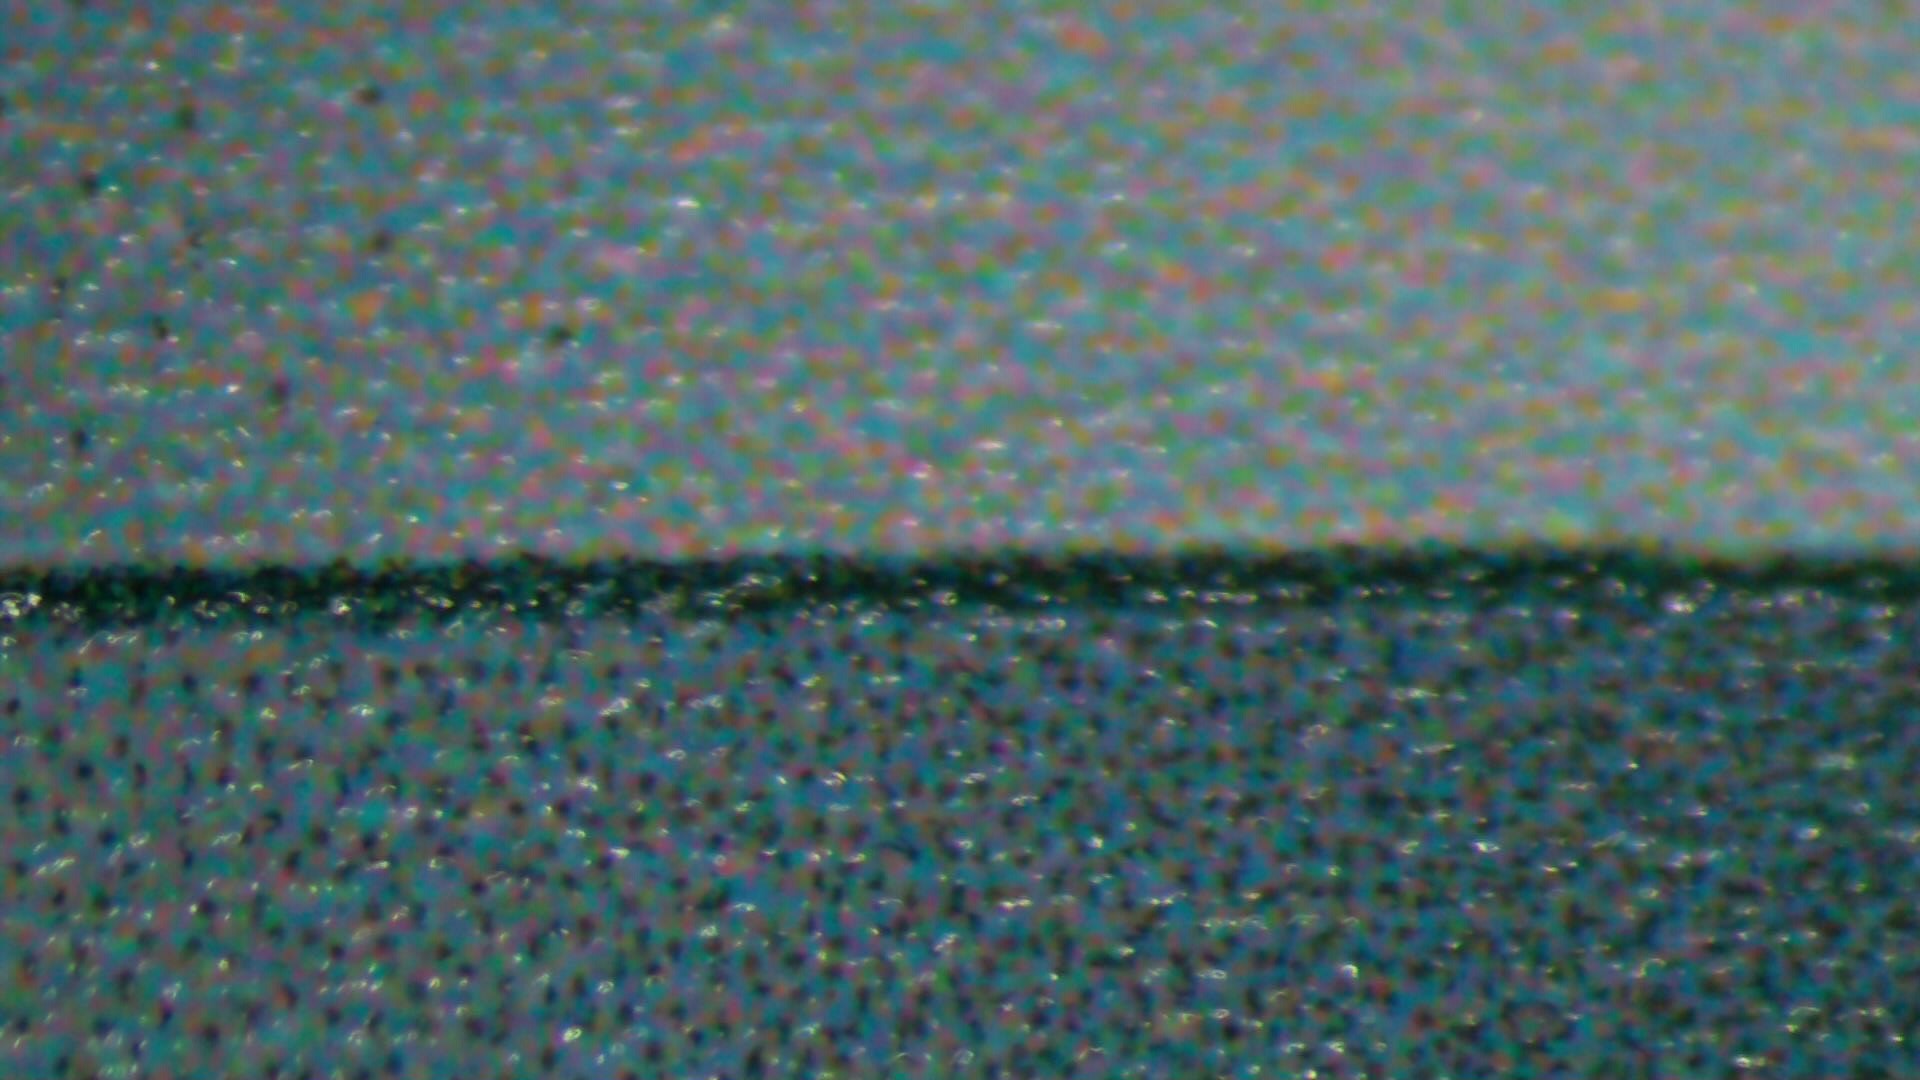
Here the grey is build up using the CMY and K; rather than just with the K. The same is also true for the C, M and Y grayscales:
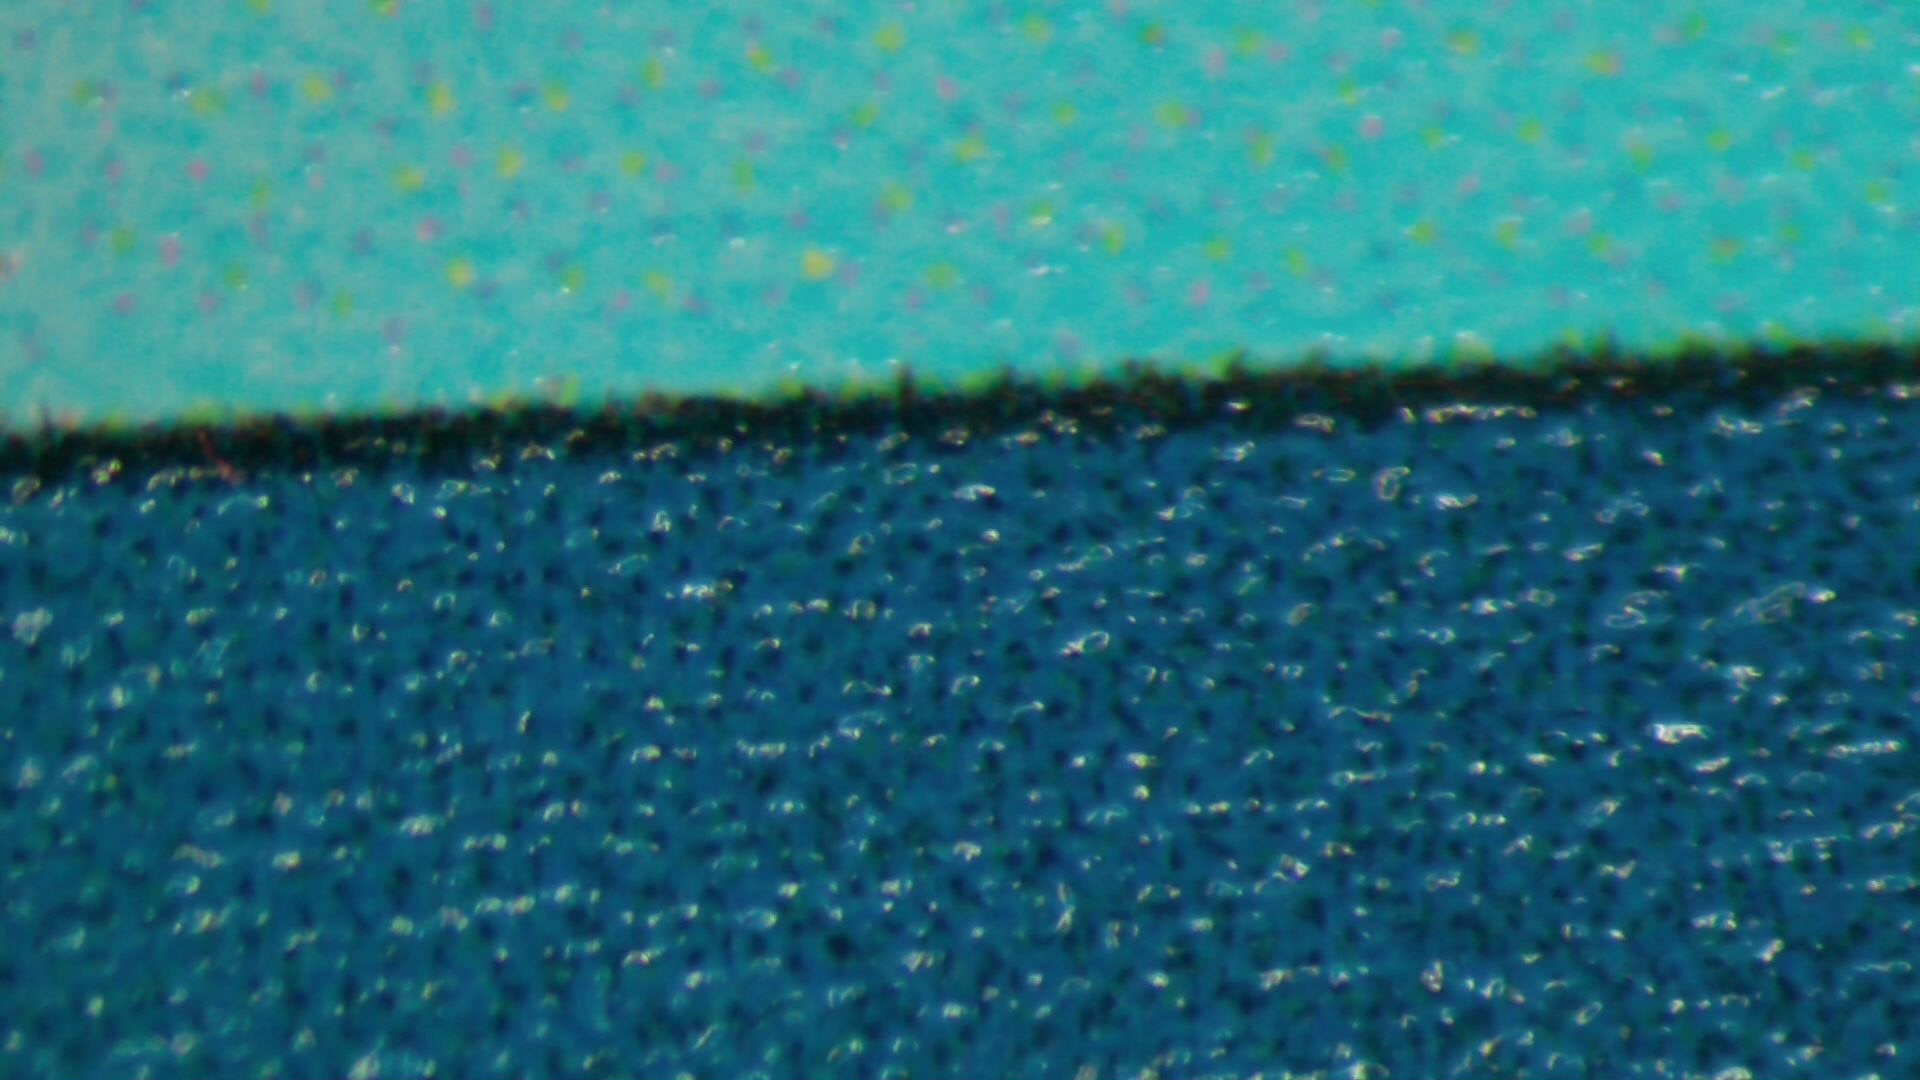
And also visible near any of the 'pure' colours when used at a 100%

This gives us enough information to create maps with the right colours.
Creating a map
Using Openstreetmaps and Open Seas; it is easy to fetch a given area and then use one of the OSM format parsers to extract the lights:
# Fetch base data
curl --silent https://download.geofabrik.de/europe/britain-and-ireland-latest.osm.pbf
# Extract a smaller area around the Isle of Man. Both to feed
# this to SMRender for the raster and to get the lights.
osmium extract -o IoM.osm  --bbox -4.921570712969264,53.99556789239317,-4.1835222603961535,54.41847668753121 britain-and-ireland-latest.osm.pbf
# Extract all the lights
osmium tags-filter -o lights.osm --expressions filter.ex IoM.osm
perl xml2table < lights.xml > lights.csv
Likewise one can use tools such as smrender to create nice looking rasters of a nautical looking maps.
Electronics
Using EasyEDA Pro a simple STM8 is combined with a 8x16 matrix driver.
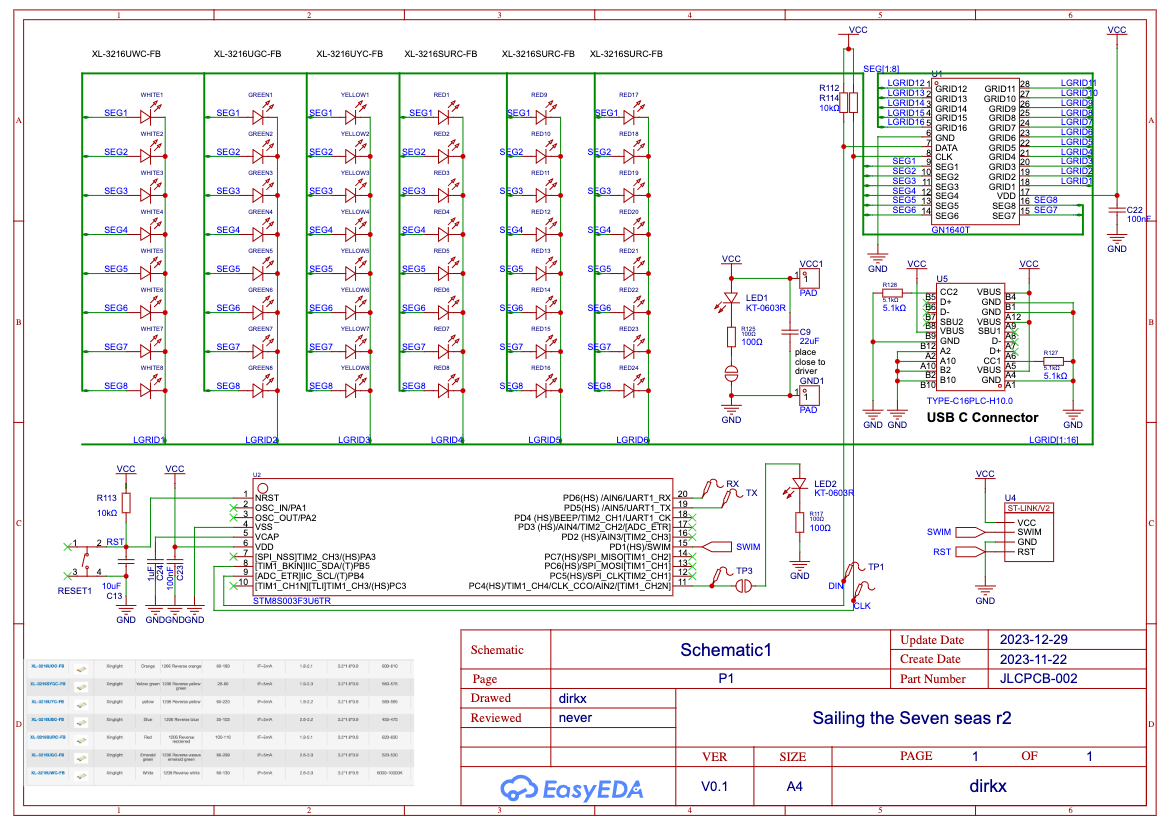
The design follows the datasheets; wit a few simplified selection as to ensure we are only using the cheaper `basic components' of EasyEDA/JLCPCB.
However we did add a resistor to each of the vertical grid lines (R119-R123). This was done in case the brightness of the LEDs would need tweaking to look right. This is also the reason why I grouped the LEDs by colour.
In the end - this was not needed; and I could have simplified things by mixing colours. Likewise a TTL-Serial was added and a reset-button. Neither was actually needed or used.
PCB
The next step is to create the board. This is mostly just using the automation in EasyEDA pro.
Reverse mount LEDs
Initially the idea was to use the existing footprints and reverse mount LEDs. And then make use of SMD Assembly service -- as all the components would be on the back of the map. This turned out to not yet be supported.
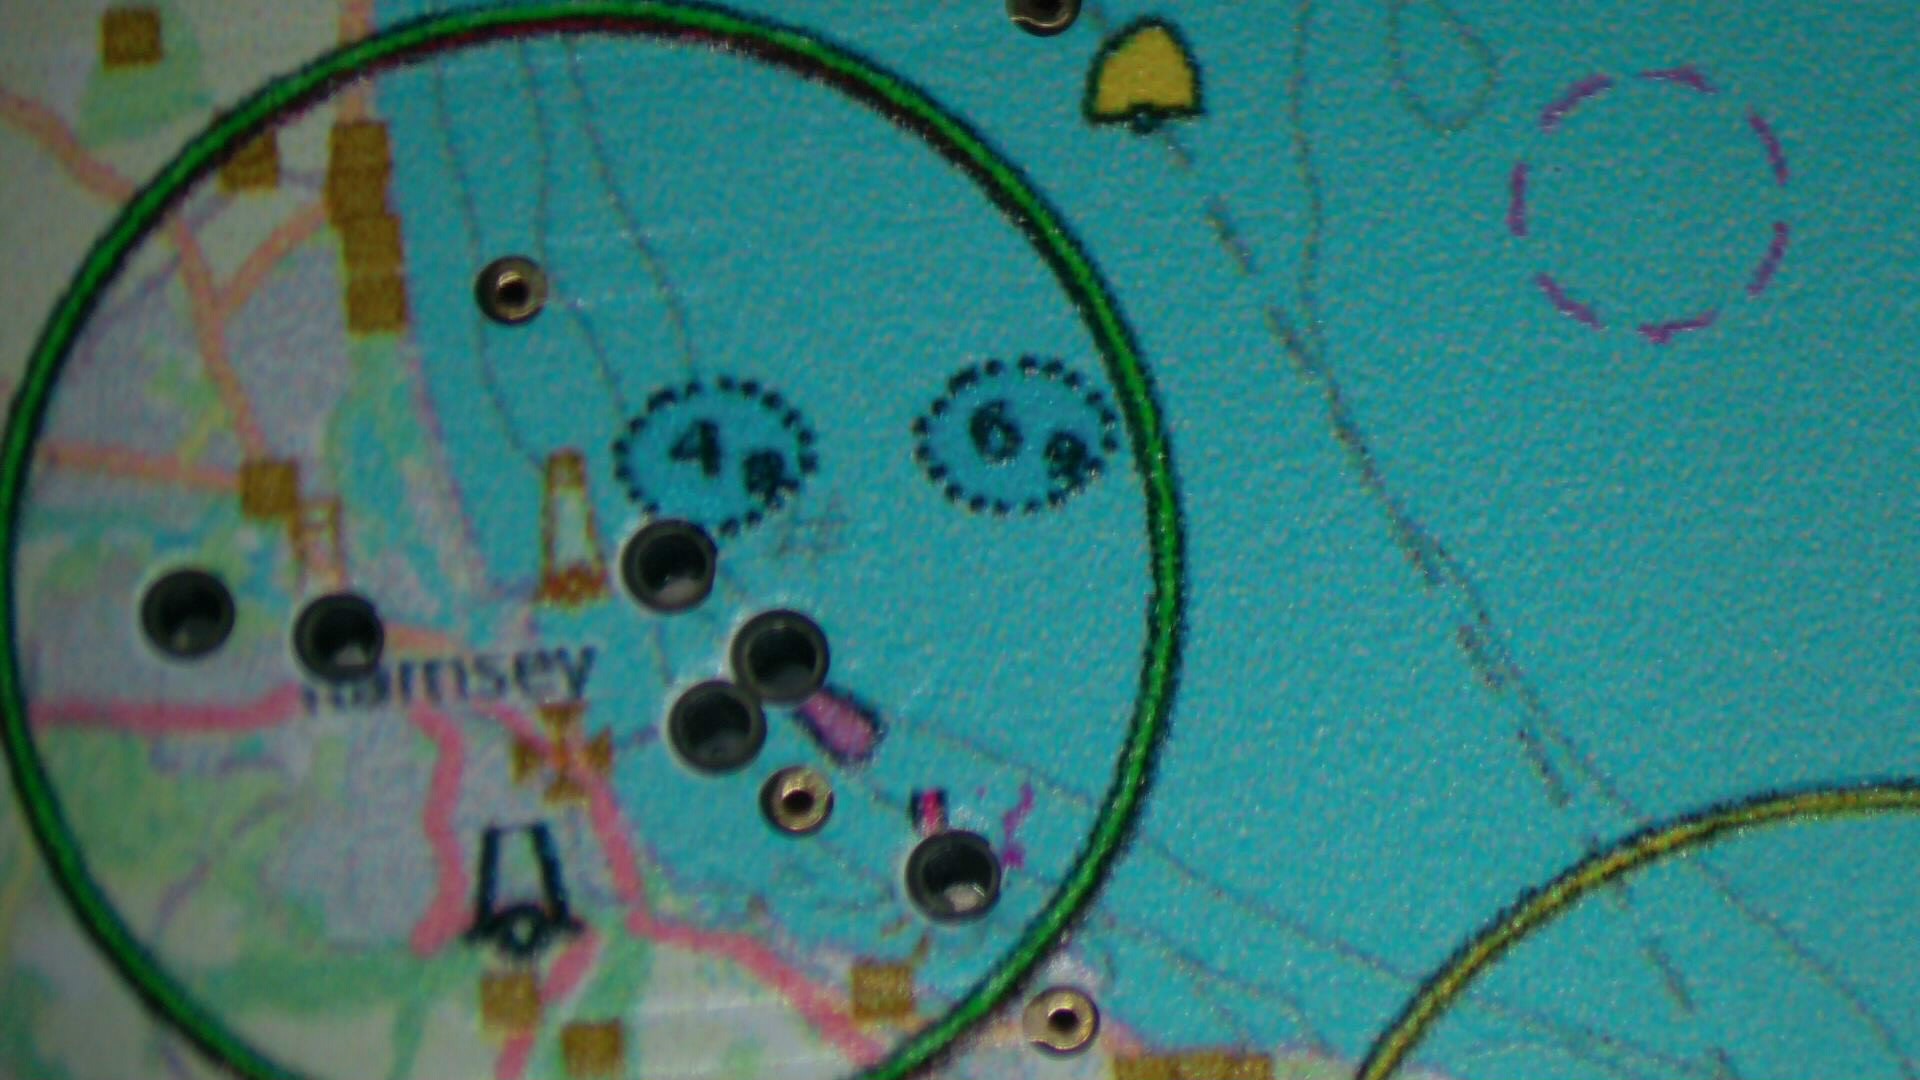
This mean that we would have to solder the LEDs manually. The upshot of this was that we were no longer limited to the relatively large square holes of the LEDs; but could use round holes; and even vary those in side.
E.g. use very small holes (or even two to an LED) for leading lights or a light on a hill. And much larger ones for the main lighthouses.