 Vedran
After establishing a connection, I could poke further at the GDB console. Using a simple blinky project for test
#include <Arduino.h>

// Set LED_BUILTIN if it is not defined by Arduino framework
#ifndef LED_BUILTIN
    #define LED_BUILTIN 2
#endif

void setup()
{
  // initialize LED digital pin as an output.
  pinMode(LED_BUILTIN, OUTPUT);
}

void loop()
{
  // turn the LED on (HIGH is the voltage level)
  digitalWrite(LED_BUILTIN, HIGH);
  // wait for a second
  delay(1000);
  // turn the LED off by making the voltage LOW
  digitalWrite(LED_BUILTIN, LOW);
   // wait for a second
  delay(1000);
}
I got used to platformIO in VS code, so the example is made through Arduino framework. Before jumping into the platformIO's debugging integration, I thought to give it a test in CLI. Seems like there's no problems with loading the code...

..setting a break point, then running to it...
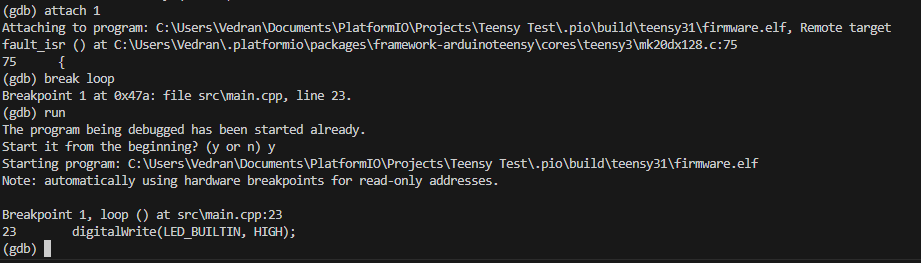
However, continuing after a first breakpoint seems to fail. Before the failure, windows gives an audible sound that a USB device (Teensy, I assume) has been disconnected.
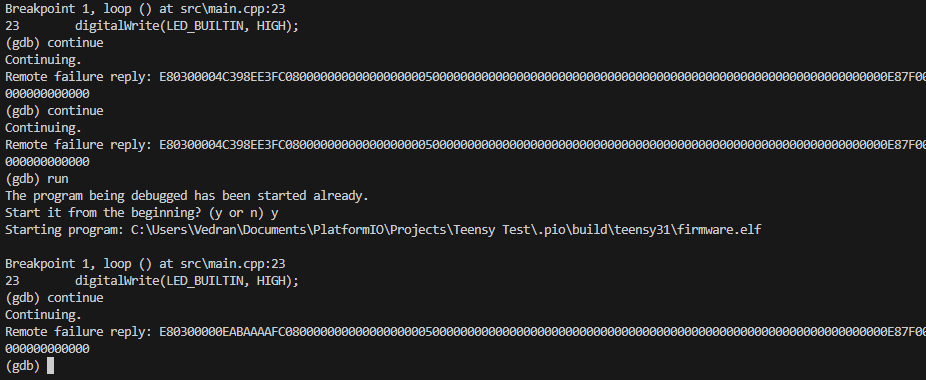
Any attempts to resume the program, short of full restart ('run' command) fail.
Attempt 2
When pausing the program via ctrl-c during a run, and not using any breakpoints, sessions seems to work fine and there's no errors or device disconnects

Few more tests isolated the error to the use of breakpoints, with the following observations:
- Setting a breakpoint that will never be hit (e.g. in a setup() function after it has already run) will not produce an error. Unsetting that same breakpoint will
- Setting a breakpoint in a place where it can be hit will cause an error seemingly before GDB reports that a breakpoint has occurred
Discussions
Become a Hackaday.io Member
Create an account to leave a comment. Already have an account? Log In.