 Michael Doody
The seismic noise device placed in the Madison Valley East-Northeast from the Yellowstone caldera has been turning out reams of data. The amount of seismic noise in this area is astounding. It is 4 or 5 times as intense as the noise recorded by the same machine in East Tennessee. Much of the noise seems to be coming from the West, interestingly. The stronger noise is originating closer to the horizon and the less intense noise is deeper. Several strong local events have been recorded. The device is indoors in a climate controlled environment and it is possible that there may be data artefacts from the vibrations from the heating system. A future visit to Montana will be needed to eliminate this issue. Another source of noise may be the Madison river itself - it is about 200 yards to the East of the current location of the device.
Here is a representative 24 hour plot of the vector magnitude data showing a local event. Full scale for vector magnitude would be about 650.

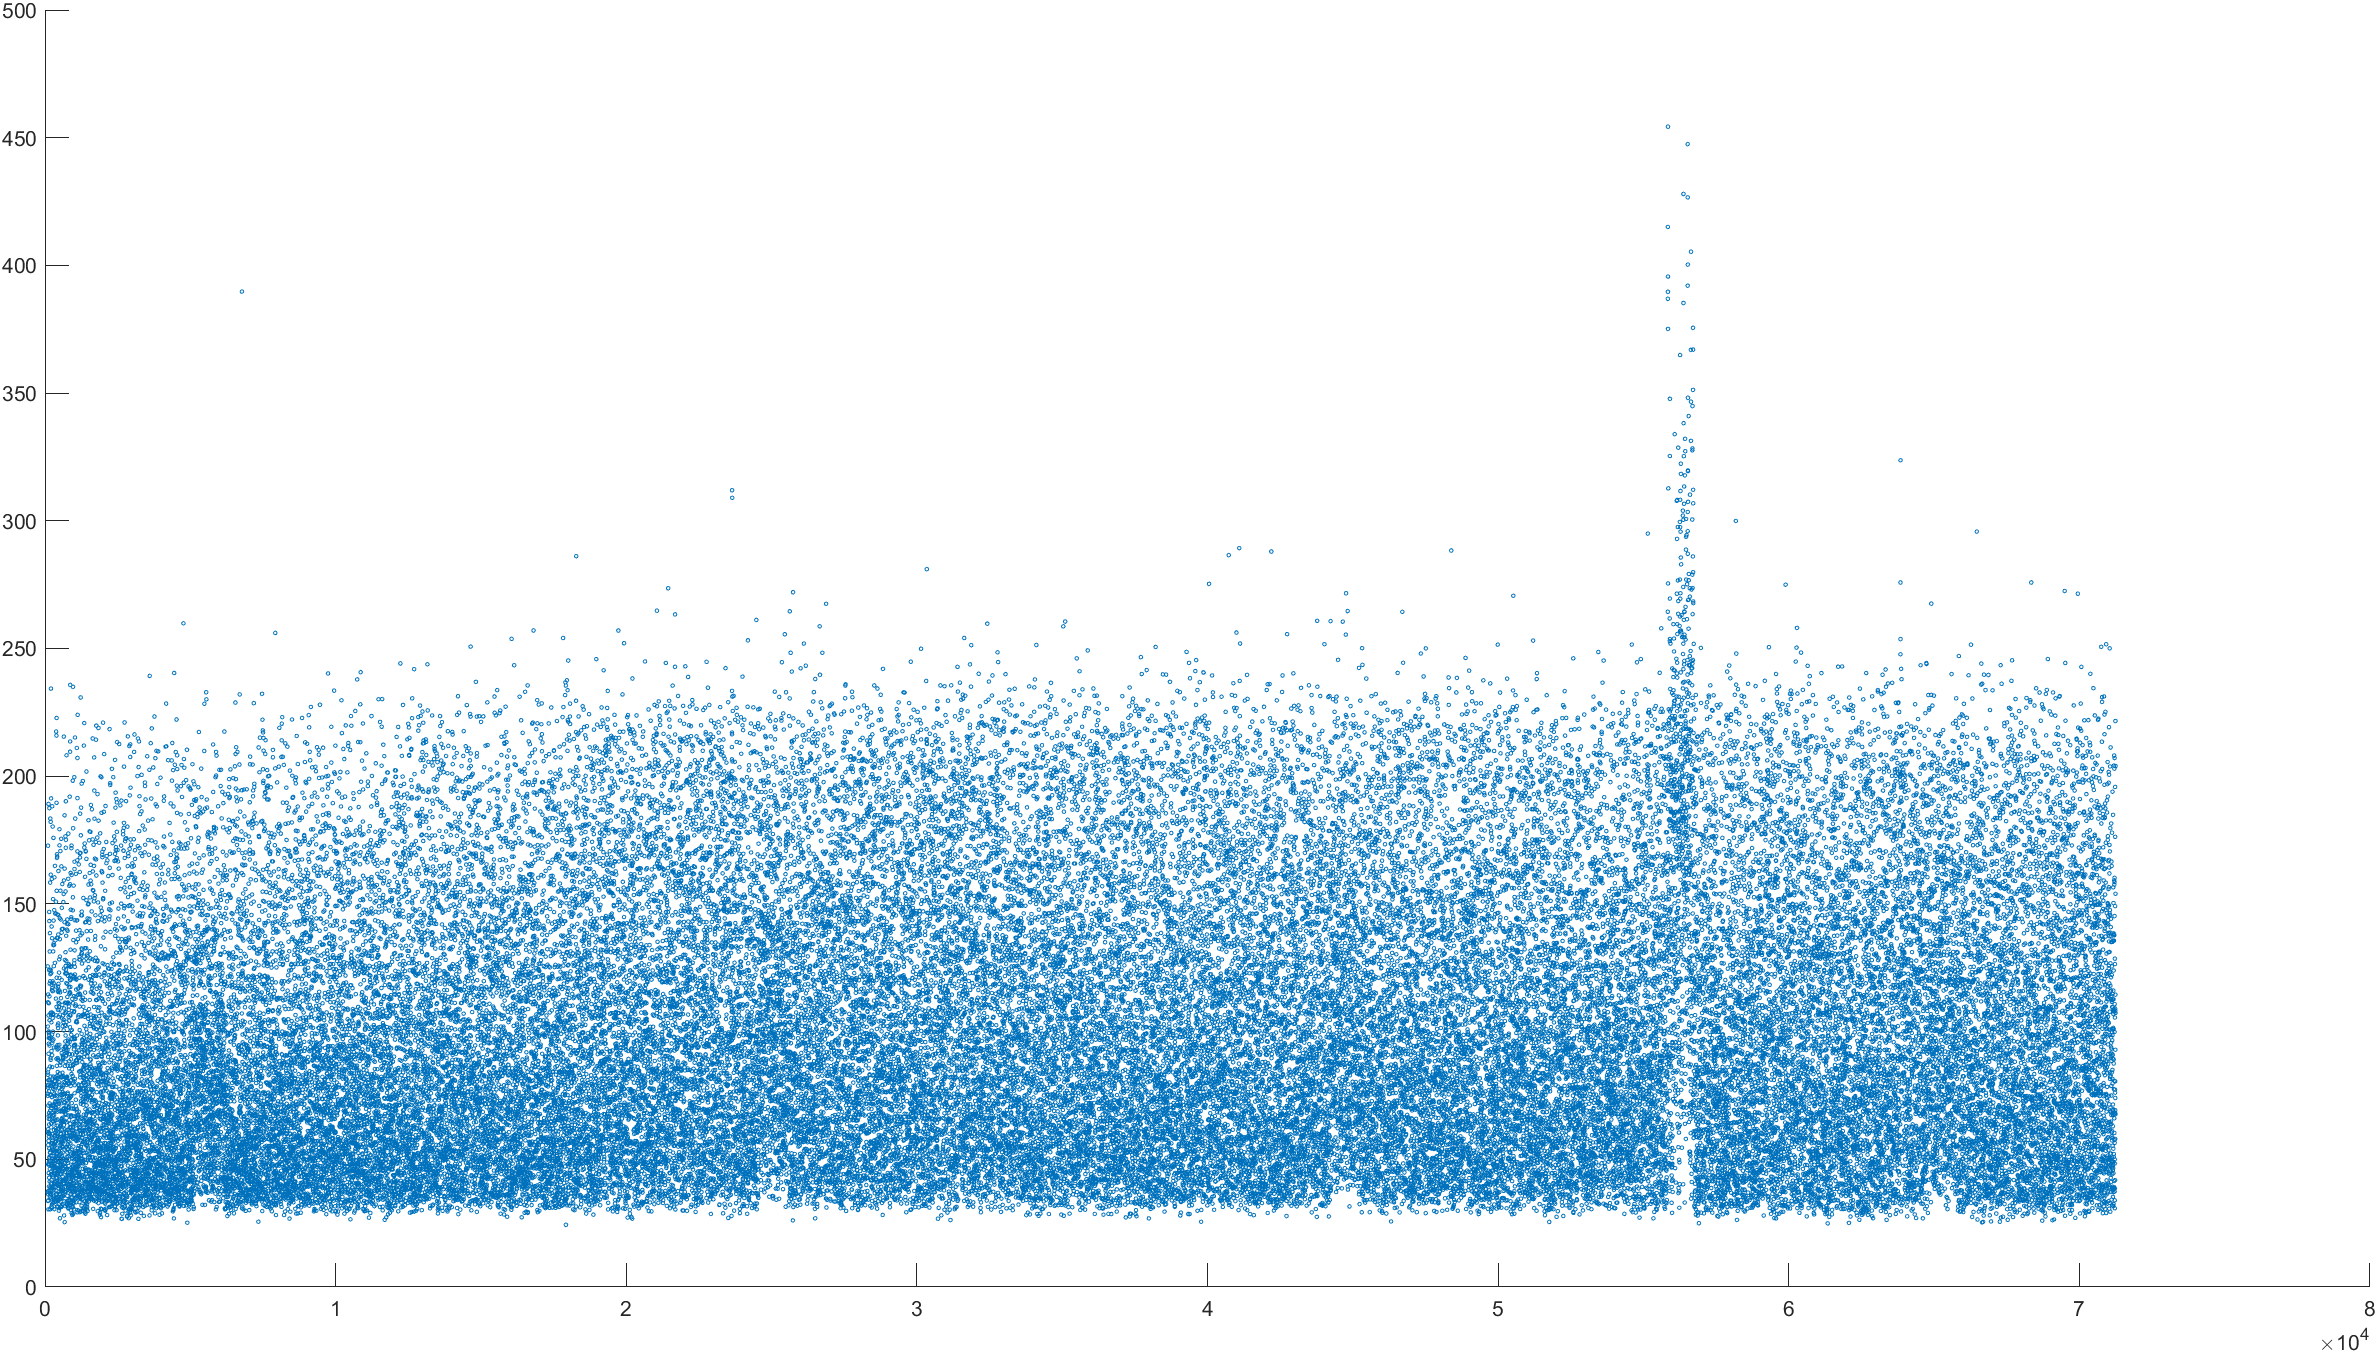
This is the same data, expressed as a scatter plot. I believe that he small blips along the bottom of the plot may be related to the indoor heater coming on and off.
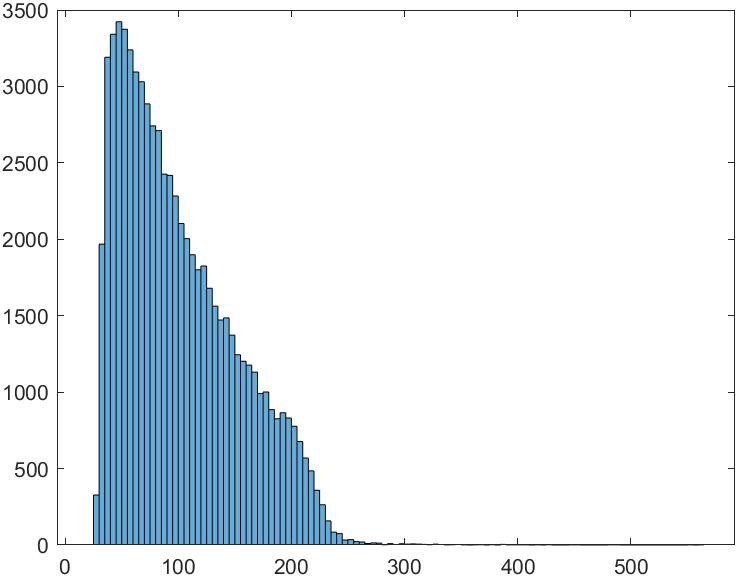
Next is the 3D vector magnitude data expressed as a histogram. The nice Gaussian-like distribution seen in Tennessee is not seen! This data seems to reflect at least 2 independent sources of the noise.
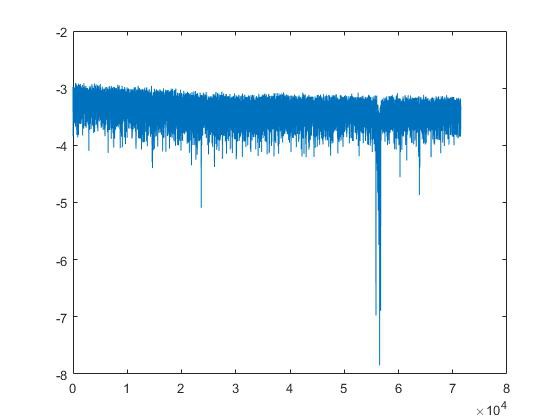
Here is a plot of the combined (multiplied) vector magnitude probability and 3D location probability (Y axis) of each time point during the same time interval. 10^-8 is one in 100 million.
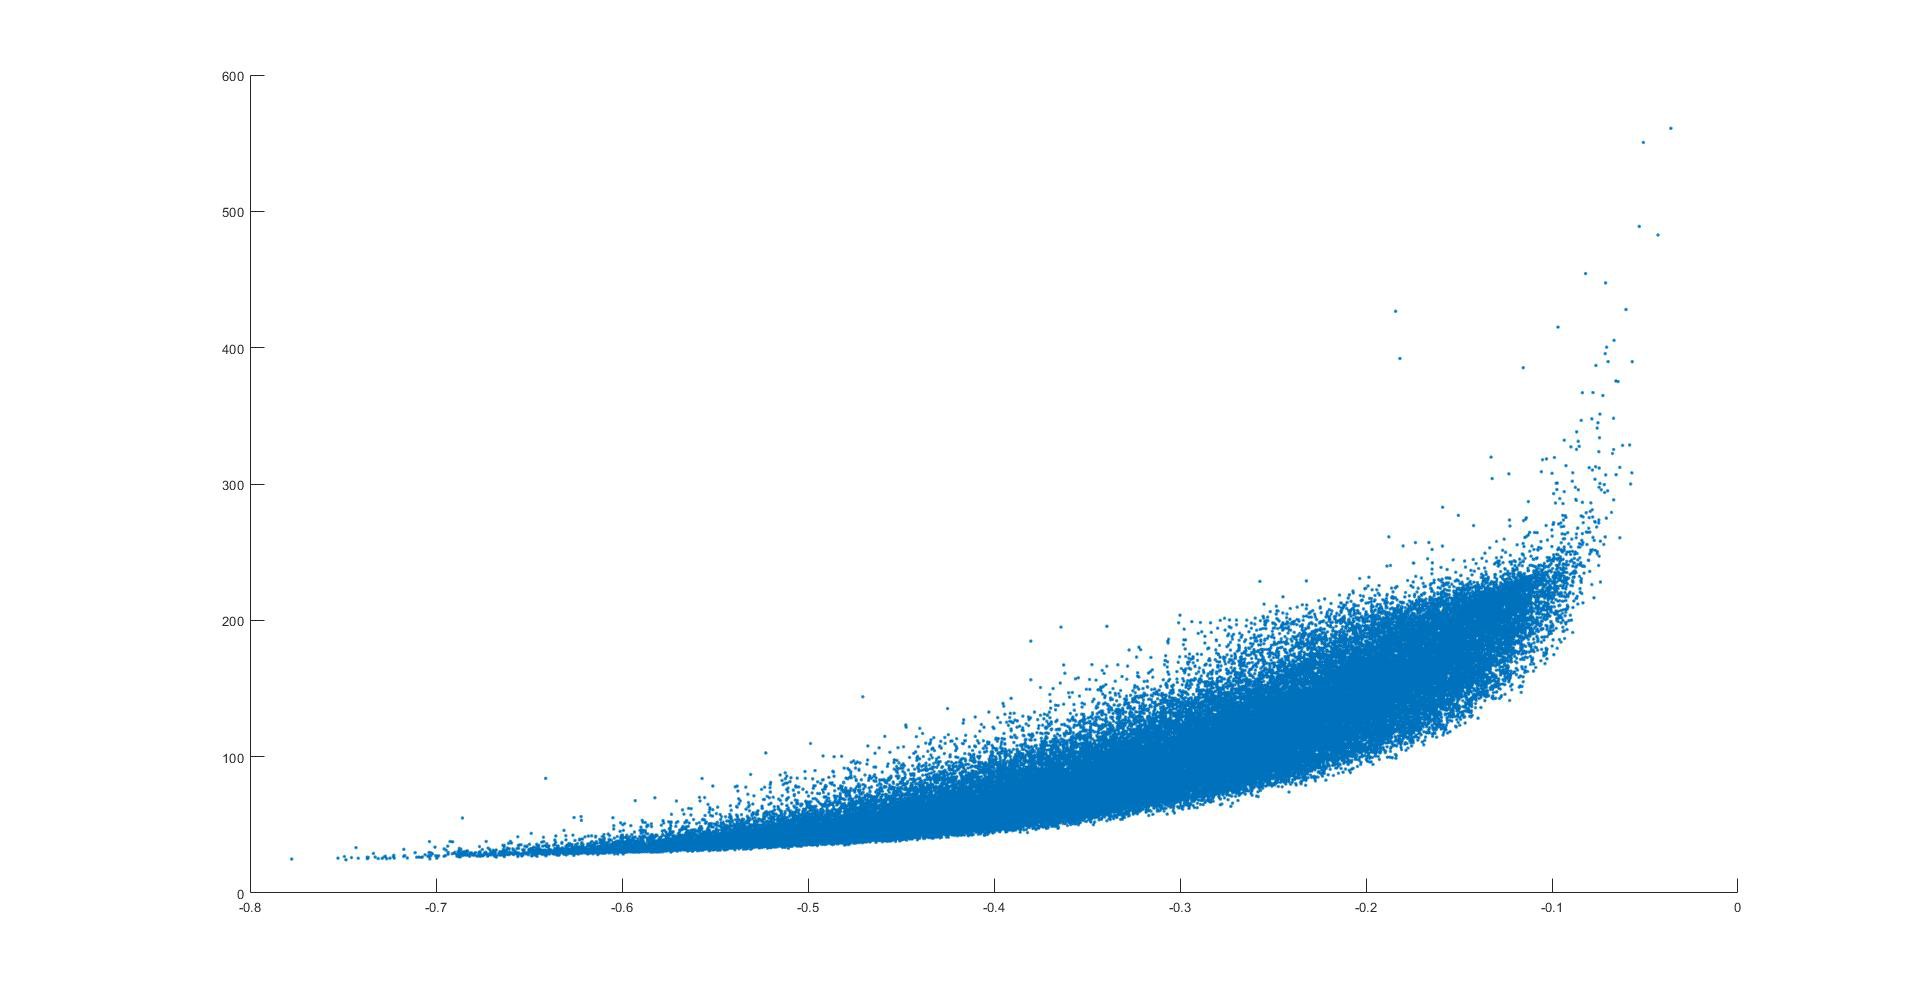
Next is a plot of angular depth vs. vector magnitude over a 24 hour period. Depth is expressed in radians from the horizon. Zero is at the horizon. - Pi/2 would be straight down. Higher intensity time points tend (seem) to come from a direction near the horizon. At this point, the device is not fully calibrated and the angular depth cannot be considered to be precise.
The next video is the 3D plot of compass direction vs. angular depth vs. combined probability parameter for a 24 hour period.
Discussions
Become a Hackaday.io Member
Create an account to leave a comment. Already have an account? Log In.