 Michael Doody
The data from the last log entry was collected on Feb. 3, 2020. This log shows about 19 hours of data from today, Feb. 5, 2020. The unusual features of the last plot are highlighted again to show the similarities from day to day.
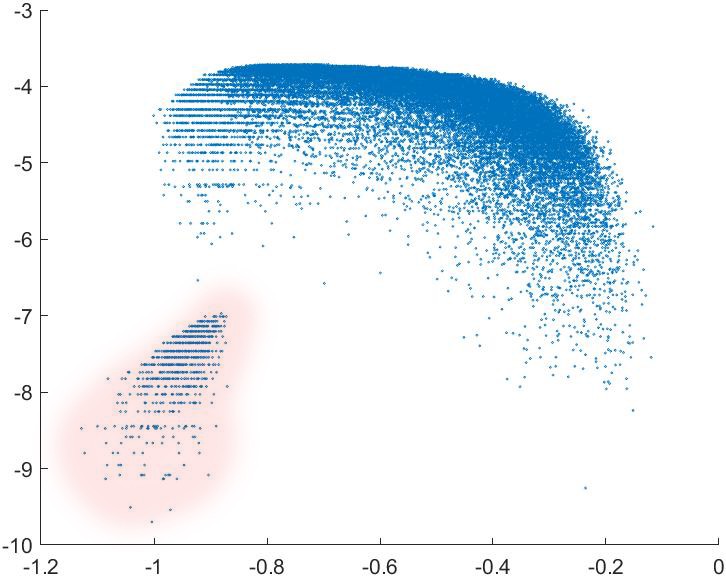
First, the plot of the angular depth vs. combined probability statistic -
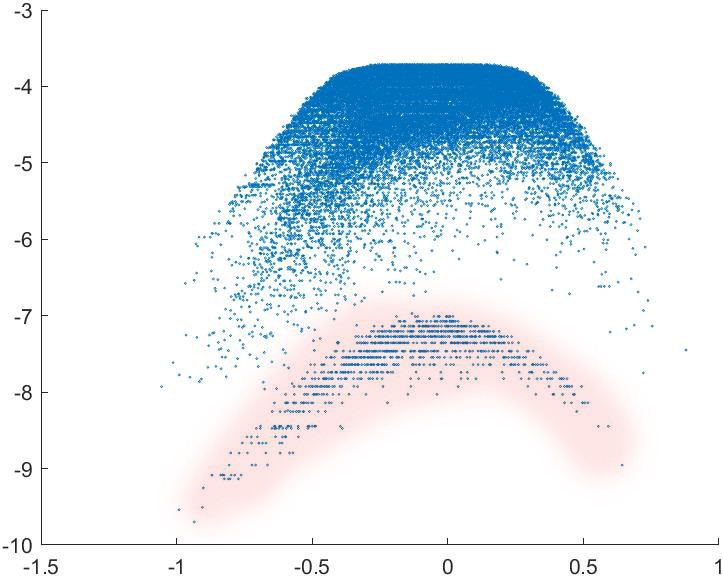
Next, the plot of the compass direction vs. the combined probability statistic -
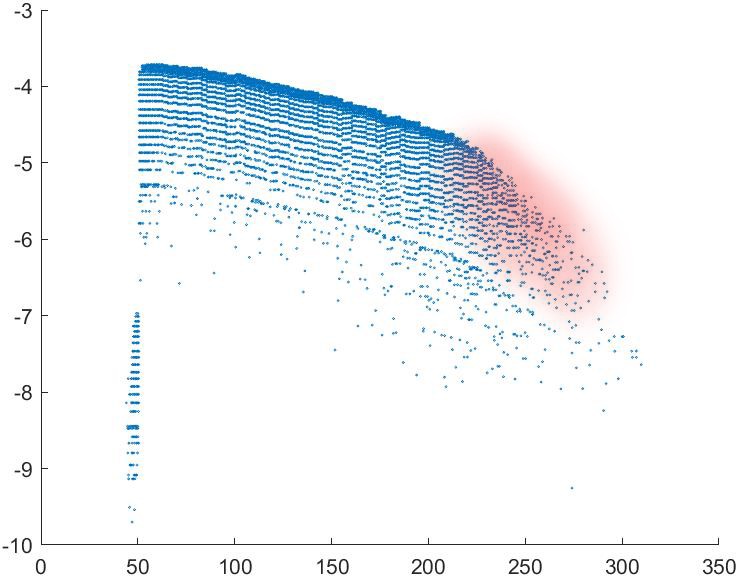
Finally, the plot of 3D magnitude vs. the combined probability statistic.
Lots of persistence of the unique features of this noise data. Now - how to use this?
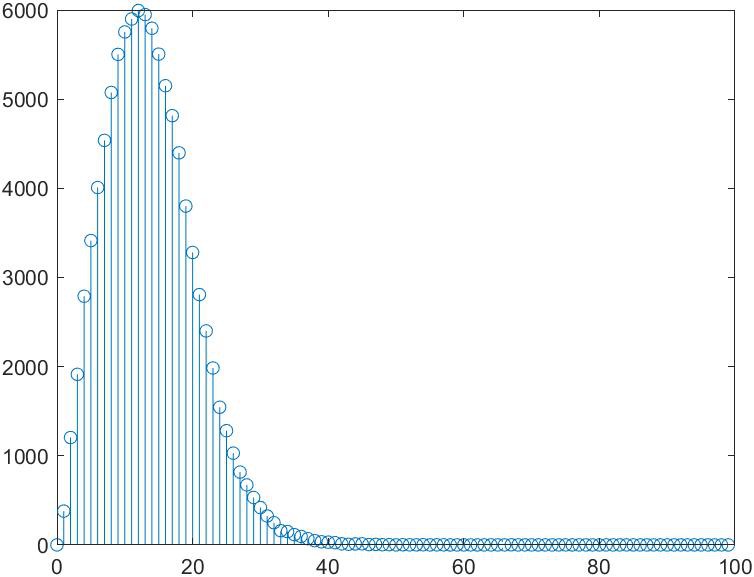
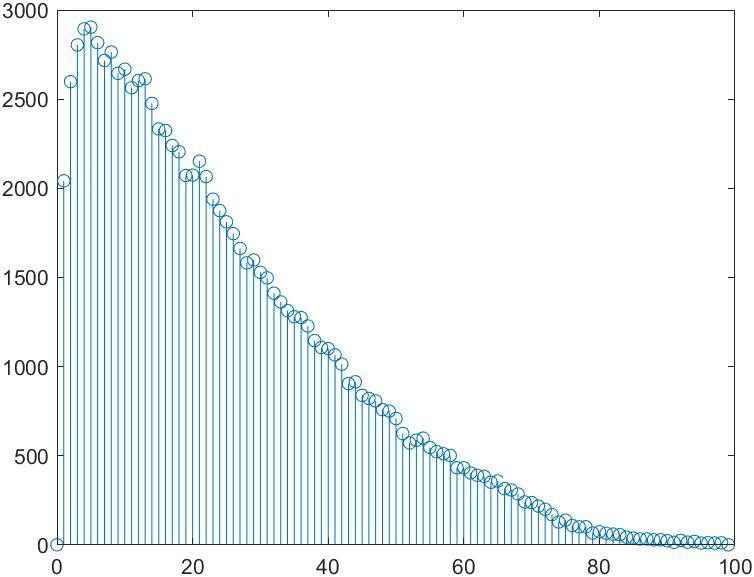
There was a request for a graph of what the 3D magnitude and angular location probability arrays look like. The following two graphs show how 102,000 data points sort out into their 100 respective probability "bins."
First, the 3D magnitude probability array -
Next, the angular location probability array -
Discussions
Become a Hackaday.io Member
Create an account to leave a comment. Already have an account? Log In.