 Michel Kuenemann
Motivations
Last year I had a loose contact in the irradiance (= available solar power) measurement panel. I fixed this issue in August 2014 but it appeared again recently.
The irradiance measurement gives the maximal solar power available at any moment. This figure is of premium importance in a PV system because it sets the target for optimal system yield. Any abnormal deviation from this curve be easily detected.
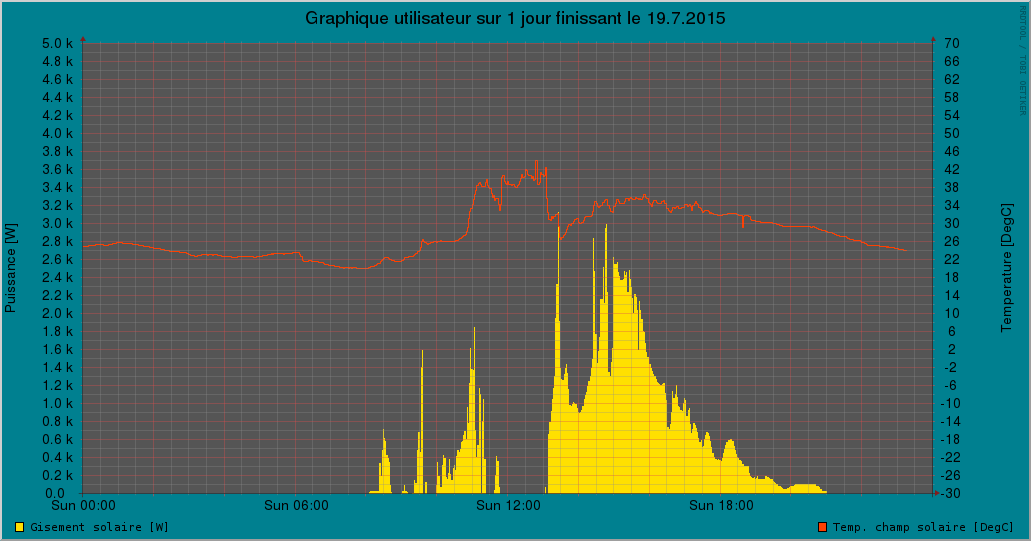
For example, the following chart shows the irradiance measured on the first of July 2015:
The nealy perfect smoothness of the curve indicates that the sky was perfectly clear during all the day. The peak available power reached 3800 Watts at noon (see left scale).

On this second curve the yellow surface is the irradiance during the same day and the blue line indicates the power delivered by the battery charger :
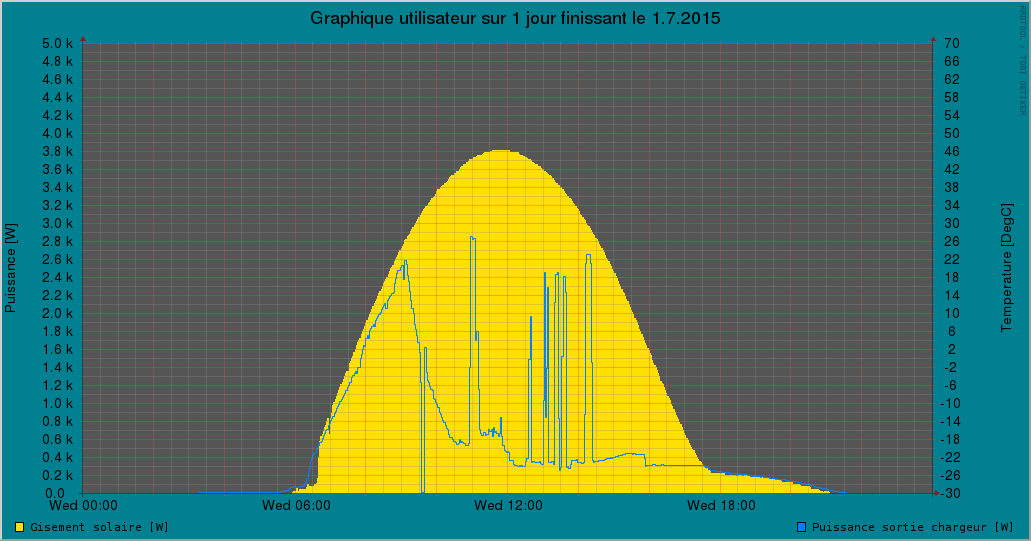
One can see that the blue line roughly follows the yellow curve in the morning and then decreases (probably) exponentially once the battery gets charged (at 9 o'clock). The peaks during the day depict sudden and temporary increases of consumption due to dishwasher or washing machine operation, for example. One can easily see that even during the heavy consumption moments, a surplus of solar power was still available. By the end of the day the blue line sticks again to the yellow one because the available power is then below the house's needs, so the available power is fully used by the system. Without the irradiance curve (yellow background), these interesting observations would have been impossible to make.
So I decided to replace the whole panel. I purchased a new 10 Watt polycristalline panel on Ebay.
Adaptation and Integration of the new panel
The new panel is a bit smaller than the old one, but it should fit in the existing location. I made following adaptations to this panel before its integration in the system :
- Drilled a 4 mm hole in the aluminum chassis for temperature sensor monting (LM35 in TO92 package inserted in a crimp terminal)
- Added two 20 X 15 mm bakelite rods to increase the thickness of the panel (glued with epoxy)
- Removed the protection diode
- Put a 2.2 Ohm 2 Watt shunt resistor across the output terminals
- Glued the decoration LEDs strip and controller
- Wired the voltage sense terminals
Electrical aspects
The old panel had a 1 Kw/m² short circuit current of 1.4 A. It was equipped with a 1 Ohm shunt resistor. So with a 1 Kw/m² of solar power, 1.4 V appeared across the shunt resistor.
The new panel has a 1 Kw/m² short circuit current of 0.6 A. It is equipped with a 2.2 Ohm shunt resistor. So with a 1 Kw/m² of solar power, 1.32 V appeares across the shunt resistor. This value is close to the previous one, so it will be easy to recalibrate the acquisition software (SFIT module).
The faulty panel during removal.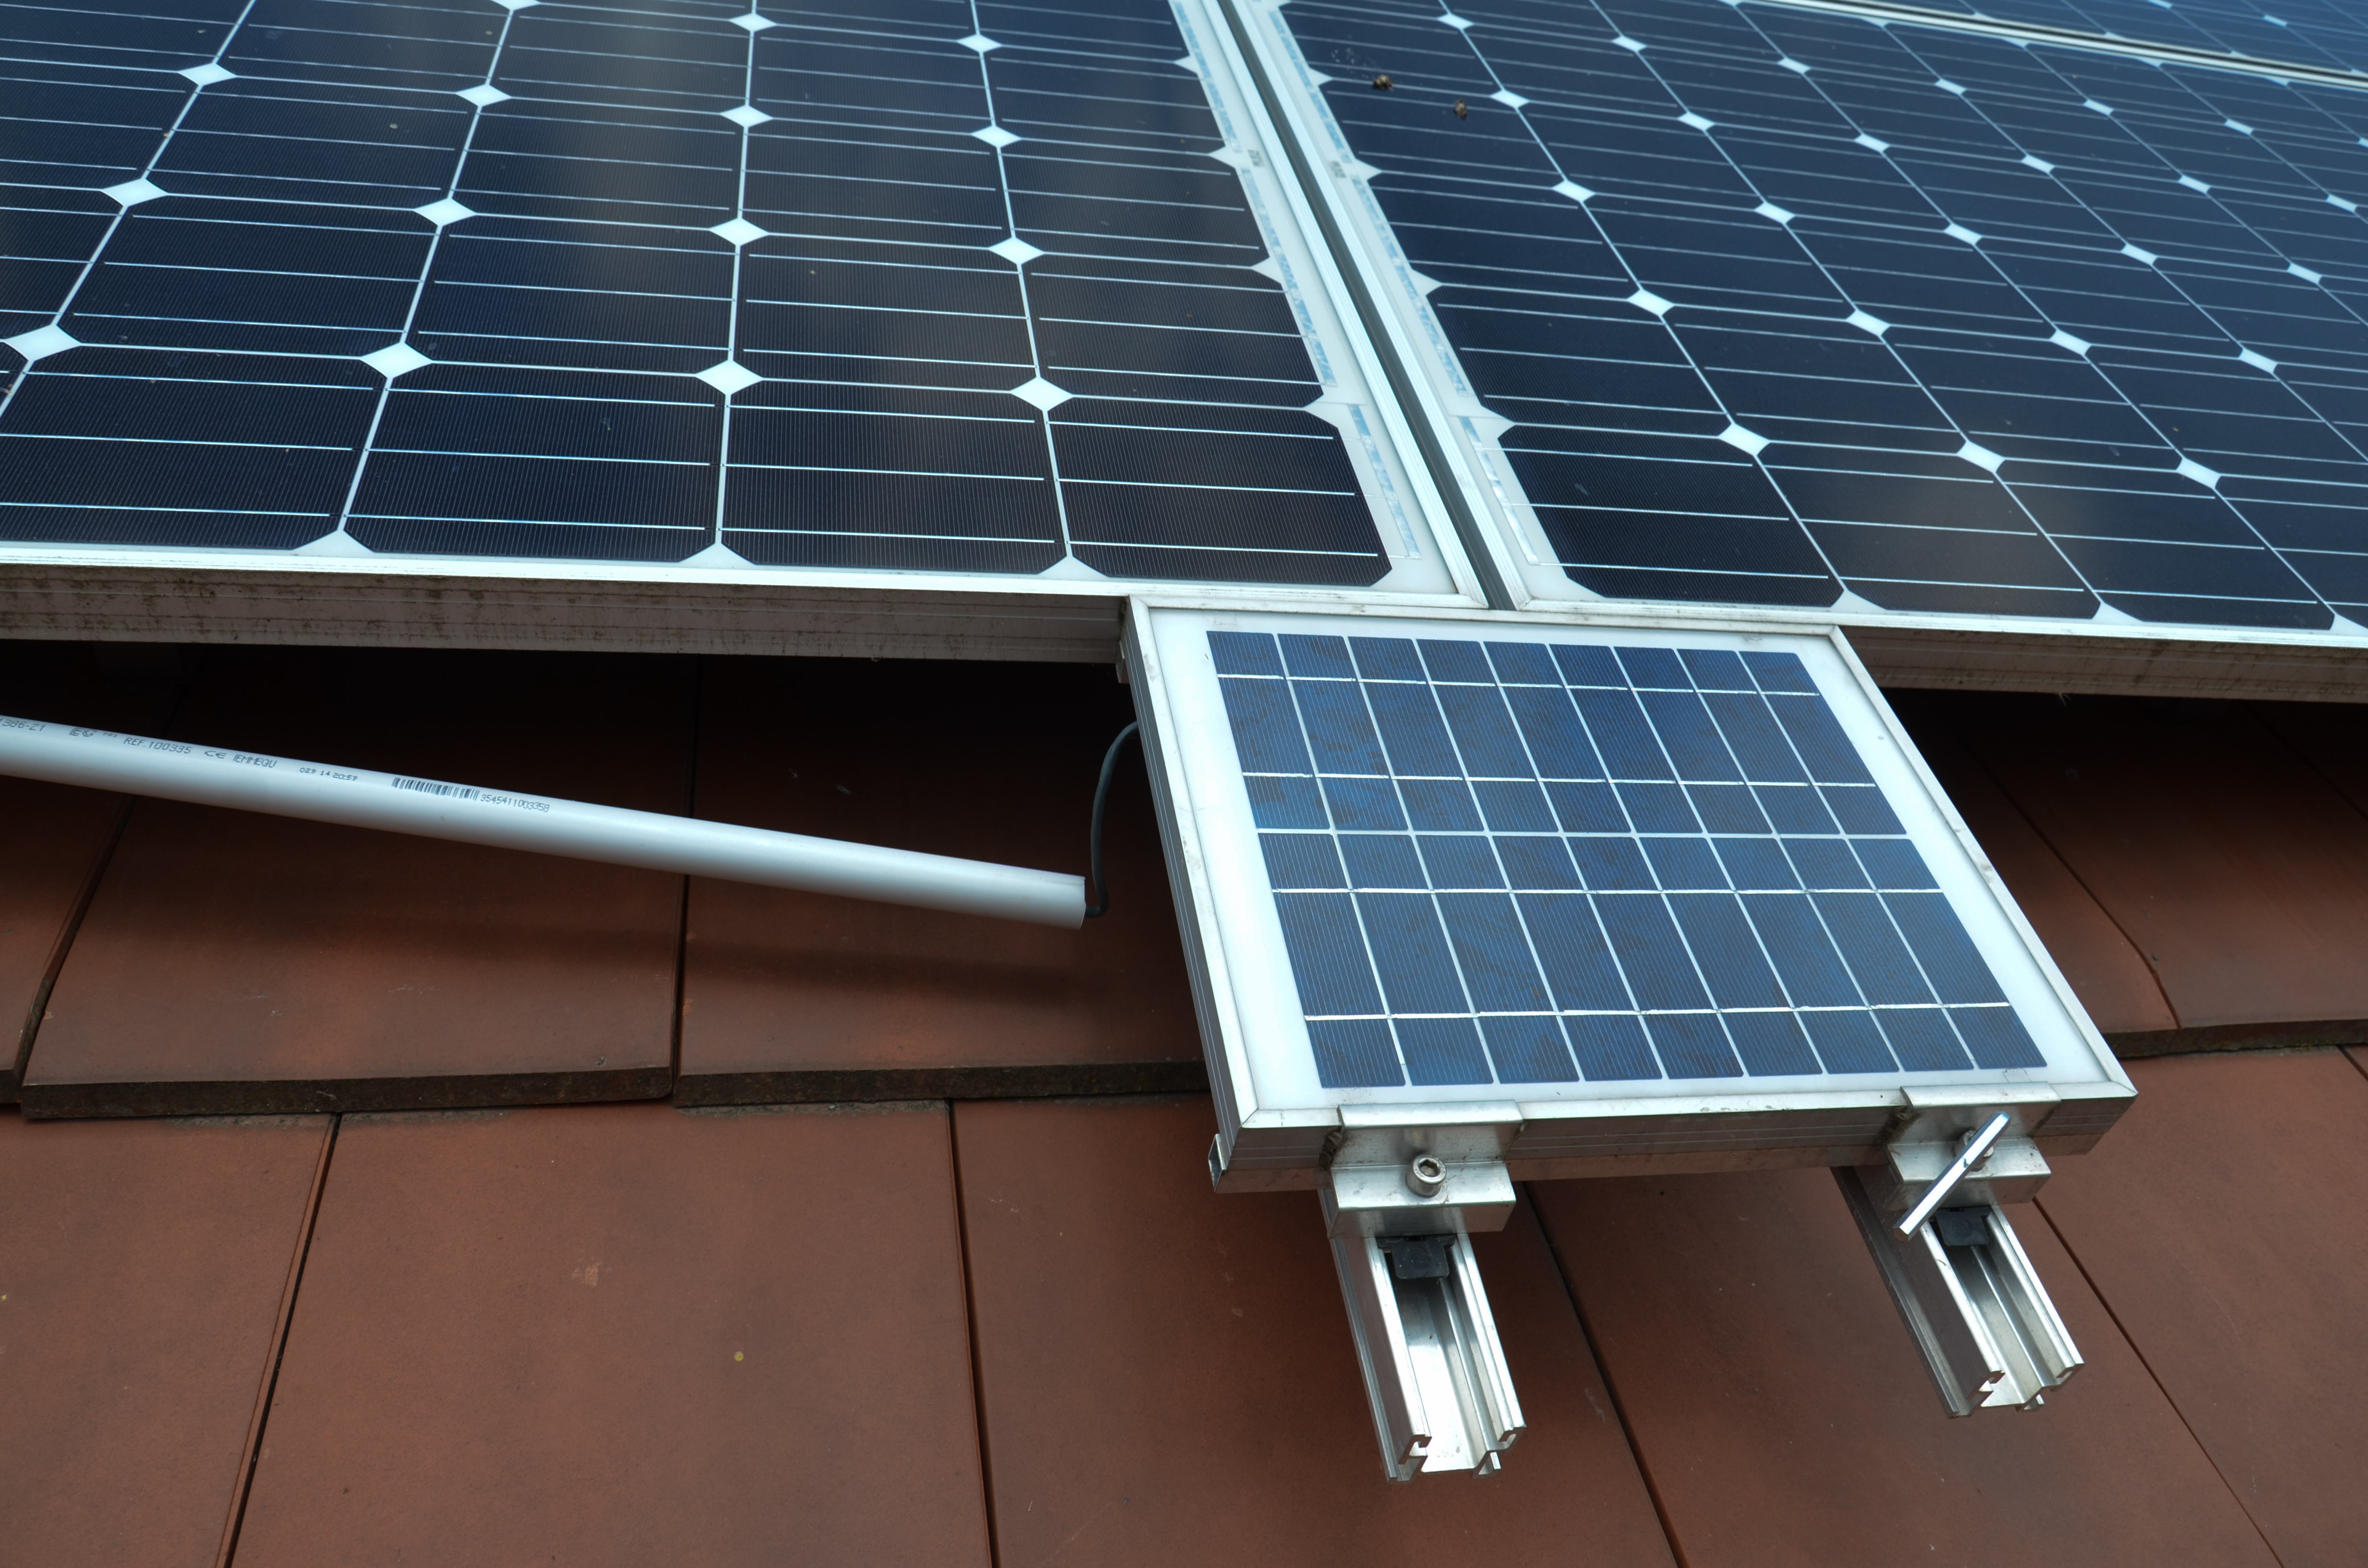 | The new panel equipped with a 2.2 Ohm shunt resistor. The diode has been removed. Two bakelite rods are added to increase the thickness of the panel to the standard value of 40 mm. 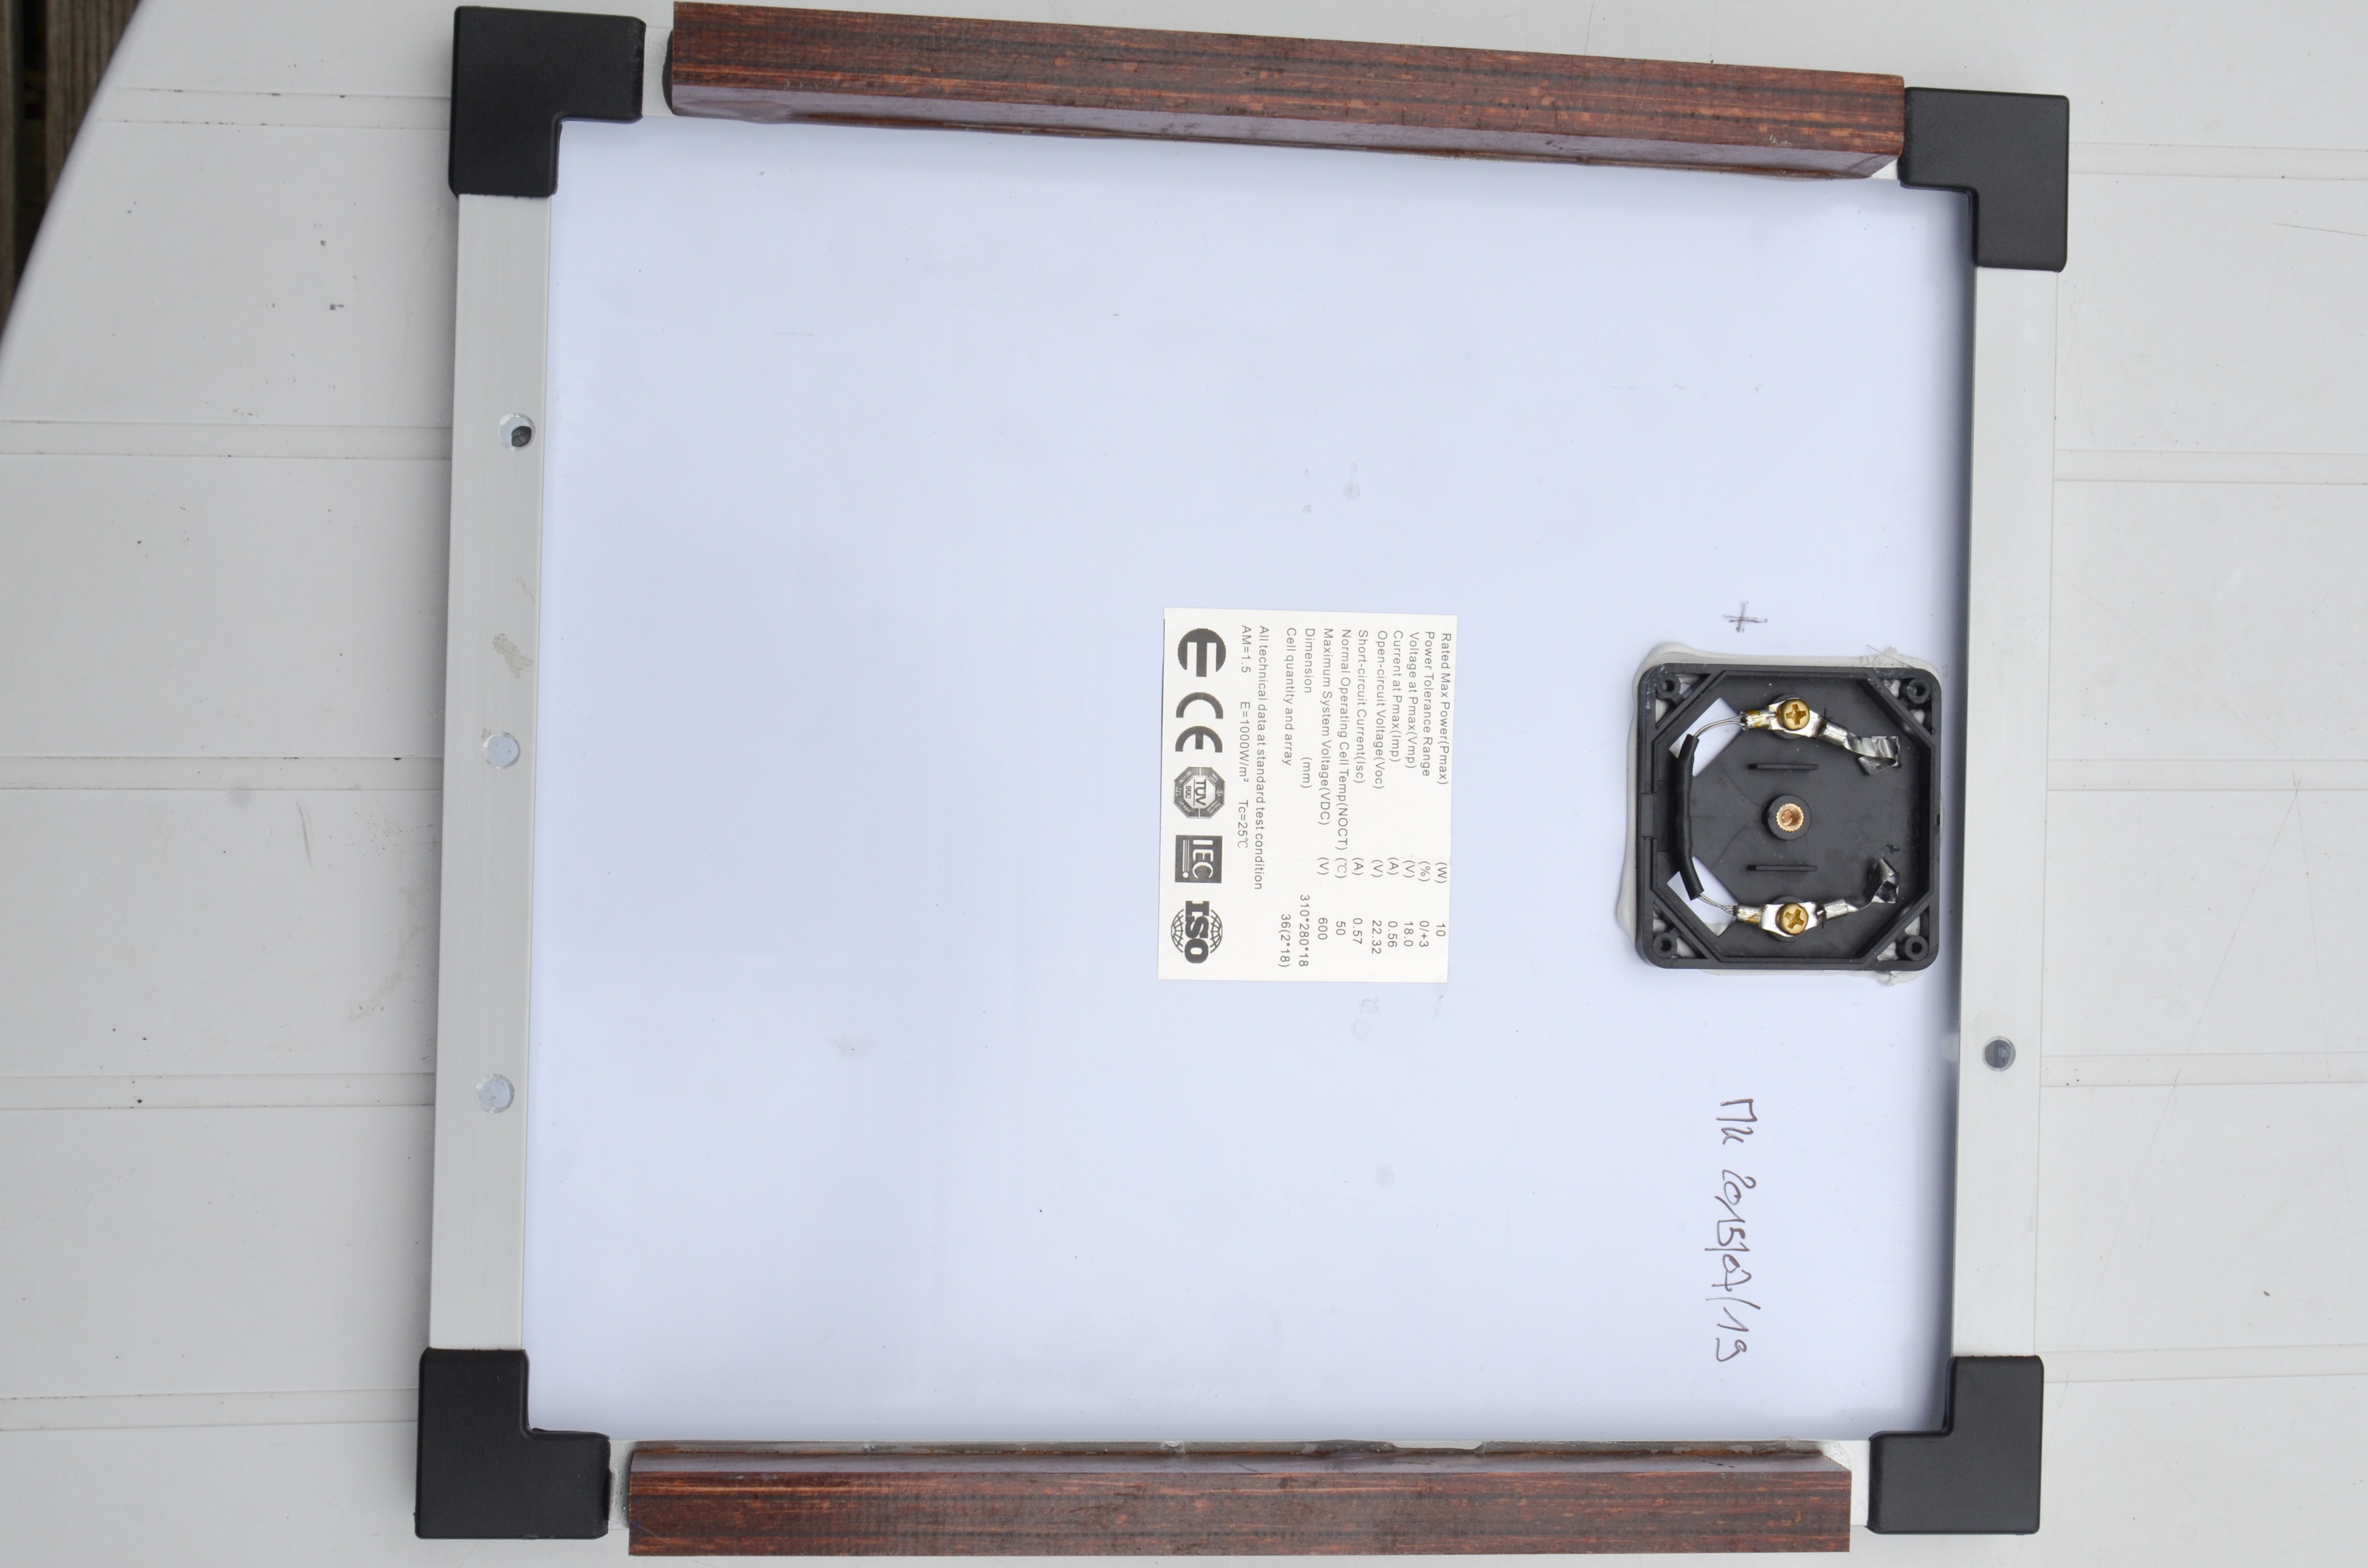 |
| The new panel equipped with the temperature sensor, on the left, and the LED strip, placed diagonally. The output voltage is measured across the 2.2 Ohm shunt resistor. When the sun shines with a rate of 1 Kw/m², the output voltage is 0.6 A * 2.2 Ohm = 1.32 V. 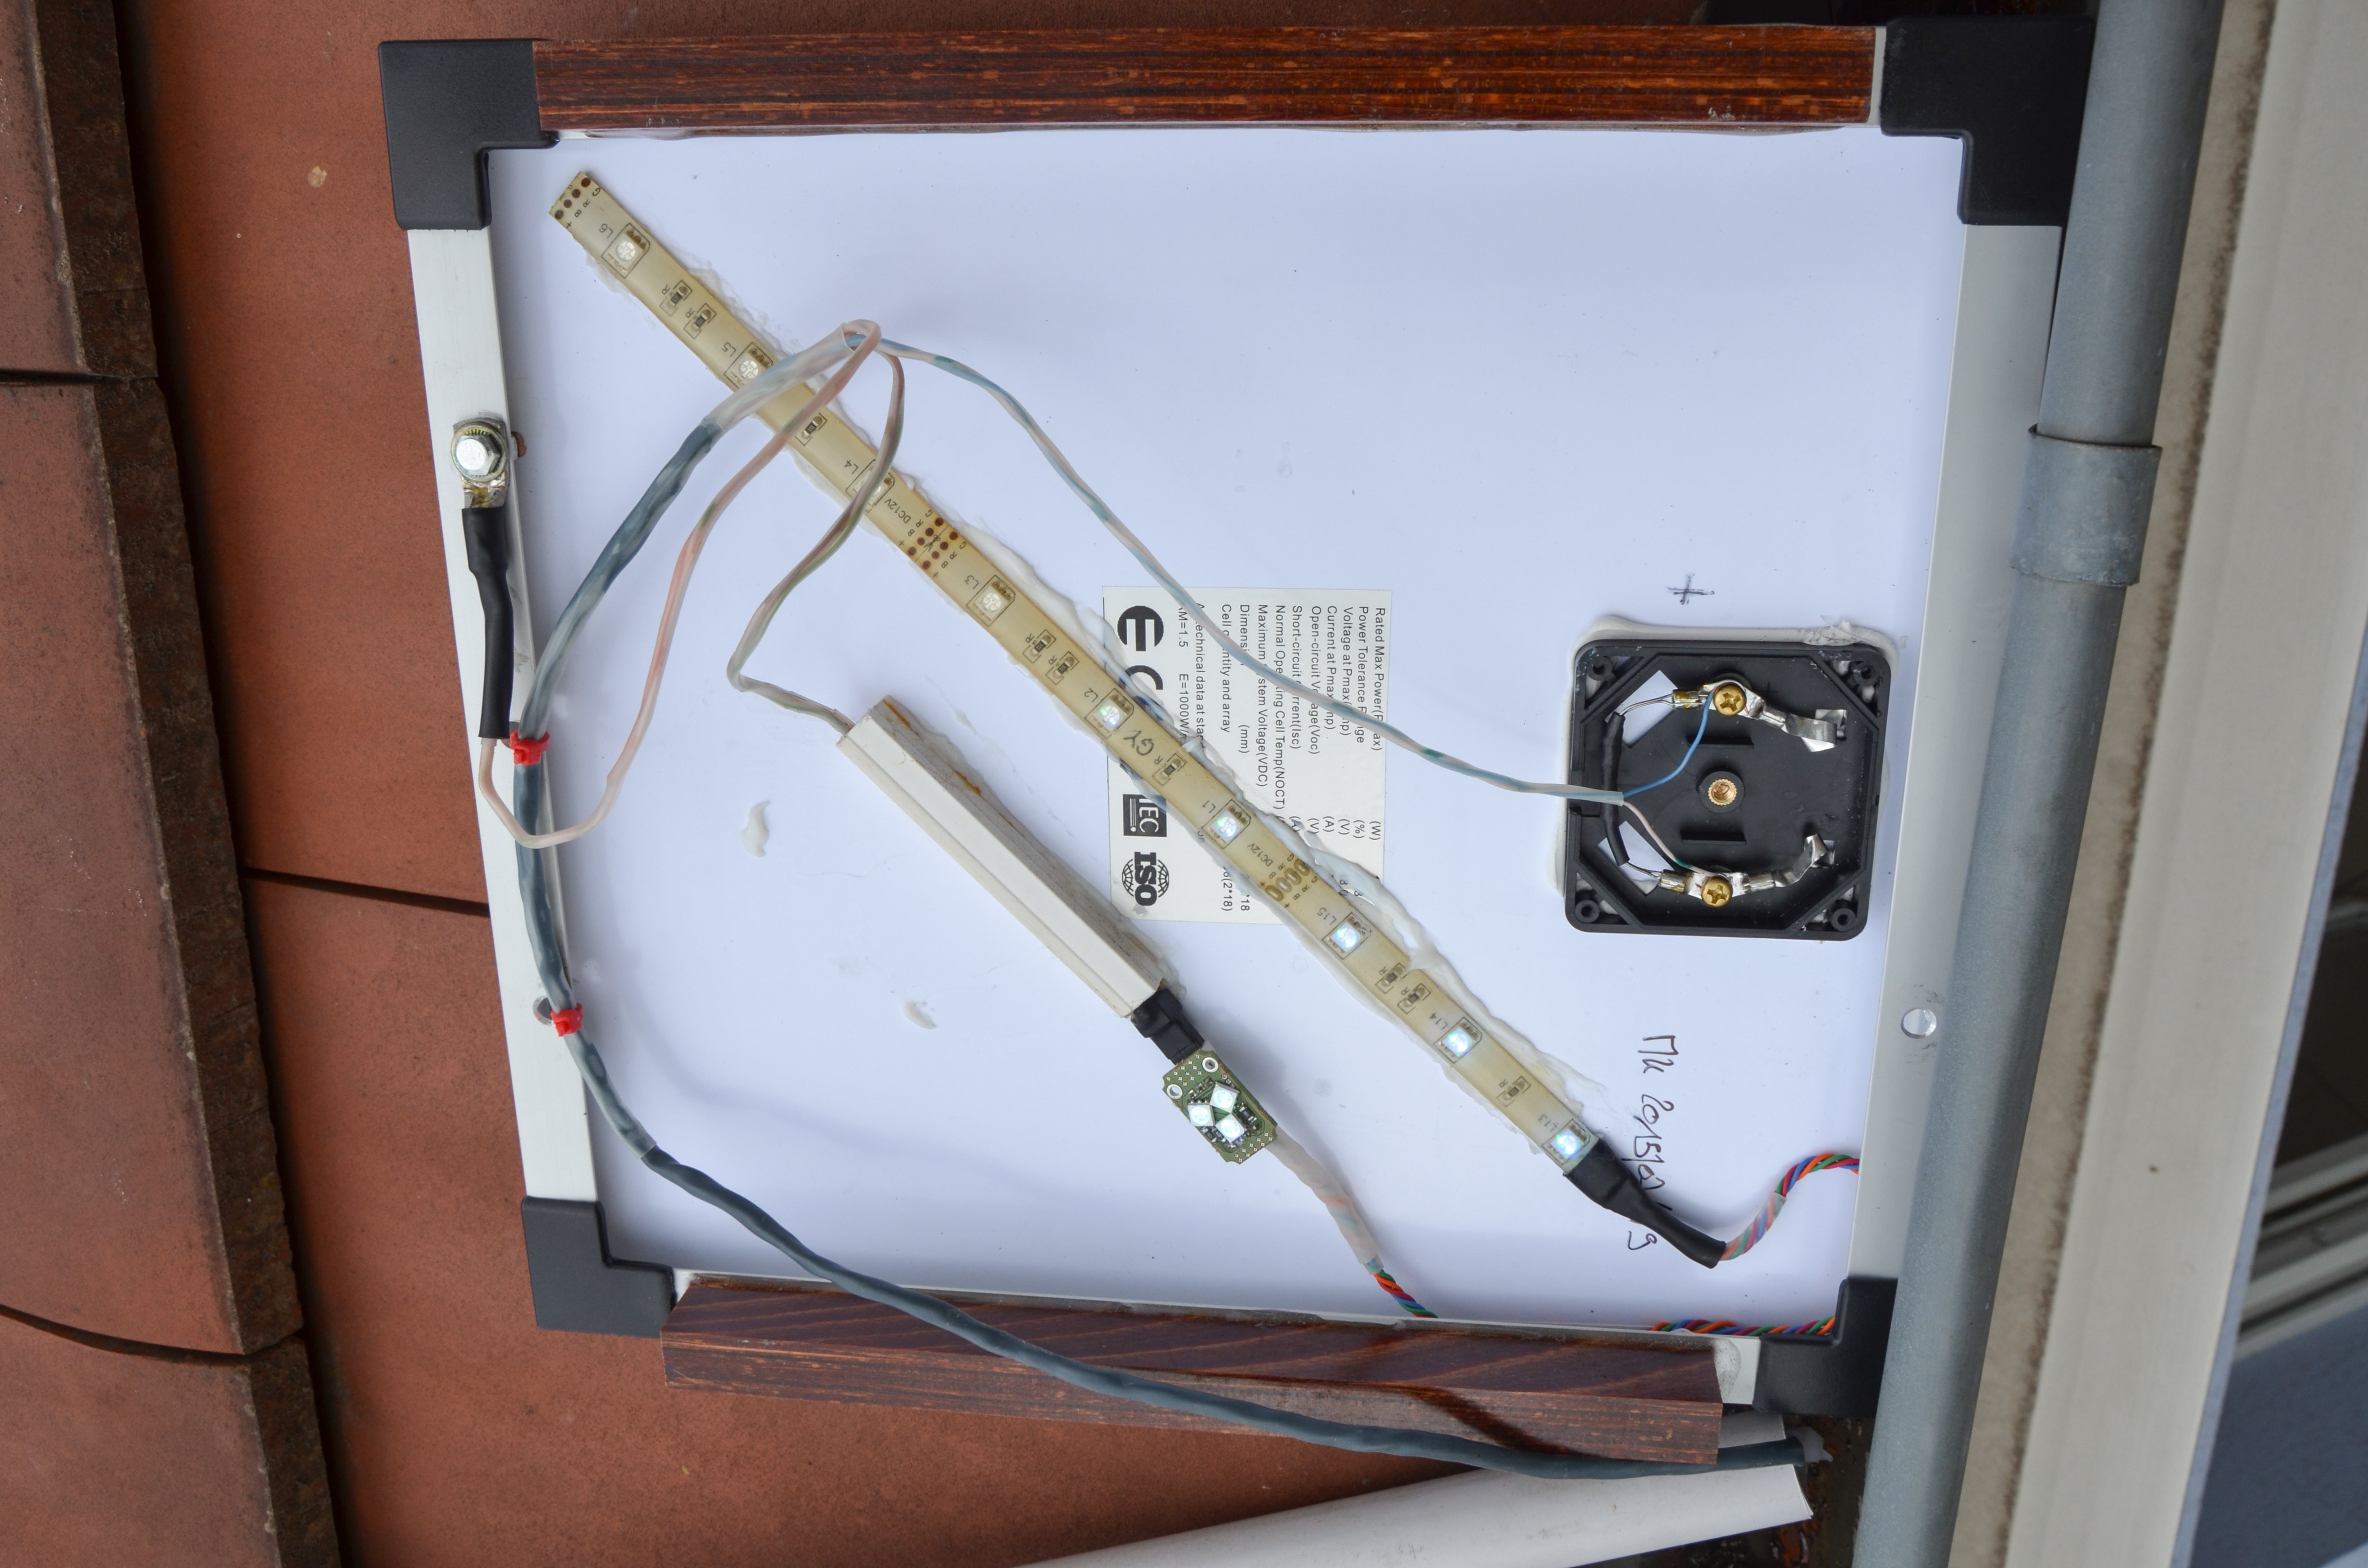 | The new panel installed and tested.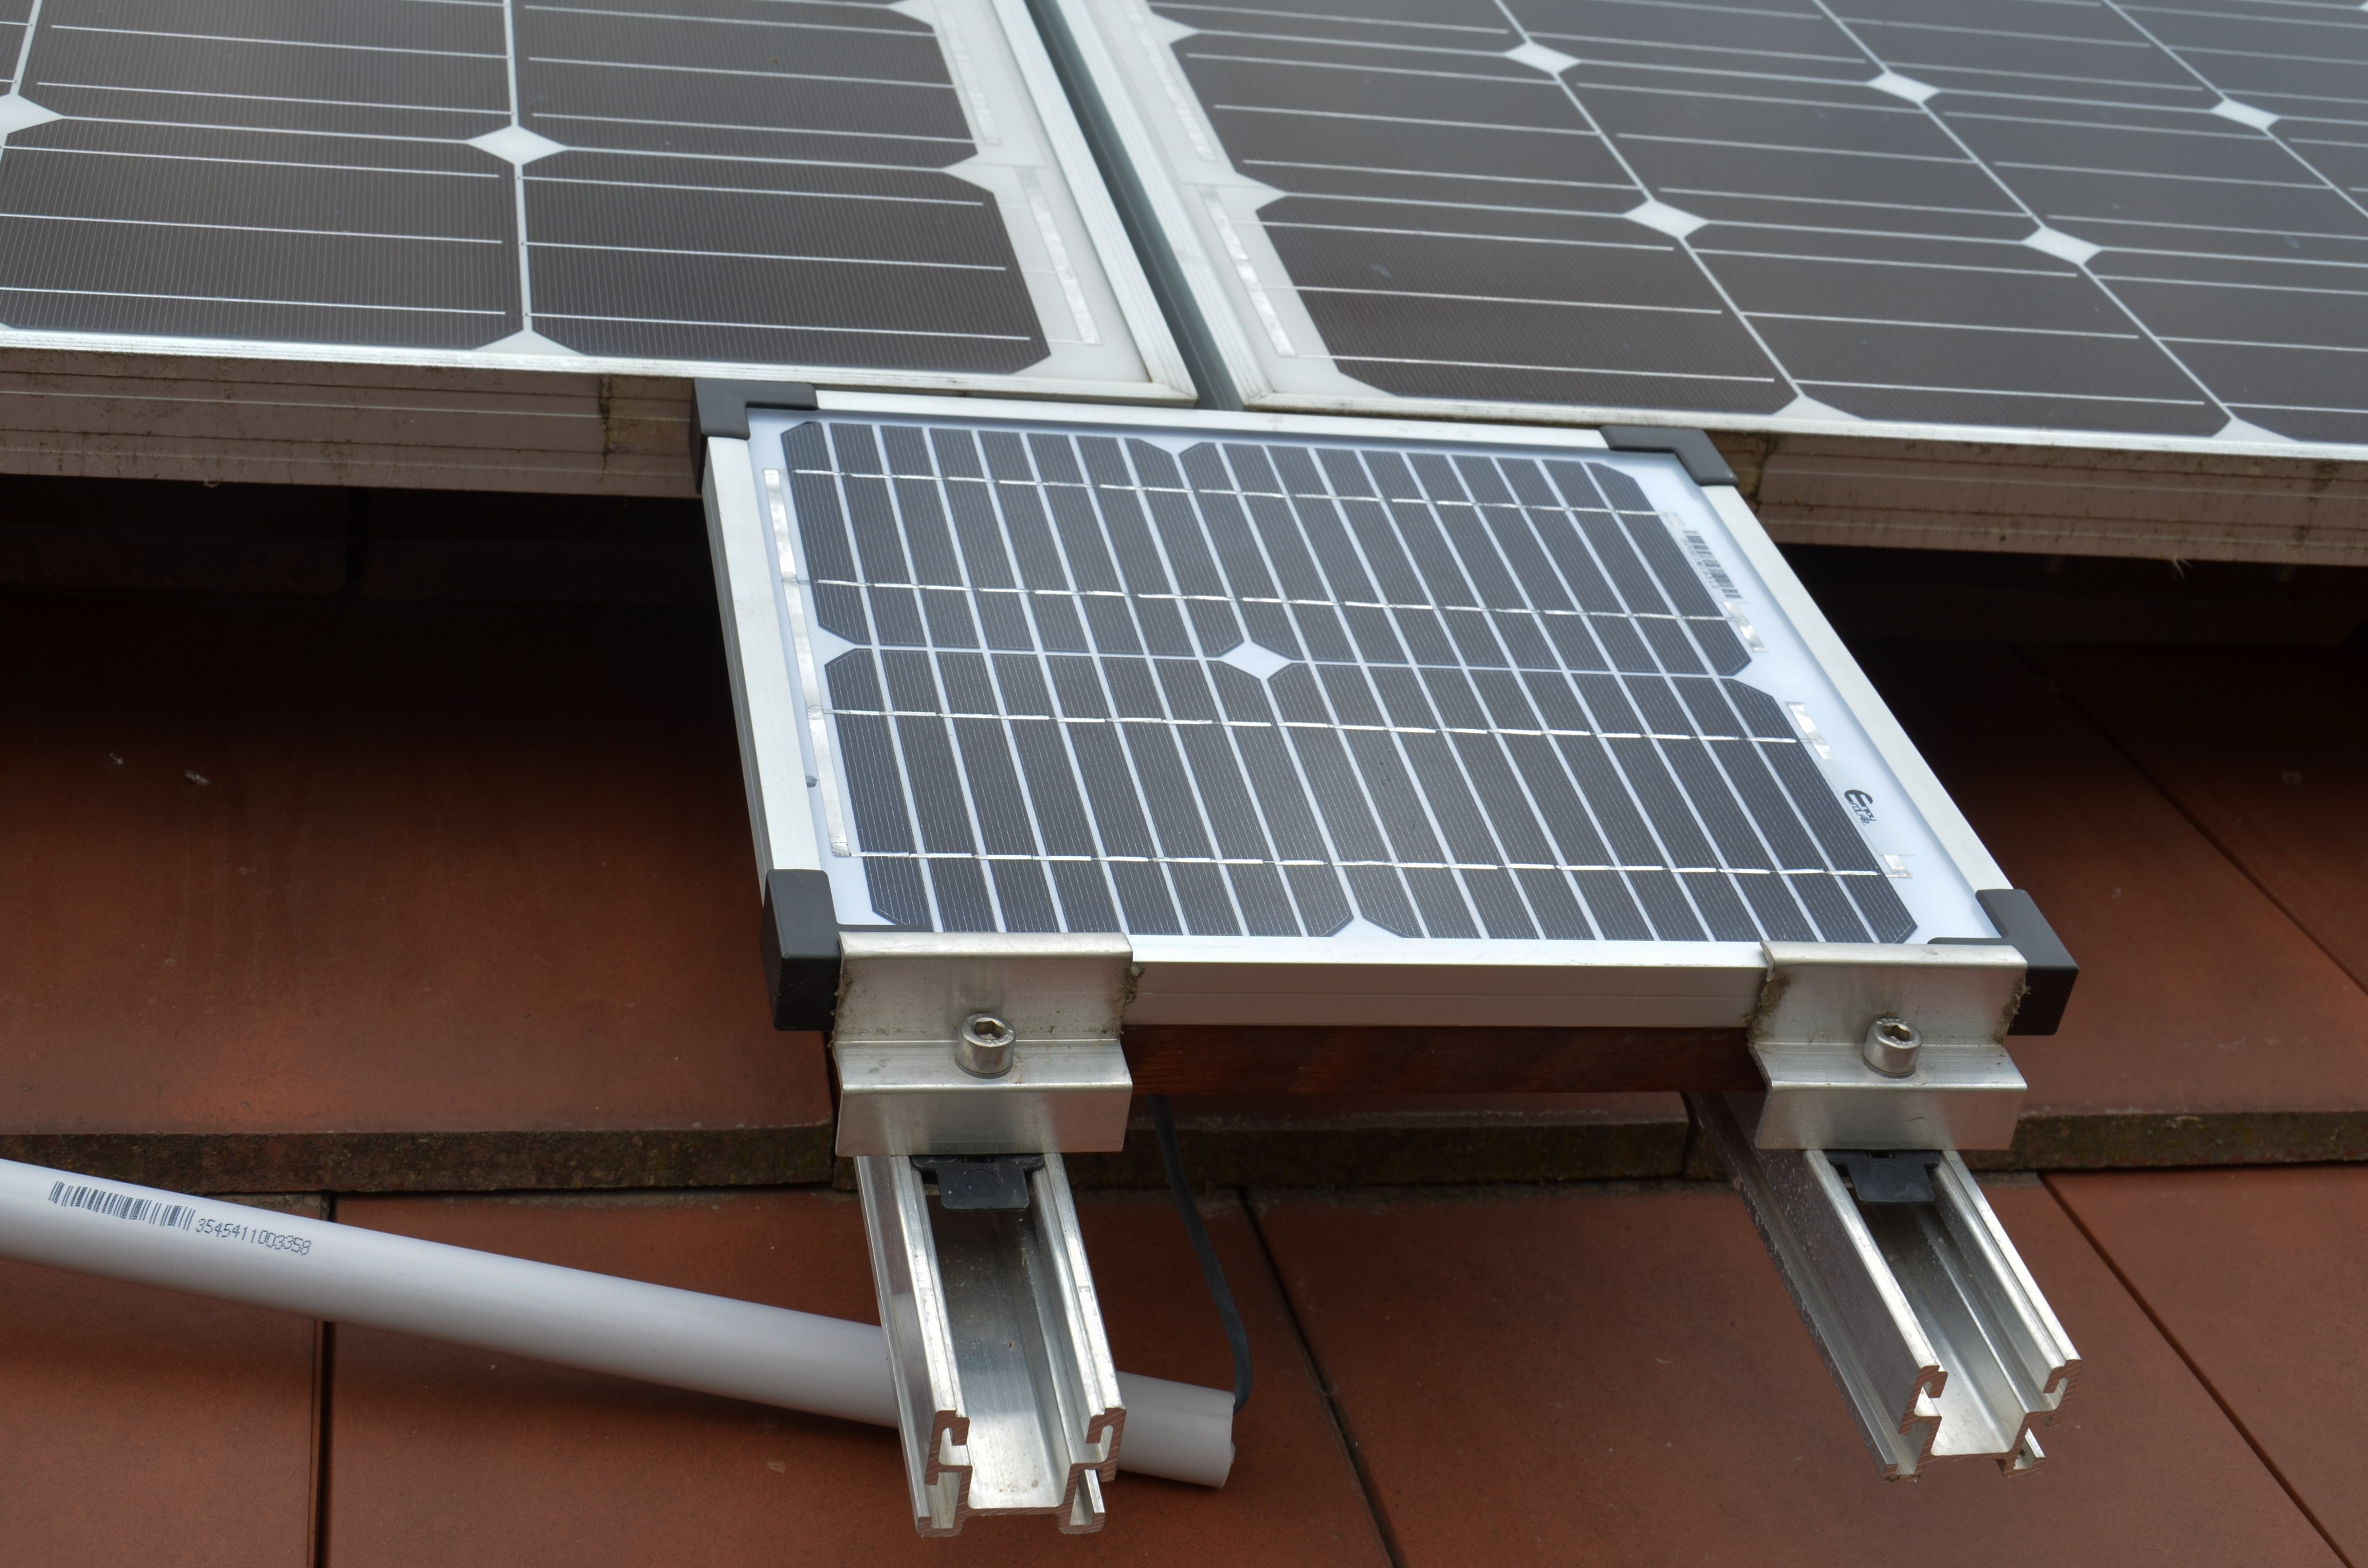 |
| The new panel deco lighting works perfectly in Solar mode: The color is a mix of blue and green (cyan) The LED controller is available here 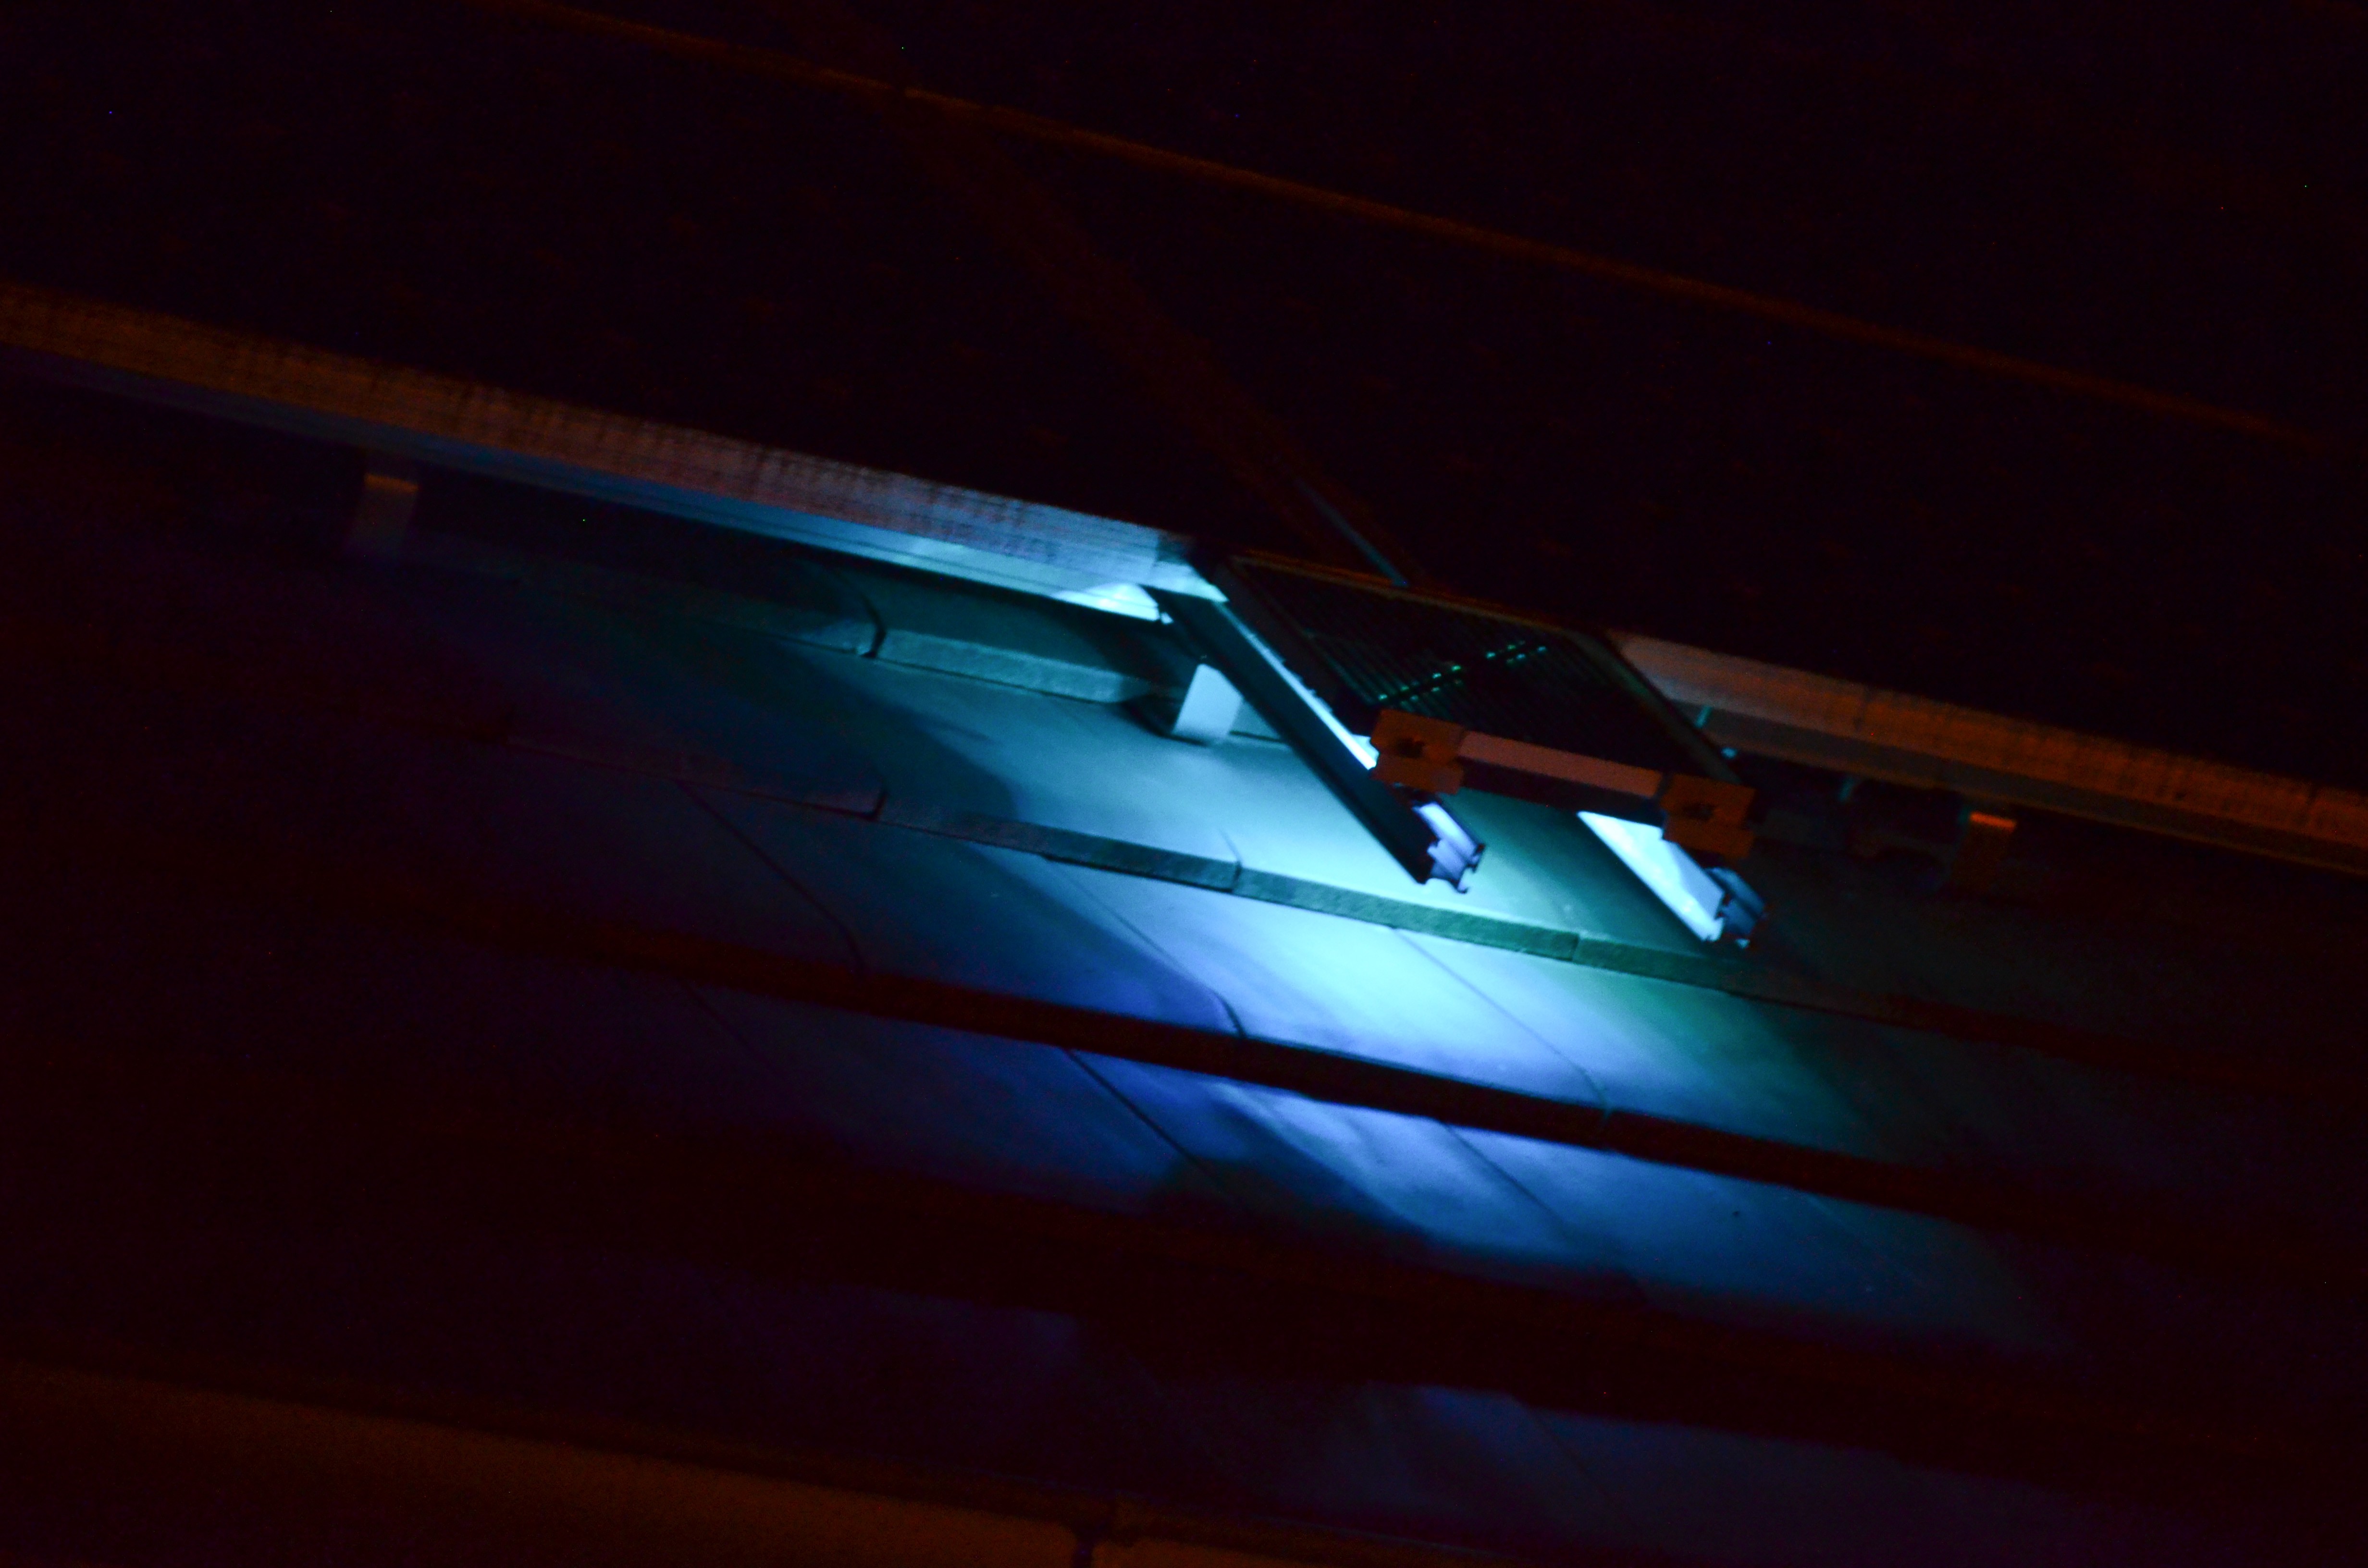 | and also in Grid mode: The color is a mix of red and green (kind of yellow) 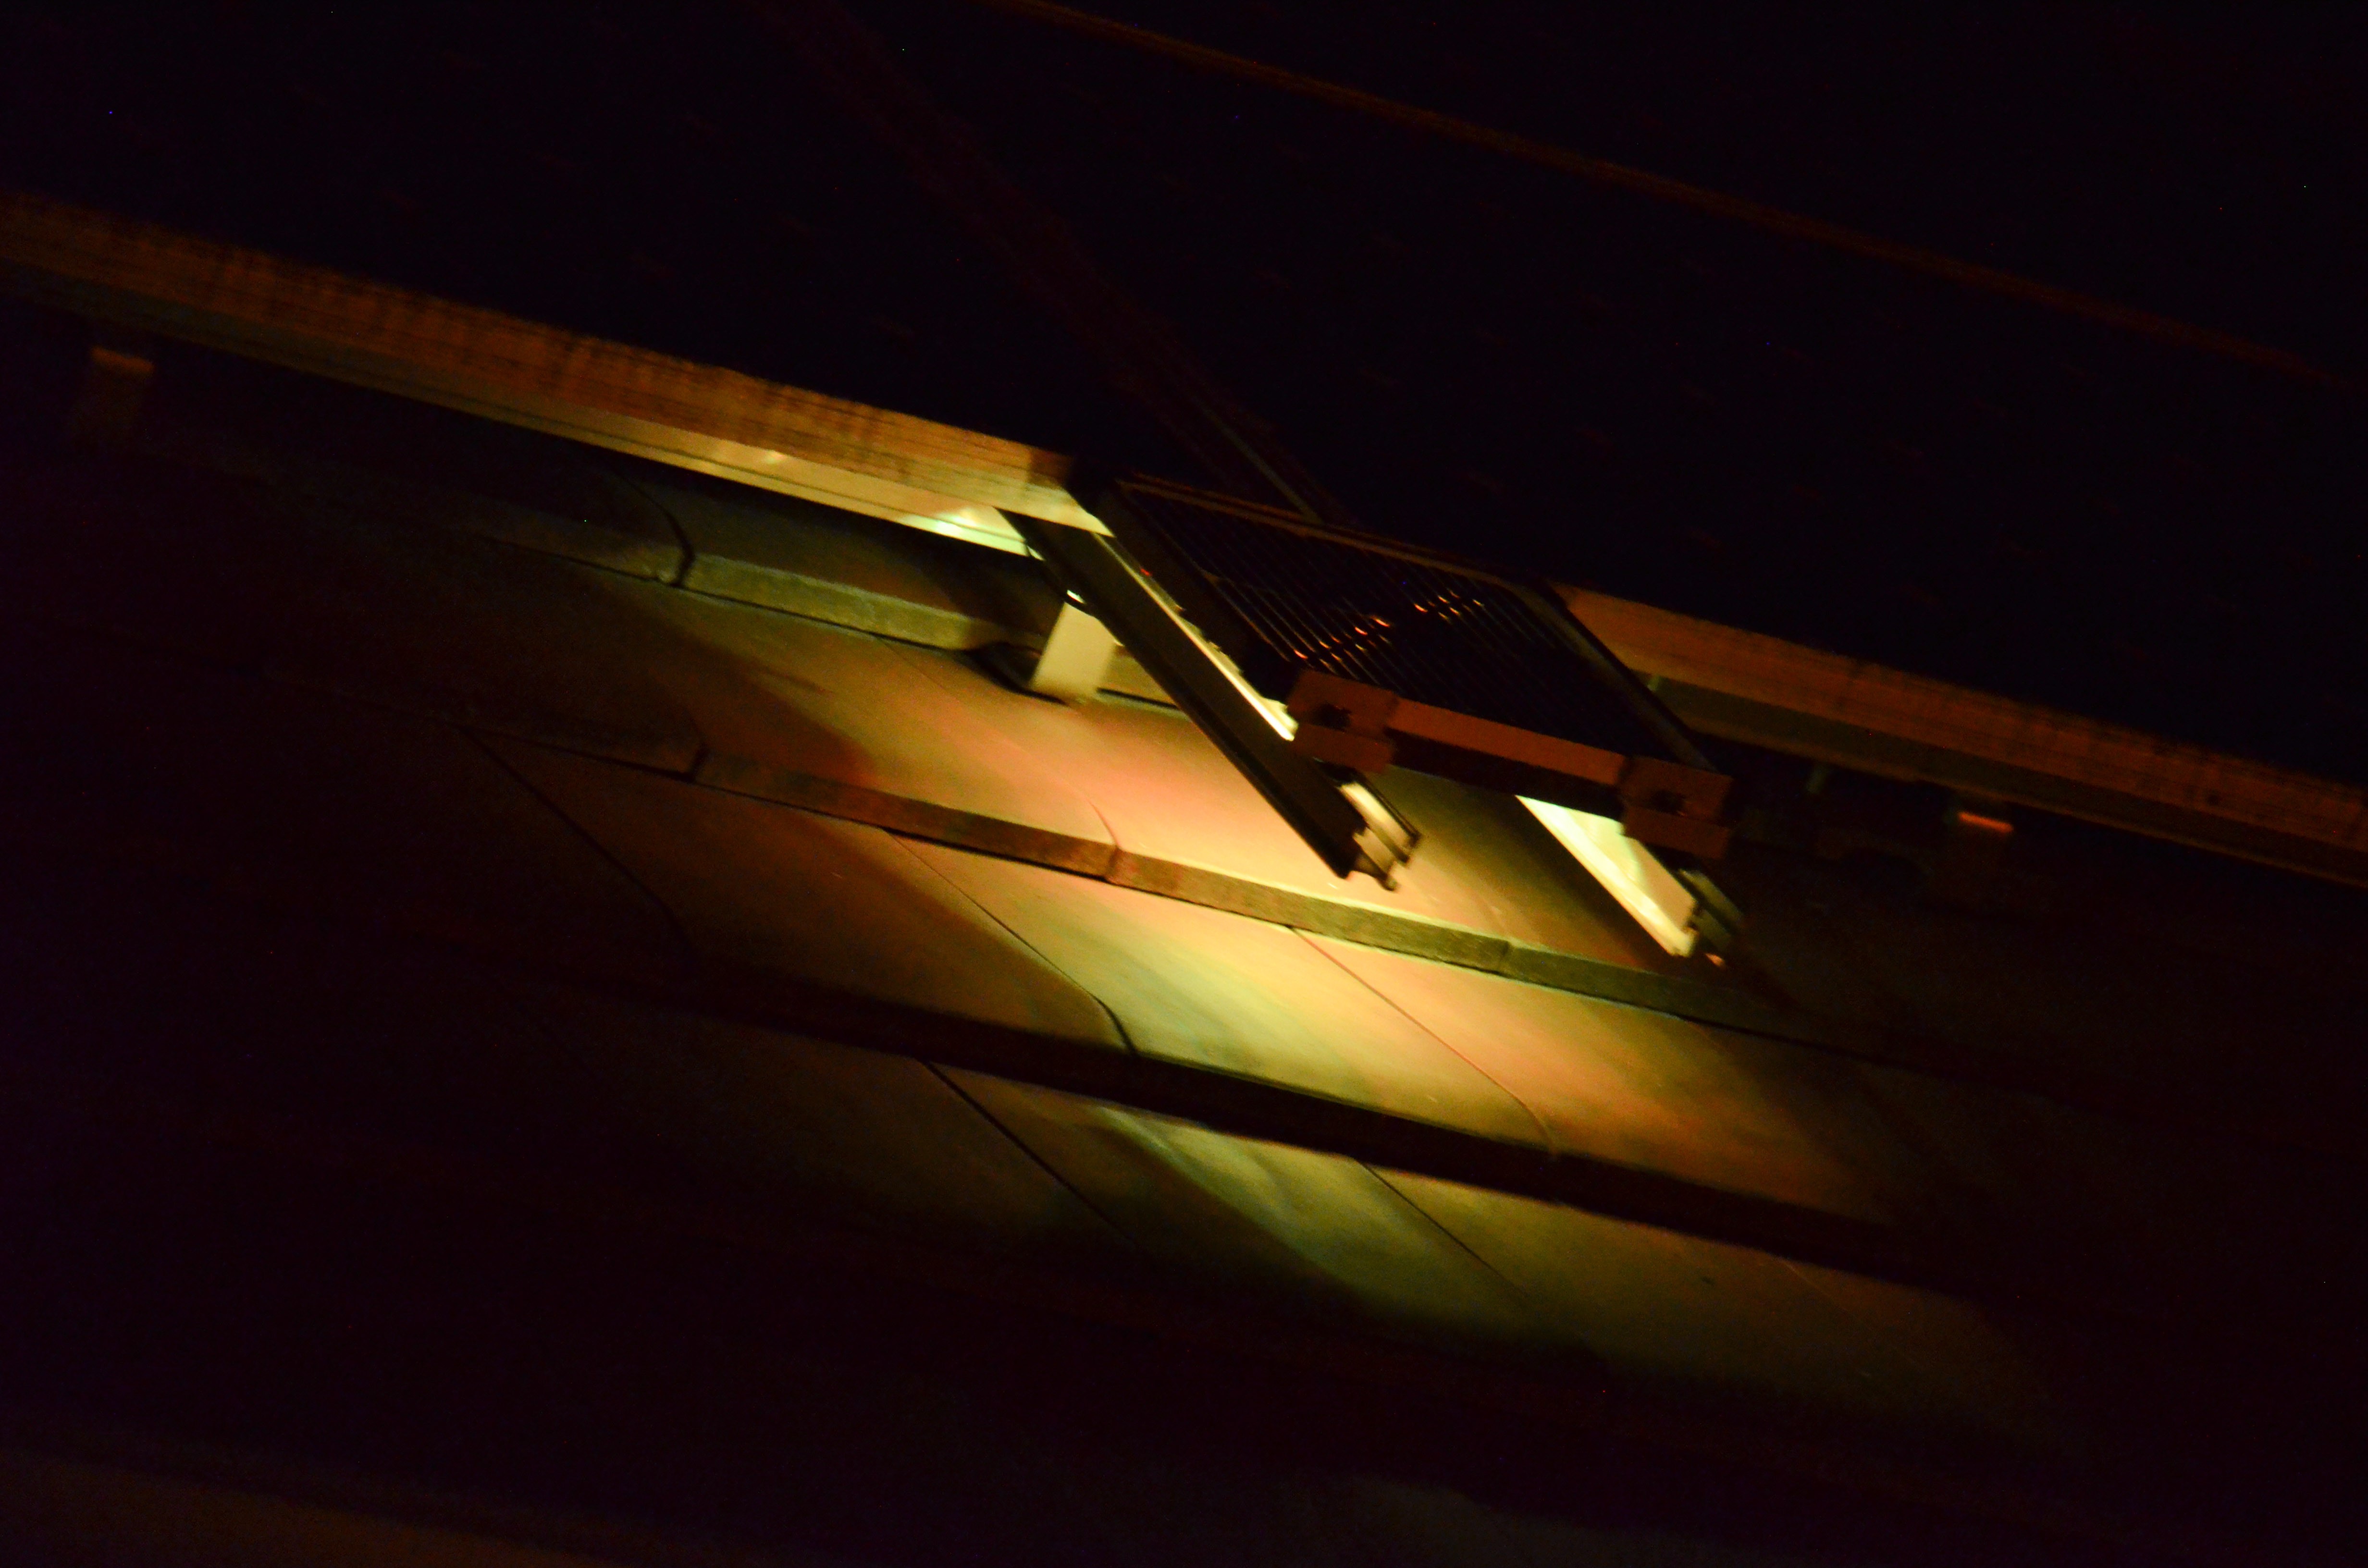 |
Today's curves after panel replacement
The new panel has been put into service at approx. 1 PM. One can see that from this moment on, no more discontinuities (interruptions) appear in the yellow irradiance curve:
Discussions
Become a Hackaday.io Member
Create an account to leave a comment. Already have an account? Log In.