 Michel Kuenemann
I have (at last) finished the statistics page of the "MyPV" website. This page is in english, you lucky guys :-).
If you click the STATISTICS menu button, you'll get this:
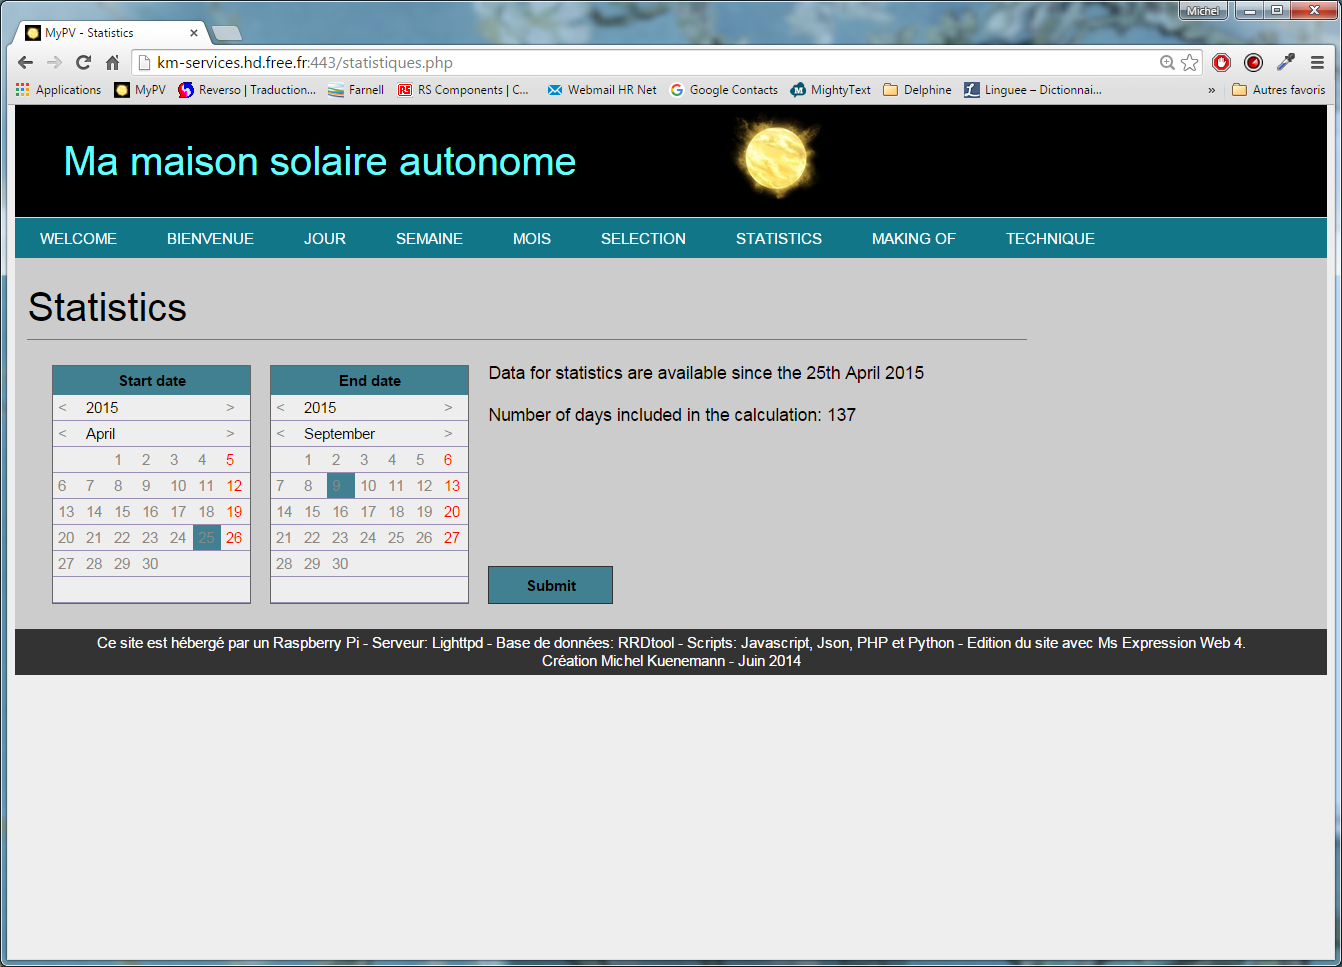
Select then a start date (posterior to April, 25th 2015) and an end date.
If you click the Submit button, you'll get this kind of screen:
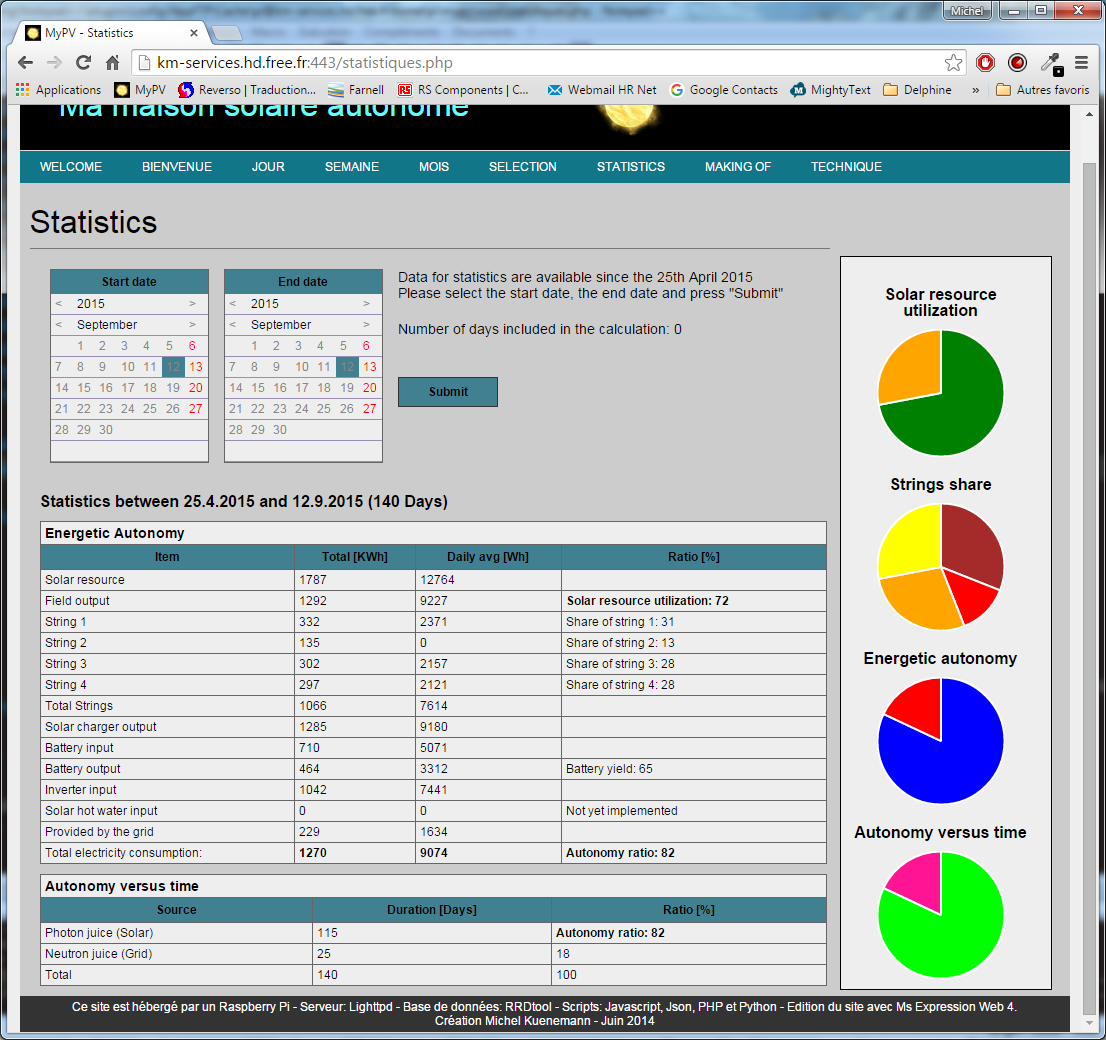
The Raspberry Pi hosting the site computes for you quite a lot of interesting figures regarding the system. You will see that the output page is obtained rather quickly. Furthermore the amount of calculation is always the same and does not depend of the amount of days taken into account in the statistics.
I hope that the page is self explaining. If you have remarks or questions, do not hesitate to ask me for clarifications.
A few words about the techniques and tools used to build this page
The page itself was edited with MS Expression Web 4 (a free and rather cool tool from Microsoft).
The calendars are managed thanks to a piece of Javascript. I was inspired by this german Guy's site.
When the user cliks "submit" the start date and the end date are posted to the server which executes the php code included in the page.
The php program launches several "rrdtool fetch" commands to retrieve the relevant data from the Round Robin databases. The results of these queries a stored in regular text files.
The php code parses the content of the text files and performs all the calculations. The results are "echoed" into a new html page which can then be displayed by your browser.
The charts are created with Chart.js and jQuery.js
The styles are managed in a separate css file.
Discussions
Become a Hackaday.io Member
Create an account to leave a comment. Already have an account? Log In.