 Michel Kuenemann
Production review between mid March 2014 and mid July 2015 (16 months)
Solar production: 4075 KWh
Grid consumption: 1954 KWh
Autonomy ratio = 4075 / (4075 + 1954) = 68 %
This is less than my target of 80 % of autonomy.
Analysis:
The system had several failures during the first year. These failures had an adverse effect on the production. Nevertheless the autonomy figure is not so bad. My goal is to reach at least 75 % during the next year (July 2015 to July 2016).
Improvements:
- Avoid failures and minimize PV system down time ;-)
- Value the electrical power surpluses thanks to Photovoltaic hot water production
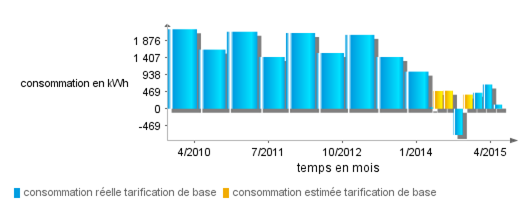
The following chart, captured on my Electricity provider's website shows a strange "negative consumption", due to over estimated consumptions (yellow bars) :
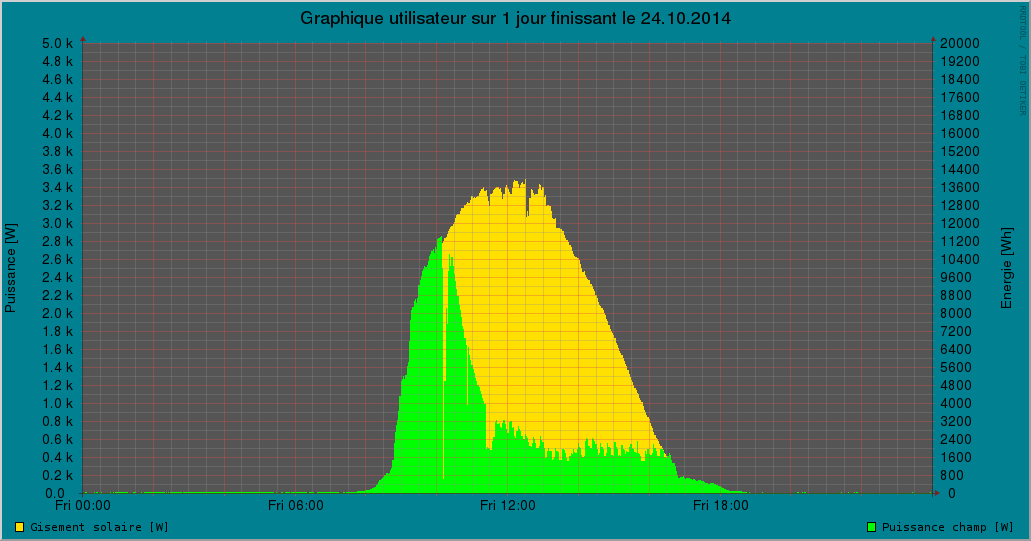
Autumn Sun
Yesterday ( October 25), the weather was fine. The system produced 7500 Wh (green area) while the available power (yellow surface behind the green area) was at least of 22 000 Wh.
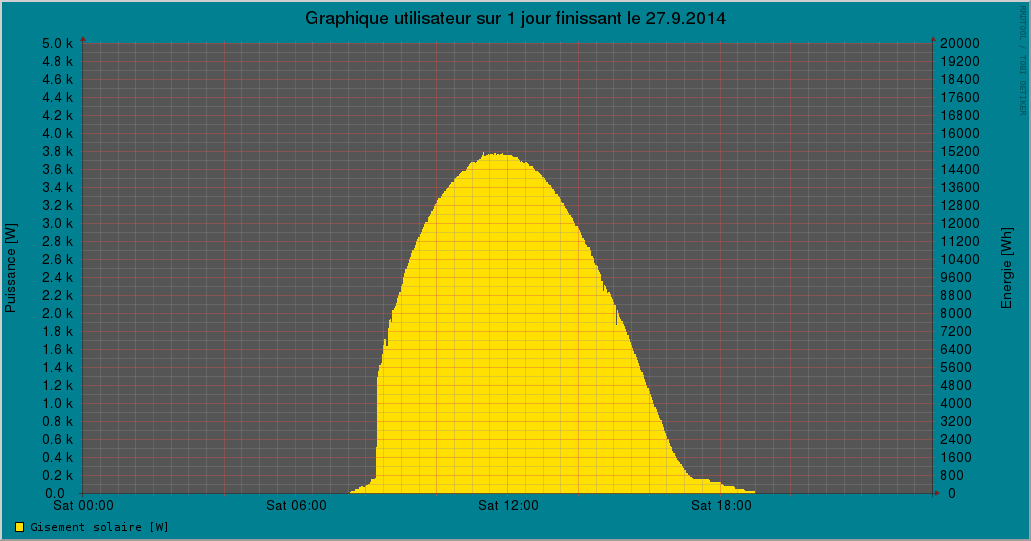
Natural Perfection
The envelope of the yellow area depicts exactly the path of the sun in the sky. On the left side of the curve the abrupt start is due to buildings creating a mask towards the East. The trailing part on the right side is due to a light colored building reflecting light towards my roof in the evening. At noon, the available power was close to 3800 Watts.
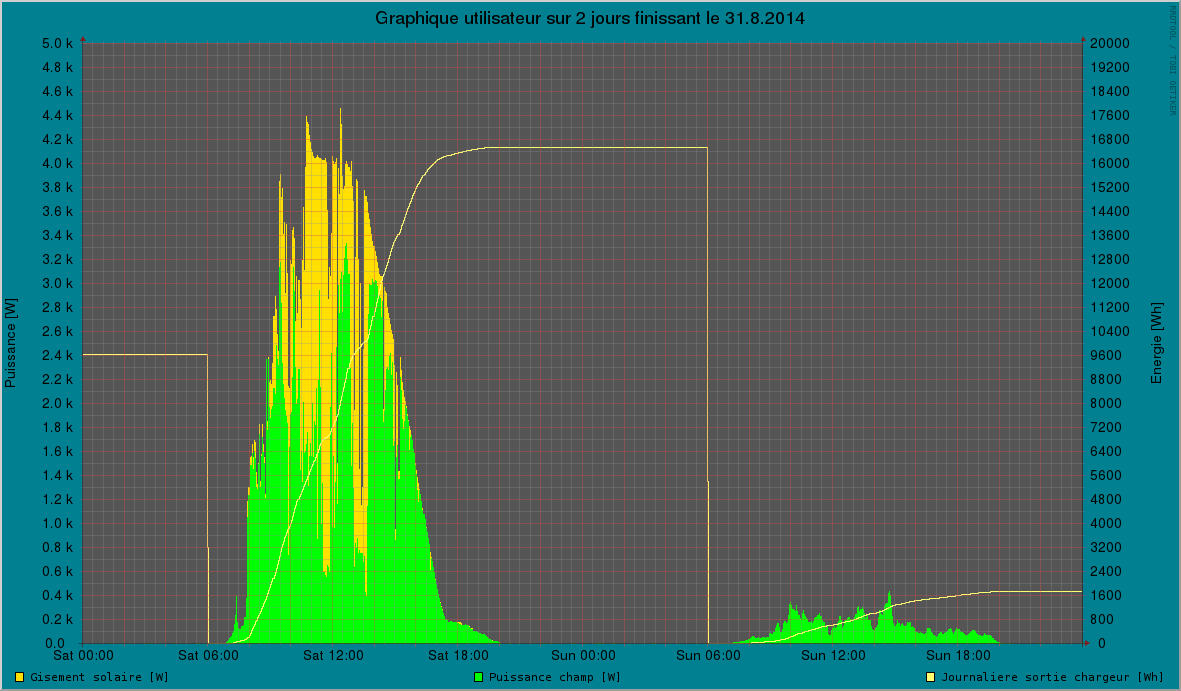
The best day and the worst day
This screenshot shows the productions of the of best and the worst day of the year until the 31st August.
On Saturday, 30th August, MyPV system produced more than 16 KWh (top of the highest yellow line in the middle of the chart).
On Sunday, 31st August, MyPV system produced about 1.6 KWh (top of lowest the yellow line on the bottom right).
To be autonomous, I need at least 10 KWh of solar energy each day.
The yellow/green areas show the sun's power evolution during these 2 days.
This illustrates the intermittent aspect of the photo voltaic production.
Production by end of August 2014
This morning (1st September) , the counters indicate a production of 2010 KWh. This figure is in line with my forecast.
Production review between March and mid August 2014
MyPV Electricity production has really started by the end of January 2014.
Between March, 17th 2014 and August, 18th 2014, the counters indicate following figures :
Solar production: 1471 KWh
Grid consumption: 214 KWh
Total consumption: 1685 KWh
Average monthly consumption: 1685/5 = 337 KWh
Average daily consumption: 1685/154 = 11 KWh
Autonomy ratio: 1471/1685 = 87 %
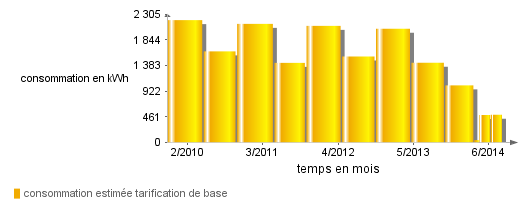
The following chart, captured on my Electricity provider's website shows a dramatic decrease of Grid electricity consumption :
NOTE: the last column is an estimated figure - The real figure is far less than displayed.
Discussions
Become a Hackaday.io Member
Create an account to leave a comment. Already have an account? Log In.