 Kris Winer
July 5, 2017
Here I describe the first practical test of the Asset Tracker after simply verifying that all of the components (except the ESP8285) work as expected and that pressure, temperature, altitude, latitude, longitude, and yaw, pitch and roll data are properly available to the host and can be written to the 16 MByte SPI NOR flash.
The flash has 65,536 pages that hold 256 bytes each. I constructed a data packet of 32 bytes such that I can write 8 segments of 32-byte data per page. The 32-bytes is enough for most (but not all) of the interesting information. In this first test, I sacrificed pitch and roll to stay within the 32-byte segment limit. I also chose to write data to the flash every ten seconds. At this rate, the flash can store 90 days worth of data!
In this first test, the questions I want to answer are simply 1) can I get data logged to the flash and 2) can I meaningfully interpret the data?
I had previously tested the battery life using a 350 mAH 1S LiPo battery and found even with the ESP8285 disabled (there is an STM32L433 GPIO connected to the ESP8285 enable pin so it should be completely disabled unless I specifically enable it in the code, which I did not so far), the CAM M8Q in periodic mode with a 5/60 duty cycle (seeking a fix for 5 seconds every 60 seconds, in sleep mode otherwise), and the STM32L433 in STOP mode unless servicing quaternion updates from the EM7180 at 10 Hz I could only get about seven hours of life, or an average current usage of ~50 mA.
The CAM M8Q uses ~25 mA when active so should use ~3 - 4 mA on average in periodic mode. The STM32L433 uses << 20 uA in STOP mode and I chose to set the CPU clock to 4 MHz which similarly saves on power even when the STM32L433 is woken by interrupts and placed back into run mode. The ESP8285 should draw very little power, but I need to verify this. The EM7180 + MPU9250 + MS5637 should require ~10 mA according to separate tests so I am somewhat at a loss to understand how the average power could be anywhere close to 50 mA. This seems much too high to me and I suspect there is something wrong with the battery, like it is only taking a partial charge due to age. Still, six or seven hours is long enough for the first test and I took advantage of the fact that my daughter was heading out the door to go watch fireworks to ask her to drop the asset tracker, placed in a plastic bag inside a mailing envelope with a partial battery charge on her dashboard for the evening...
The following day I retreived it from her and was pleasantly surprised to find lots of data on the flash. Here is some of what I found:
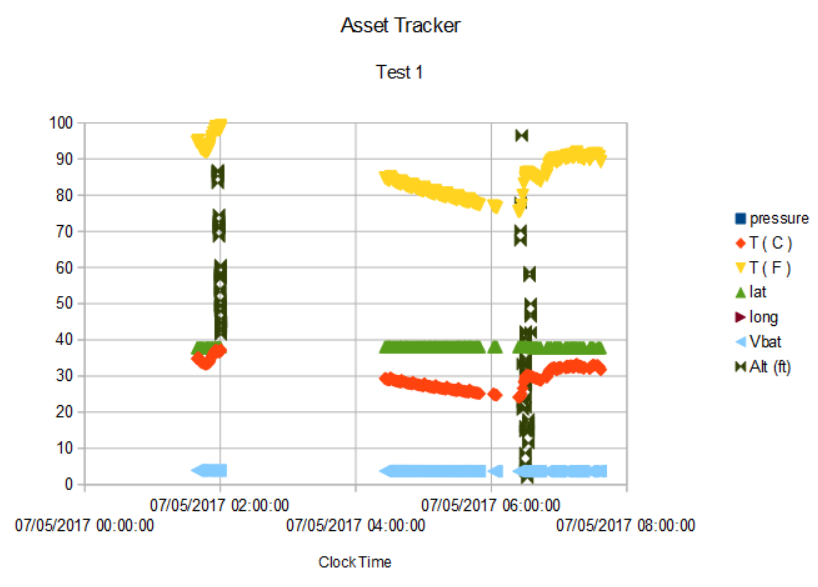
There is just over six hours of data but there is a curious two-hour gap, so really only four hours of data. It looks like the data stopped as the temperature rose above 100 F. The daughter reports she had to park the car away from its usual spot and that it was exposed to the setting sun so this could be a case of overheating, although all of the electronics are rated to at least 85 C (max temp shown is ~40 C) so this explanation seems suspect. In any case, the device recovered as the temperature dropped. Perhaps the GPS signal simply skipped two hours, I don't know what to make of this gap. Turns out the Air Force is monkeying with GPS the entire month of July and the gap could be a result.
Looking at the pressure:
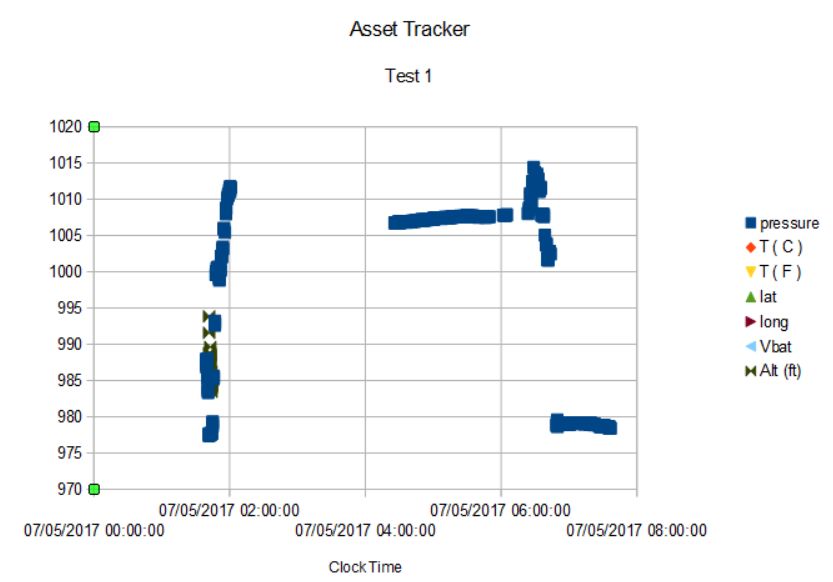
it is clear that the pressure at first increases as the car descends from the 1050 foot elevation of our house to the relatively lower levels (~300 feet) of the 680 freeway, then spikes as the car crosses the Benicia bridge both at the 02:00:00 and 06:30:00 marks. The bridge is just ~100 feet above sea level. All during the experiment the pressure is slowly but steadily rising. Upon return home, the pressure is higher by a few mbar.
Perhaps surprising compared to the absolute positioning afforded by GPS and absolute orientation afforded by the EM7180 (which data I have not yet analyzed for this experiment), lowly pressure data holds a lot of information about the Asset Tracker's movement.
Of course, this pressure data would be much more difficult to understand without the GPS position data:
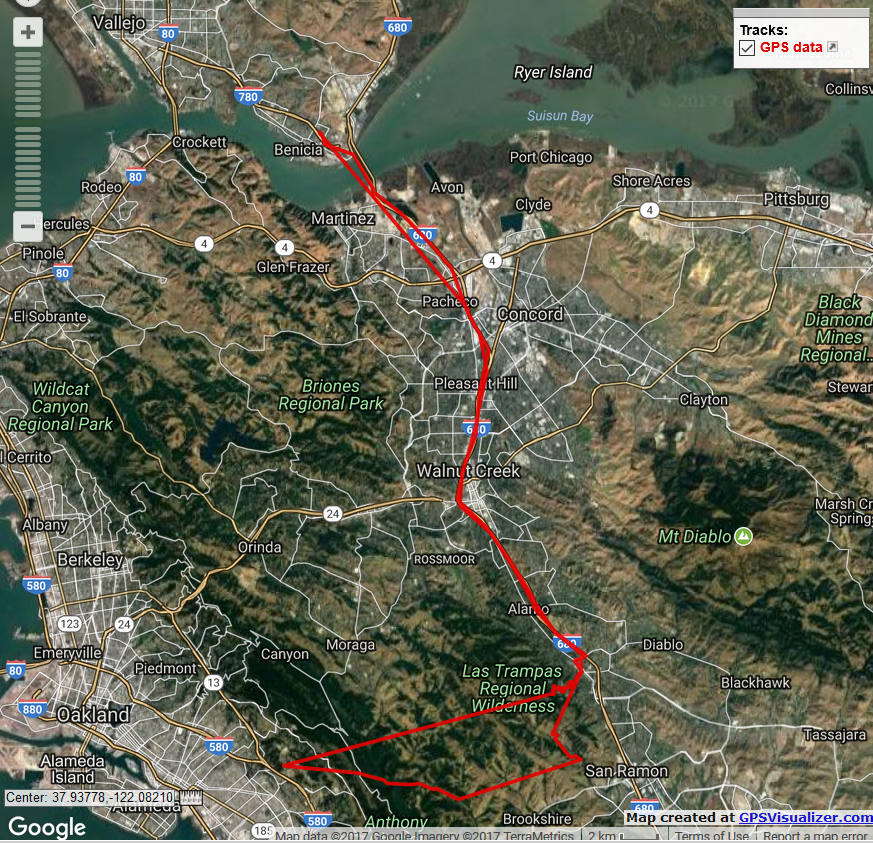
This map was fantastically easy to generate by simply cutting and pasting the latitude and longitude data from the spreadsheet, itself taken from cutting and pasting from the Arduino IDE serial monitor and clicking "map" on the www.GPSvisualizer.com site.
Except for the odd cross-country excursion to Oakland (which is an artifact, of what I don't know but I assure you our car cannot fly!) the position trajectory is just what I expect moving from our house just right of the "l" in "Las Trampas Regional" across the bridge to Benecia and back.
So I would call this a mild success, data collected, some meaningful interpretation possible, and the promise of a practical asset tracker looks bright. There is still plenty to do.
The six hours of the battery lifetime is way out of balance wrt the 90 day SPI flash capacity, and I haven't even started to make use of the wifi yet. Job #1 is to try to get the average power usage down. Still, even six hours (or twelve hours if I were to use a common 750 mAH battery of which I have plenty) is long enough to get some useful trajectory information.
Then there are the interesting applications, like tracking your cat. Where does your cat go at night? Now you can find out...
Discussions
Become a Hackaday.io Member
Create an account to leave a comment. Already have an account? Log In.