Most of our focus has been on the Zig-4 lately but I finally found some time to play around with one of the Zig-8 (24 bit, 8 channel) prototypes to do some noise floor and short-term drift test. There is still a lot of work that needs to be done, but the results where still worth posting. Remember this is a Prototype!
The setup of the test was basically take three pretty good voltage references, put them on the bench and monitor them along with a temperature sensor and a silver oxide battery (one of the original voltage references) for 10 hours once a second. Not overly scientific but educational nonetheless.
Below is a plot of the three Vref's. This is a 1 hour section after about 6 hours of warmup (you can see the time stamp at the top). Even though a sample was taken every second there is a little aliasing going on with the way the software displays all the data so you don't actually see every point (sorry).
![]()
The scale on the left is in µV and all the plots have been zeroed out for easy comparison. So what do we see? Well we are basically looking at the combined noise and drift of the SiGZiG Zig-8 prototype with the noise and drift of the 3 voltage references. And it looks like, at least over 1 hour, that the combined noise and drift stays pretty much within +/- 1µV
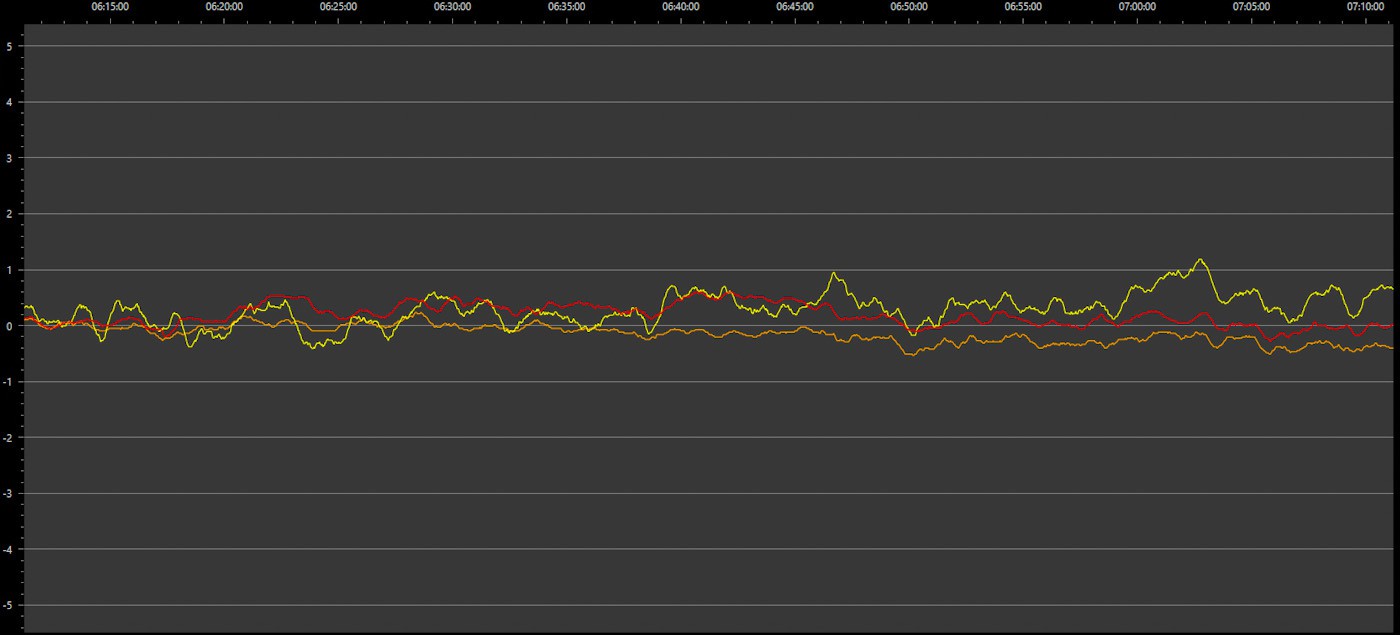
. So what part of the noise is from the Zig-8 prototype and what belongs to the voltage references?... well the short answer would be that generally any signal common to all the readings is from the SiGZiG. That being said there are other things in common, like temperature (for good or bad).Lets do some averaging to see if we can better pick out the common signal.
![]()
The above data has been smoothed with a running average of 10 samples. You can kind of make out parts that are in common to all three plots.
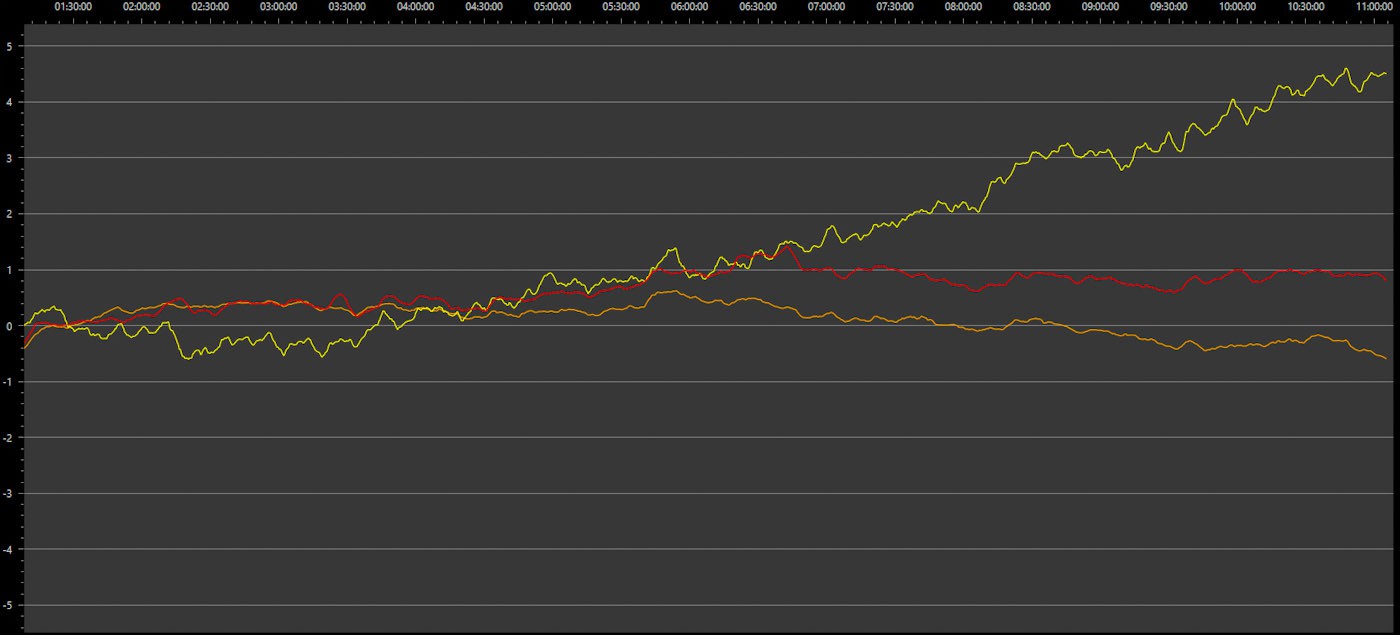
Okay, this 60 min chunk is getting boring, lets look at the whole thing.
![]()
As you can see not all voltage references are created equal. Now if you look at the yellow plot the real question is which voltage reference is drifting, the one being measured or the one in the Zig-8? Well if I was only measuring the yellow one it would be pretty hard to say, hopefully now you can see the wisdom in measuring more than just one supposedly great voltage reference. By monitoring more than one it becomes a statistics game and in this case the yellow one is the odd one out.
![]()
Applying averaging again and you can start to make out the commonality between signals. However looking at what is common is still not a perfect method for recreating the noise and drift signature of the SiGZiG because there are slight variations between each channel as well as the fact that each channel is not sampled at exactly the same moment in time. Overall though it still gives a much clear picture than just monitoring a single voltage source when down at these small levels.
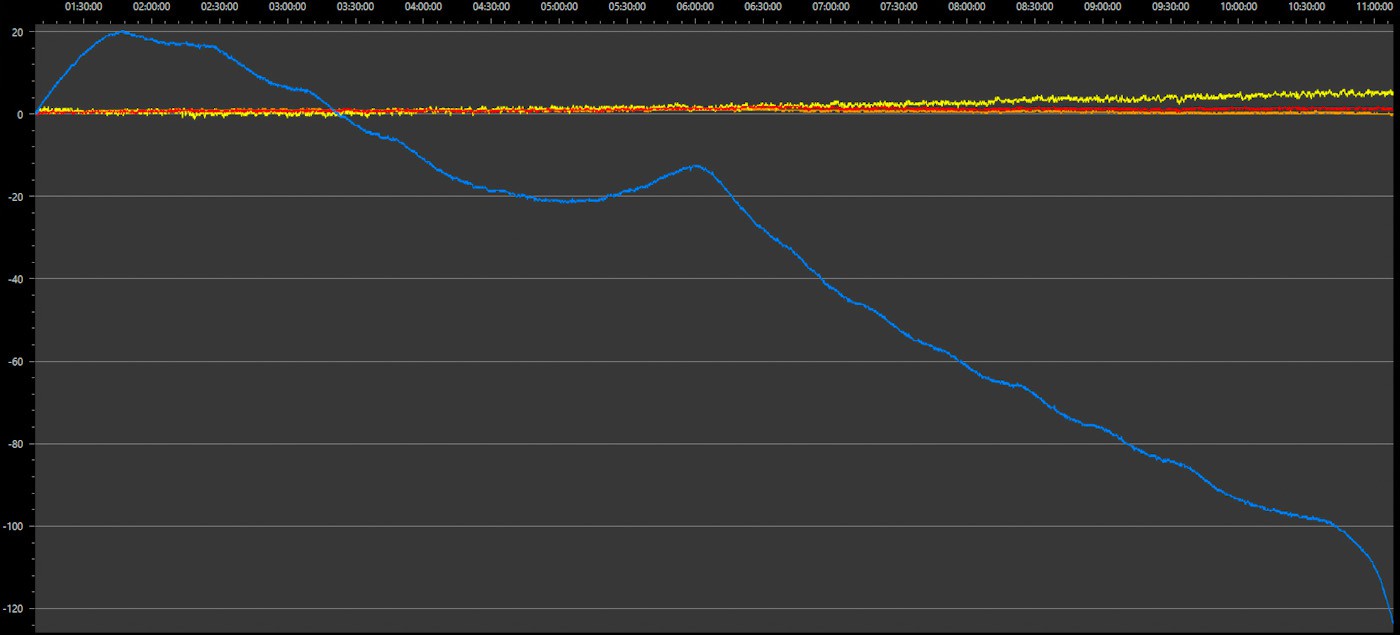
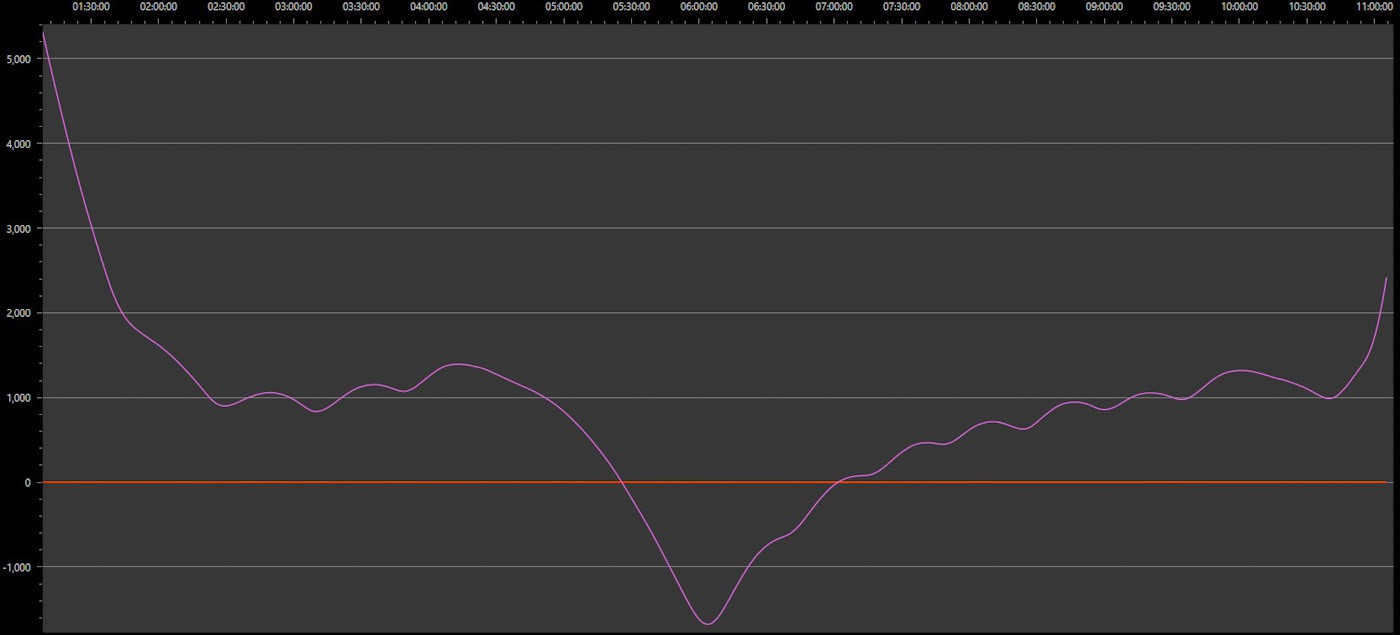
So how did the silver oxide battery compare?
![]()
Actually not that bad, we are talking 140µV of drift over 10 hours. Even so it definitely puts the others in perspective.
And what about temperature?
![]()
I noticed some of the changes in temperature seemed to match up with variations in the voltage of the silver oxide battery.
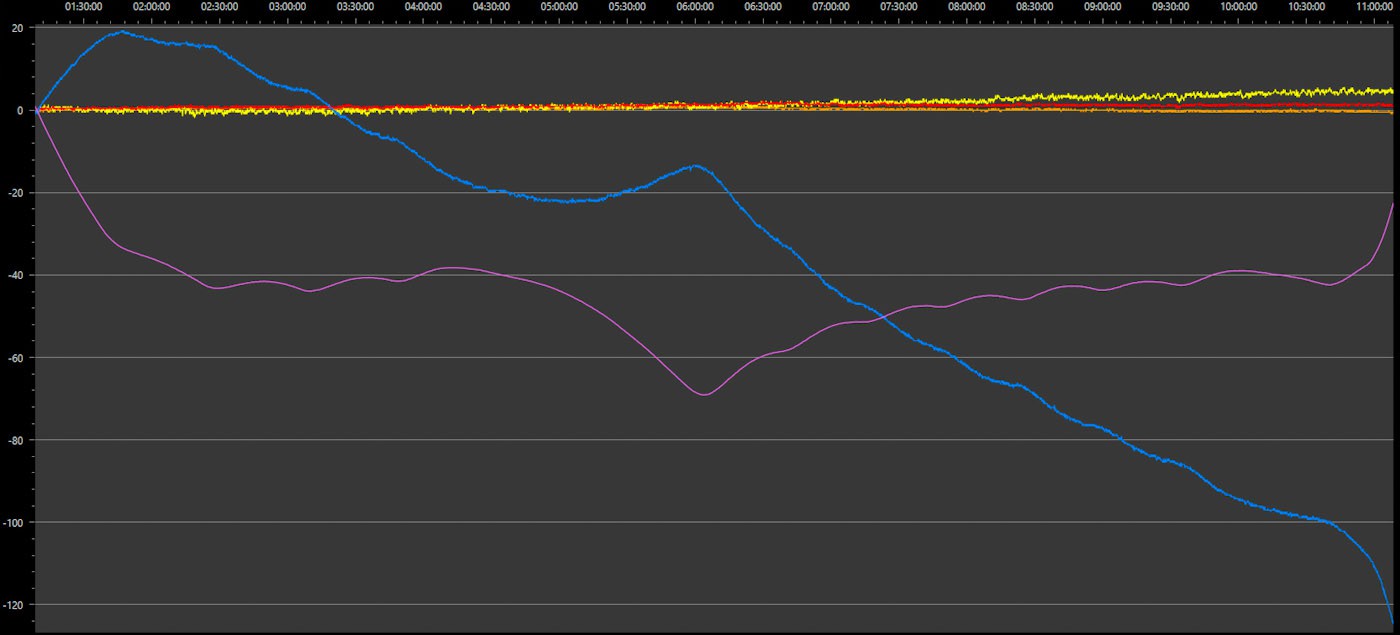
After scaling and overlaying you get this
![]() If you had a good enough data logger you could almost use a silver oxide battery as a temperature sensor!... okay no you couldn't but you can obviously see it is affected by temperature.
If you had a good enough data logger you could almost use a silver oxide battery as a temperature sensor!... okay no you couldn't but you can obviously see it is affected by temperature.
 Sigzig
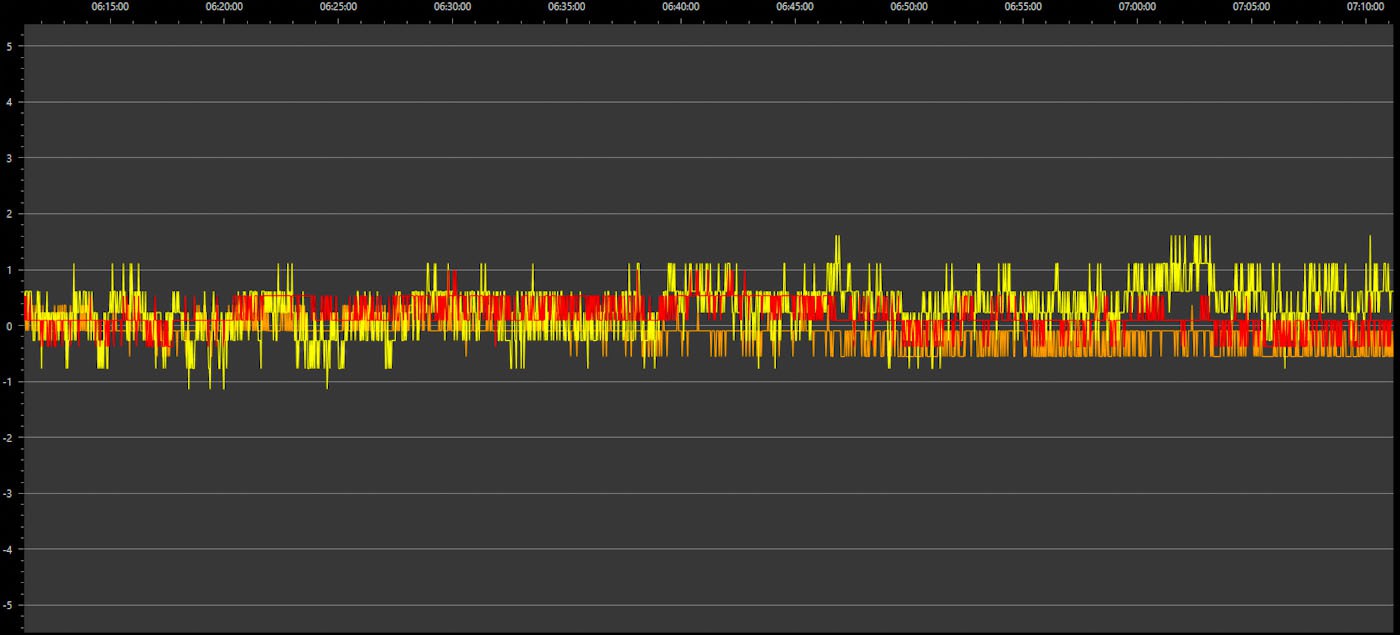

 If you had a good enough data logger you could almost use a silver oxide battery as a temperature sensor!... okay no you couldn't but you can obviously see it is affected by temperature.
Discussions
Become a Hackaday.io Member
Create an account to leave a comment. Already have an account? Log In.