 Reinier van der Lee
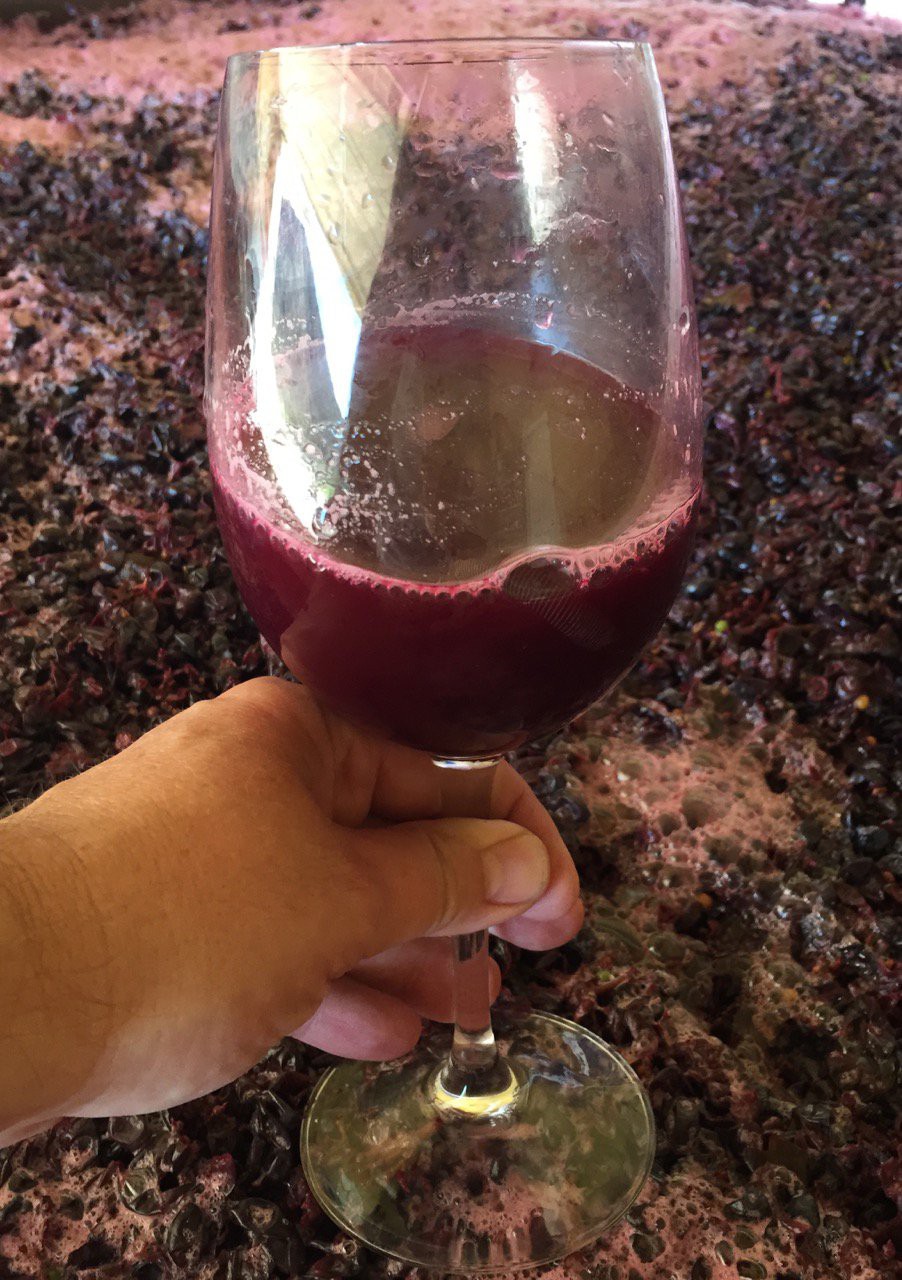
We harvested our wine grapes on September 2, and in the weeks leading up to harvest I did not want change the irrigation schedule. The wine was pressed after one week of fermentation and transferred to barrels this weekend.
We started actively managing irrigation and collecting project data in May, so this is a good moment to evaluate results.
Estimated water use per vine versus actual use
Using local weather station evapotranspiration (ET0) data, you can estimate the daily water use of a plant.
Larry Williams of UC Davis, published details on how to use your local weather station ET0 data to estimate water use of a grape vine. This summer, at temperatures reaching well over 100F, one single wine grape vine can "drink" 4 gallons of water on a single day.
Of course, this is an estimate based on many assumptions, so -while trying to keep soil moisture constant- we found that we got very close to the calculated estimate.

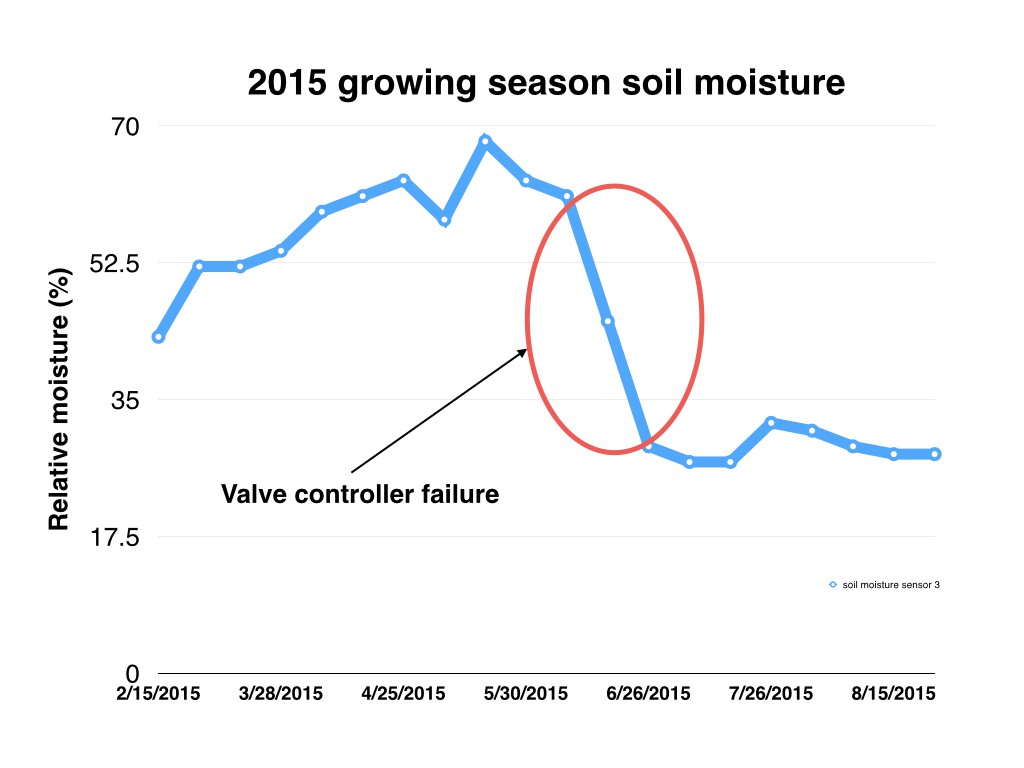
Seasonal soil moisture levels
Late Spring we noticed a fast drop in soil moisture at vineyard irrigation block 2. It turned out that the controller/timer that diverse water to block 2 had an empty battery. After replacing the battery for a fresh one, the next week we had the same problem. The timer was replaced the week after, but by that time the vines had used a considerable part of the available soil water reserve.
We decided to not replenish the lost water, but instead provided replacement for the daily vine water use. As the graph shows below, we kept the soil moisture constant by doing so.
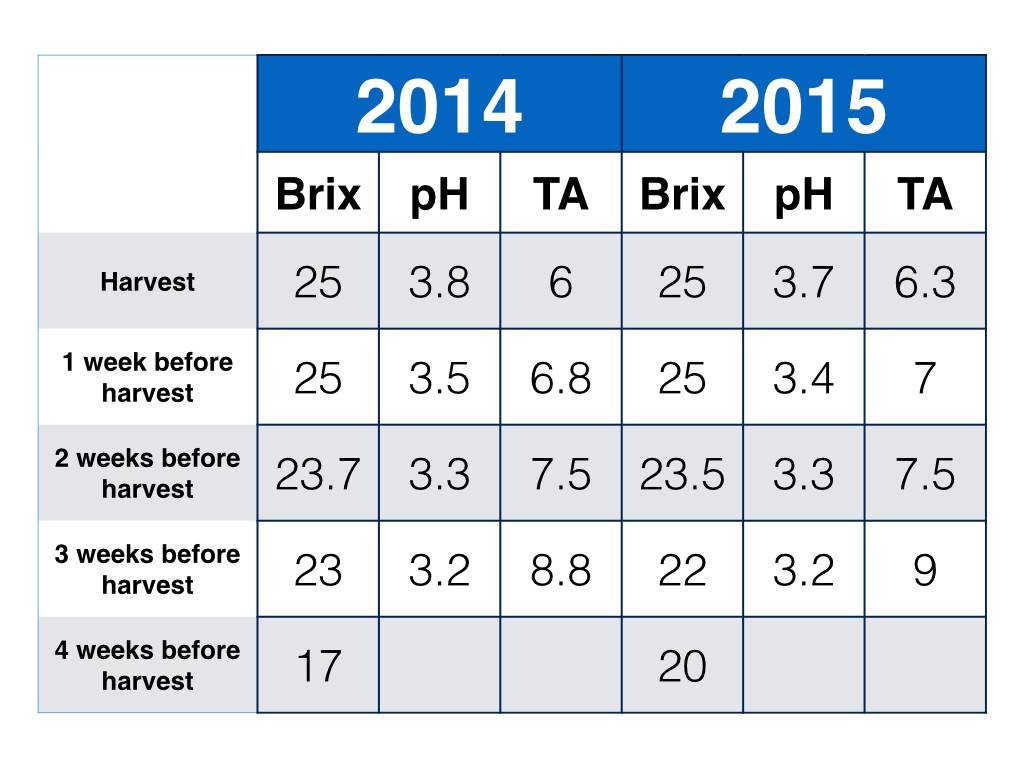
Grape quality 2015 compared to 2014
In the weeks leading up to harvest, grape growers and winemakers collect grape samples to determine ripeness and best time to harvest. Leading indicators used for ripeness are:
- Brix (percentage of sugar in the grapes, 25 Brix = 25% sugar)
- pH
- TA (Titratable Acidity, expressed in gram/liter)
When grapes mature, sugar levels go up, and acidity goes down.
These are the "hard numbers", additionally taste, and color of the seeds (need to be brown, not green) are important.
Below table shows the data for Brix, pH, and TA in the weeks before harvest for 2015 and 2014.
To summarize, 2015 has slightly higher acidity, but nothing that can be attributed to a different irrigation regime.
Monthly water use compared
Under professional irrigation management in 2014, deficit irrigation was practiced in the month before harvest. This means that the grape vines get much less water and this is supposed to give better quality grape material. It also means that the grapes lose water content and start to shrivel at the moment of harvest. Average weight loss is 30%, meaning less income for the grapegrower who gets paid by weight.
The jury is still out about the improved taste of wines made from grapes that have struggled. Blind panel tastings usually come out inconclusive.
For 2015, we decided to keep water flowing in July and August, but still target an overall 25% water reduction.
Due to early bloom and cold weather in the Spring, grape clusters did not fully develop this year. Not only in our vineyard, but in whole California harvest weights are 25% below last year. So we lost 25% weight and gained it back by not using deficit irrigation. We got about the same crop weight harvested as last year. I think there is insufficient data to say anything about impact of the daily irrigation on crop yield.
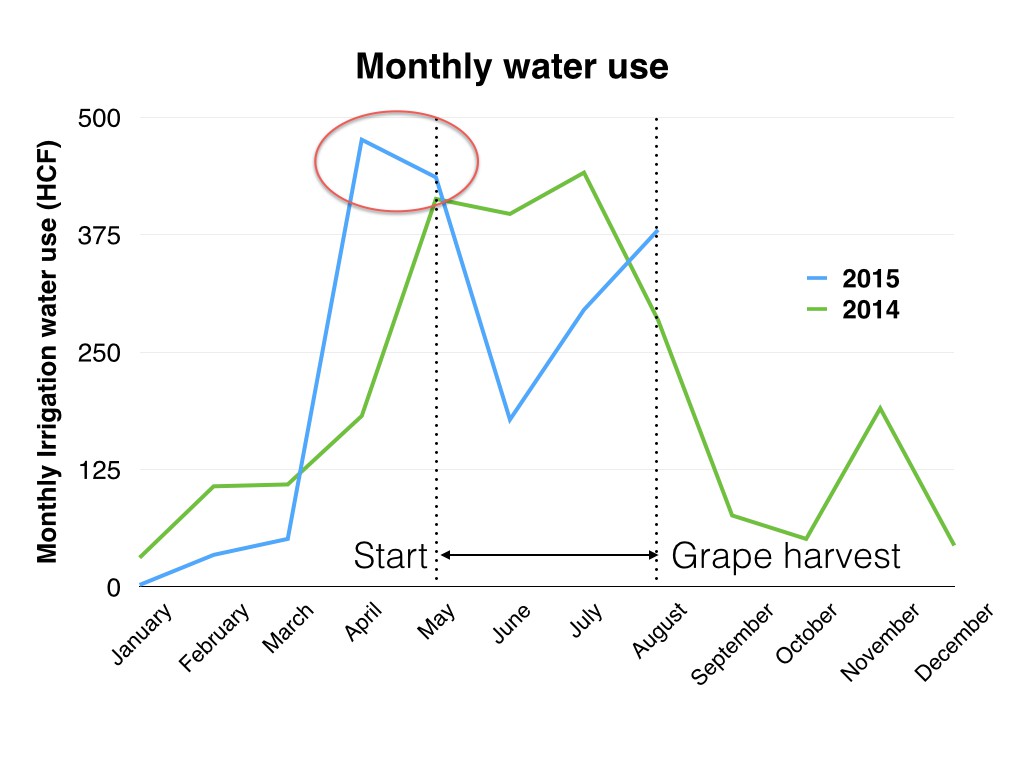
How about the goal of saving 25% irrigation water?
When we switched from outsourced (manual) irrigation to using timed valves in combination with Vinduino soil moisture sensors, we had to learn the hard way what the actual flow rate and timing of the irrigation was. Initially, at the start of the irrigation season, we overshot terribly. See graph above, April and May. Apart from the first two months, we've become pretty good at interpreting Vinduino soil moisture sensor readings, estimating daily vine water use and looking at the vine growth as indicator of plant happiness.
If you include the overshoot at the start of the season, we slightly exceed the target of using 25% less water vs last year's water use (green line in below graph)
Excluding this beginner's mistake, as shown by the yellow line, we meet the target and will be able to repeat this year's results next year.

Discussions
Become a Hackaday.io Member
Create an account to leave a comment. Already have an account? Log In.
Congratulations, that looks very promising!
Are you sure? yes | no
Hi Christoph, thanks!
Lot's of data for an irrigation project :-)
Are you sure? yes | no