 David Scholten
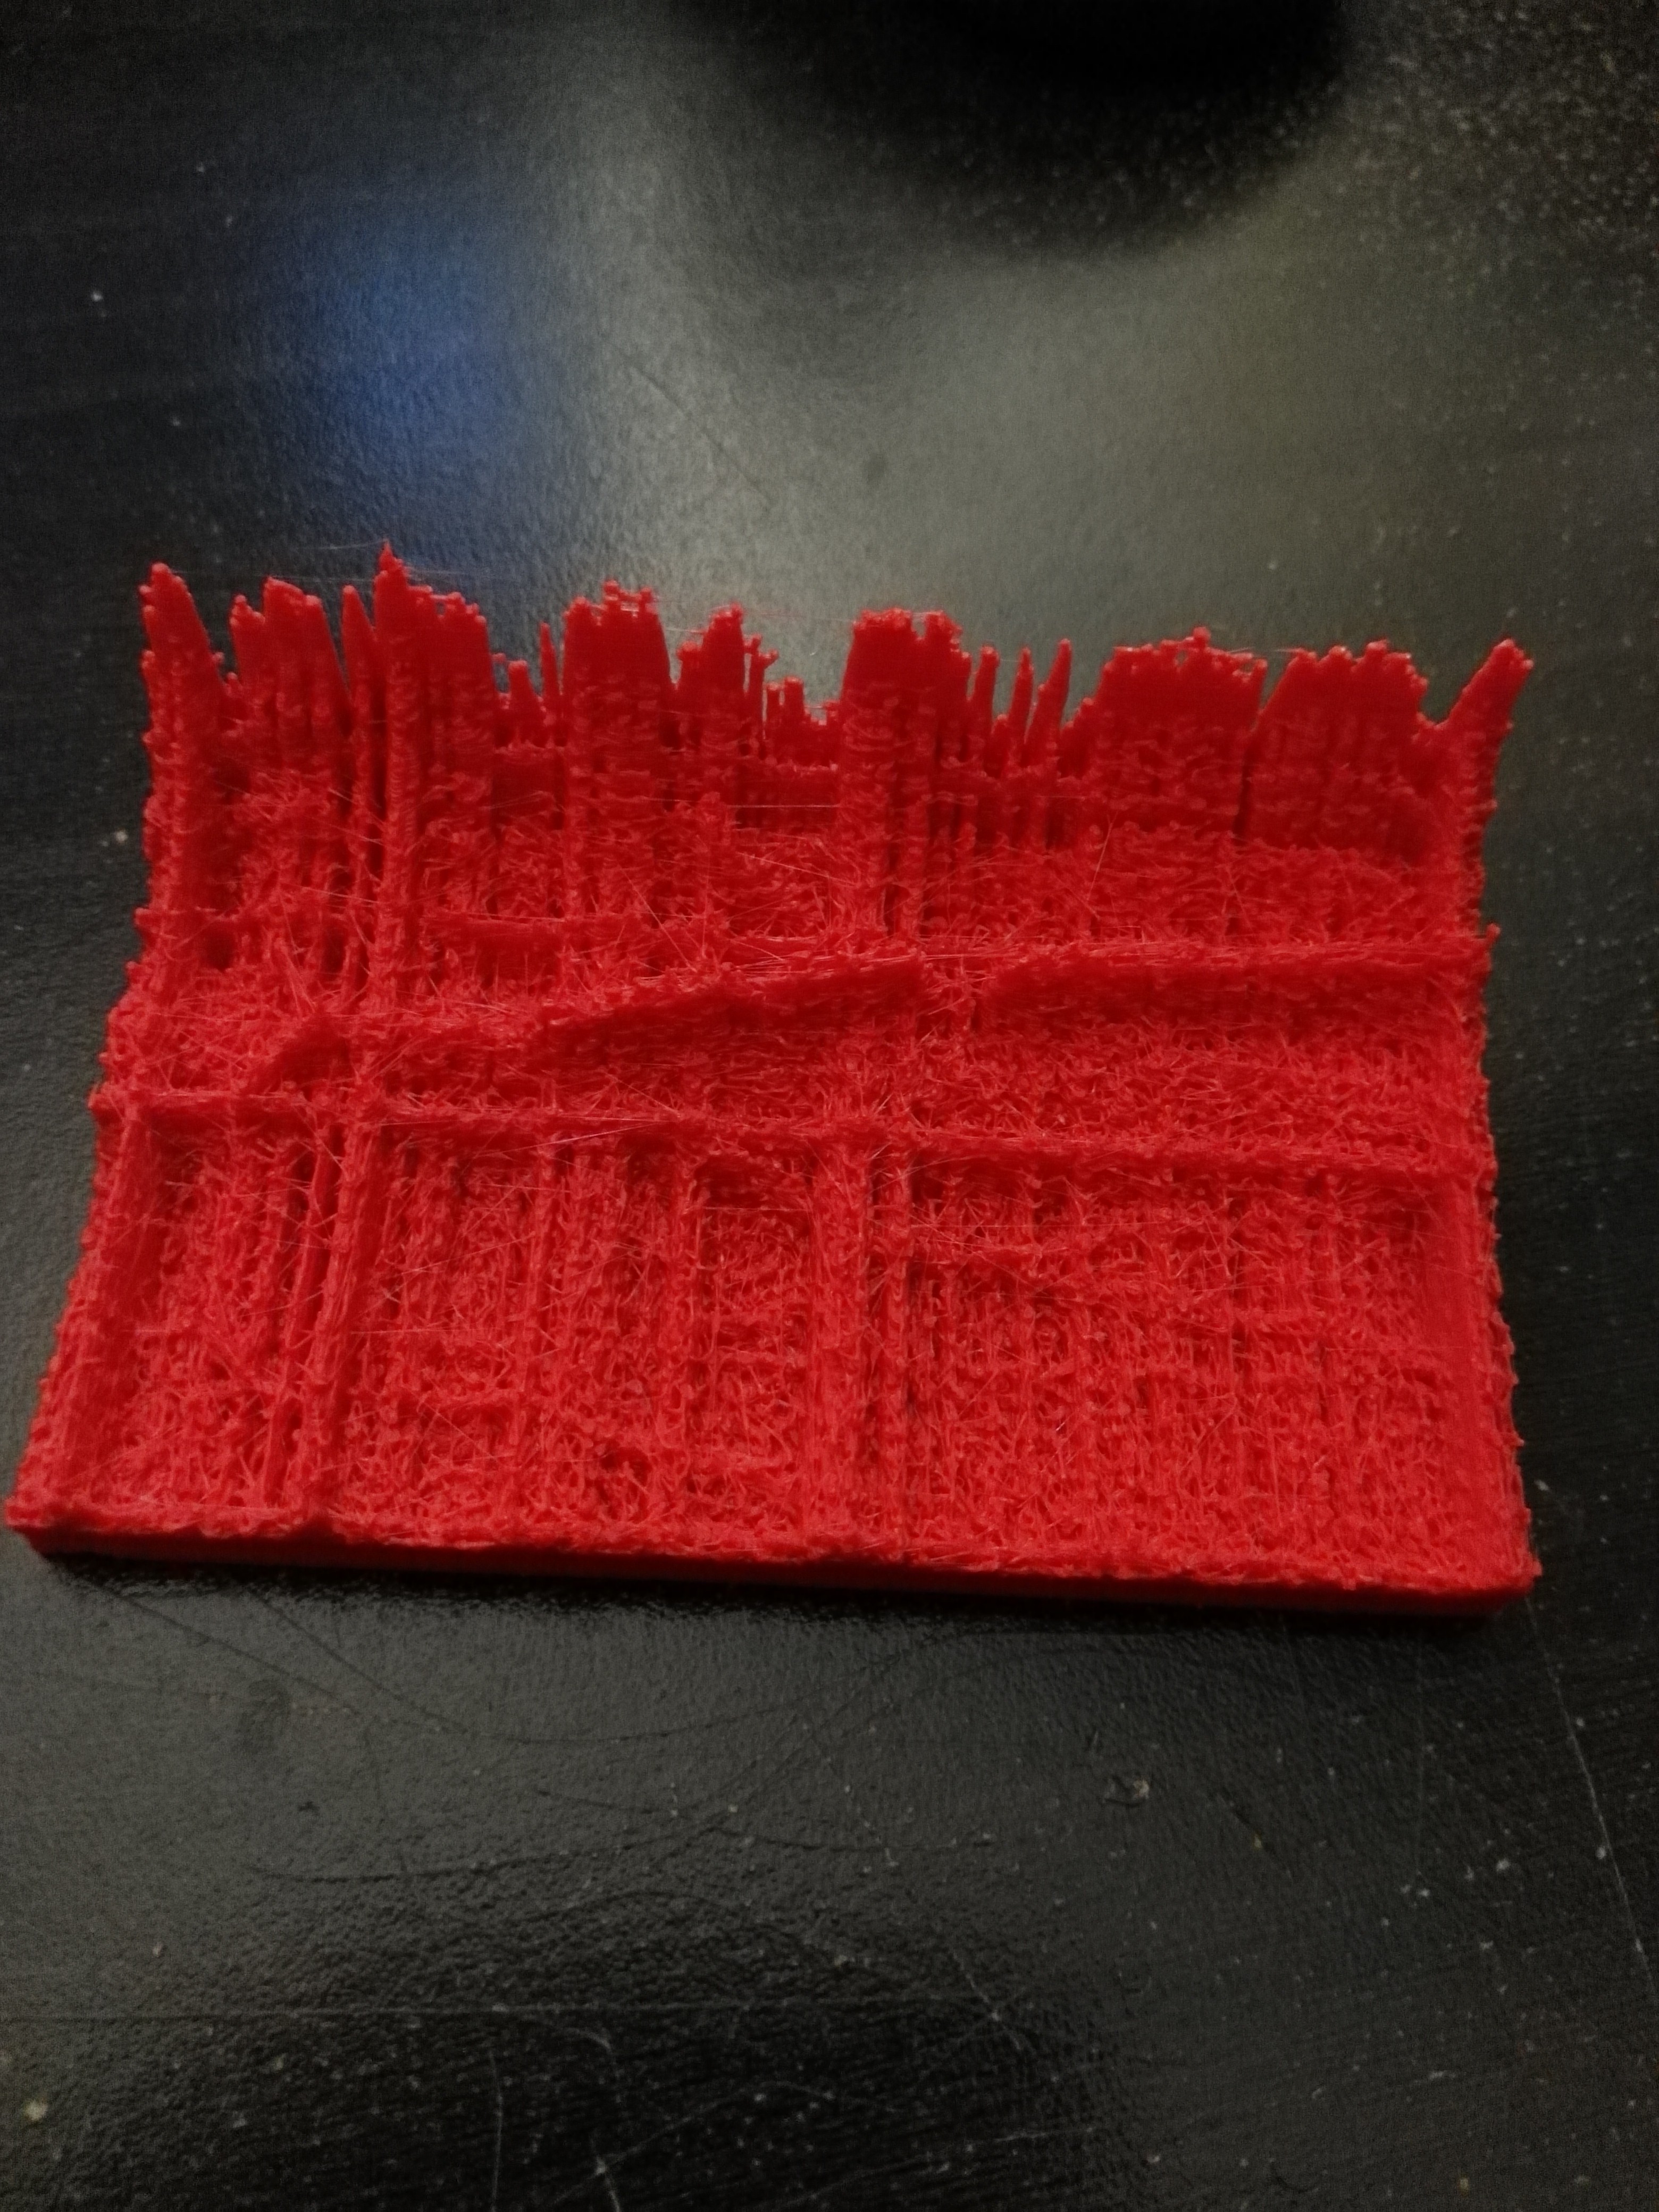
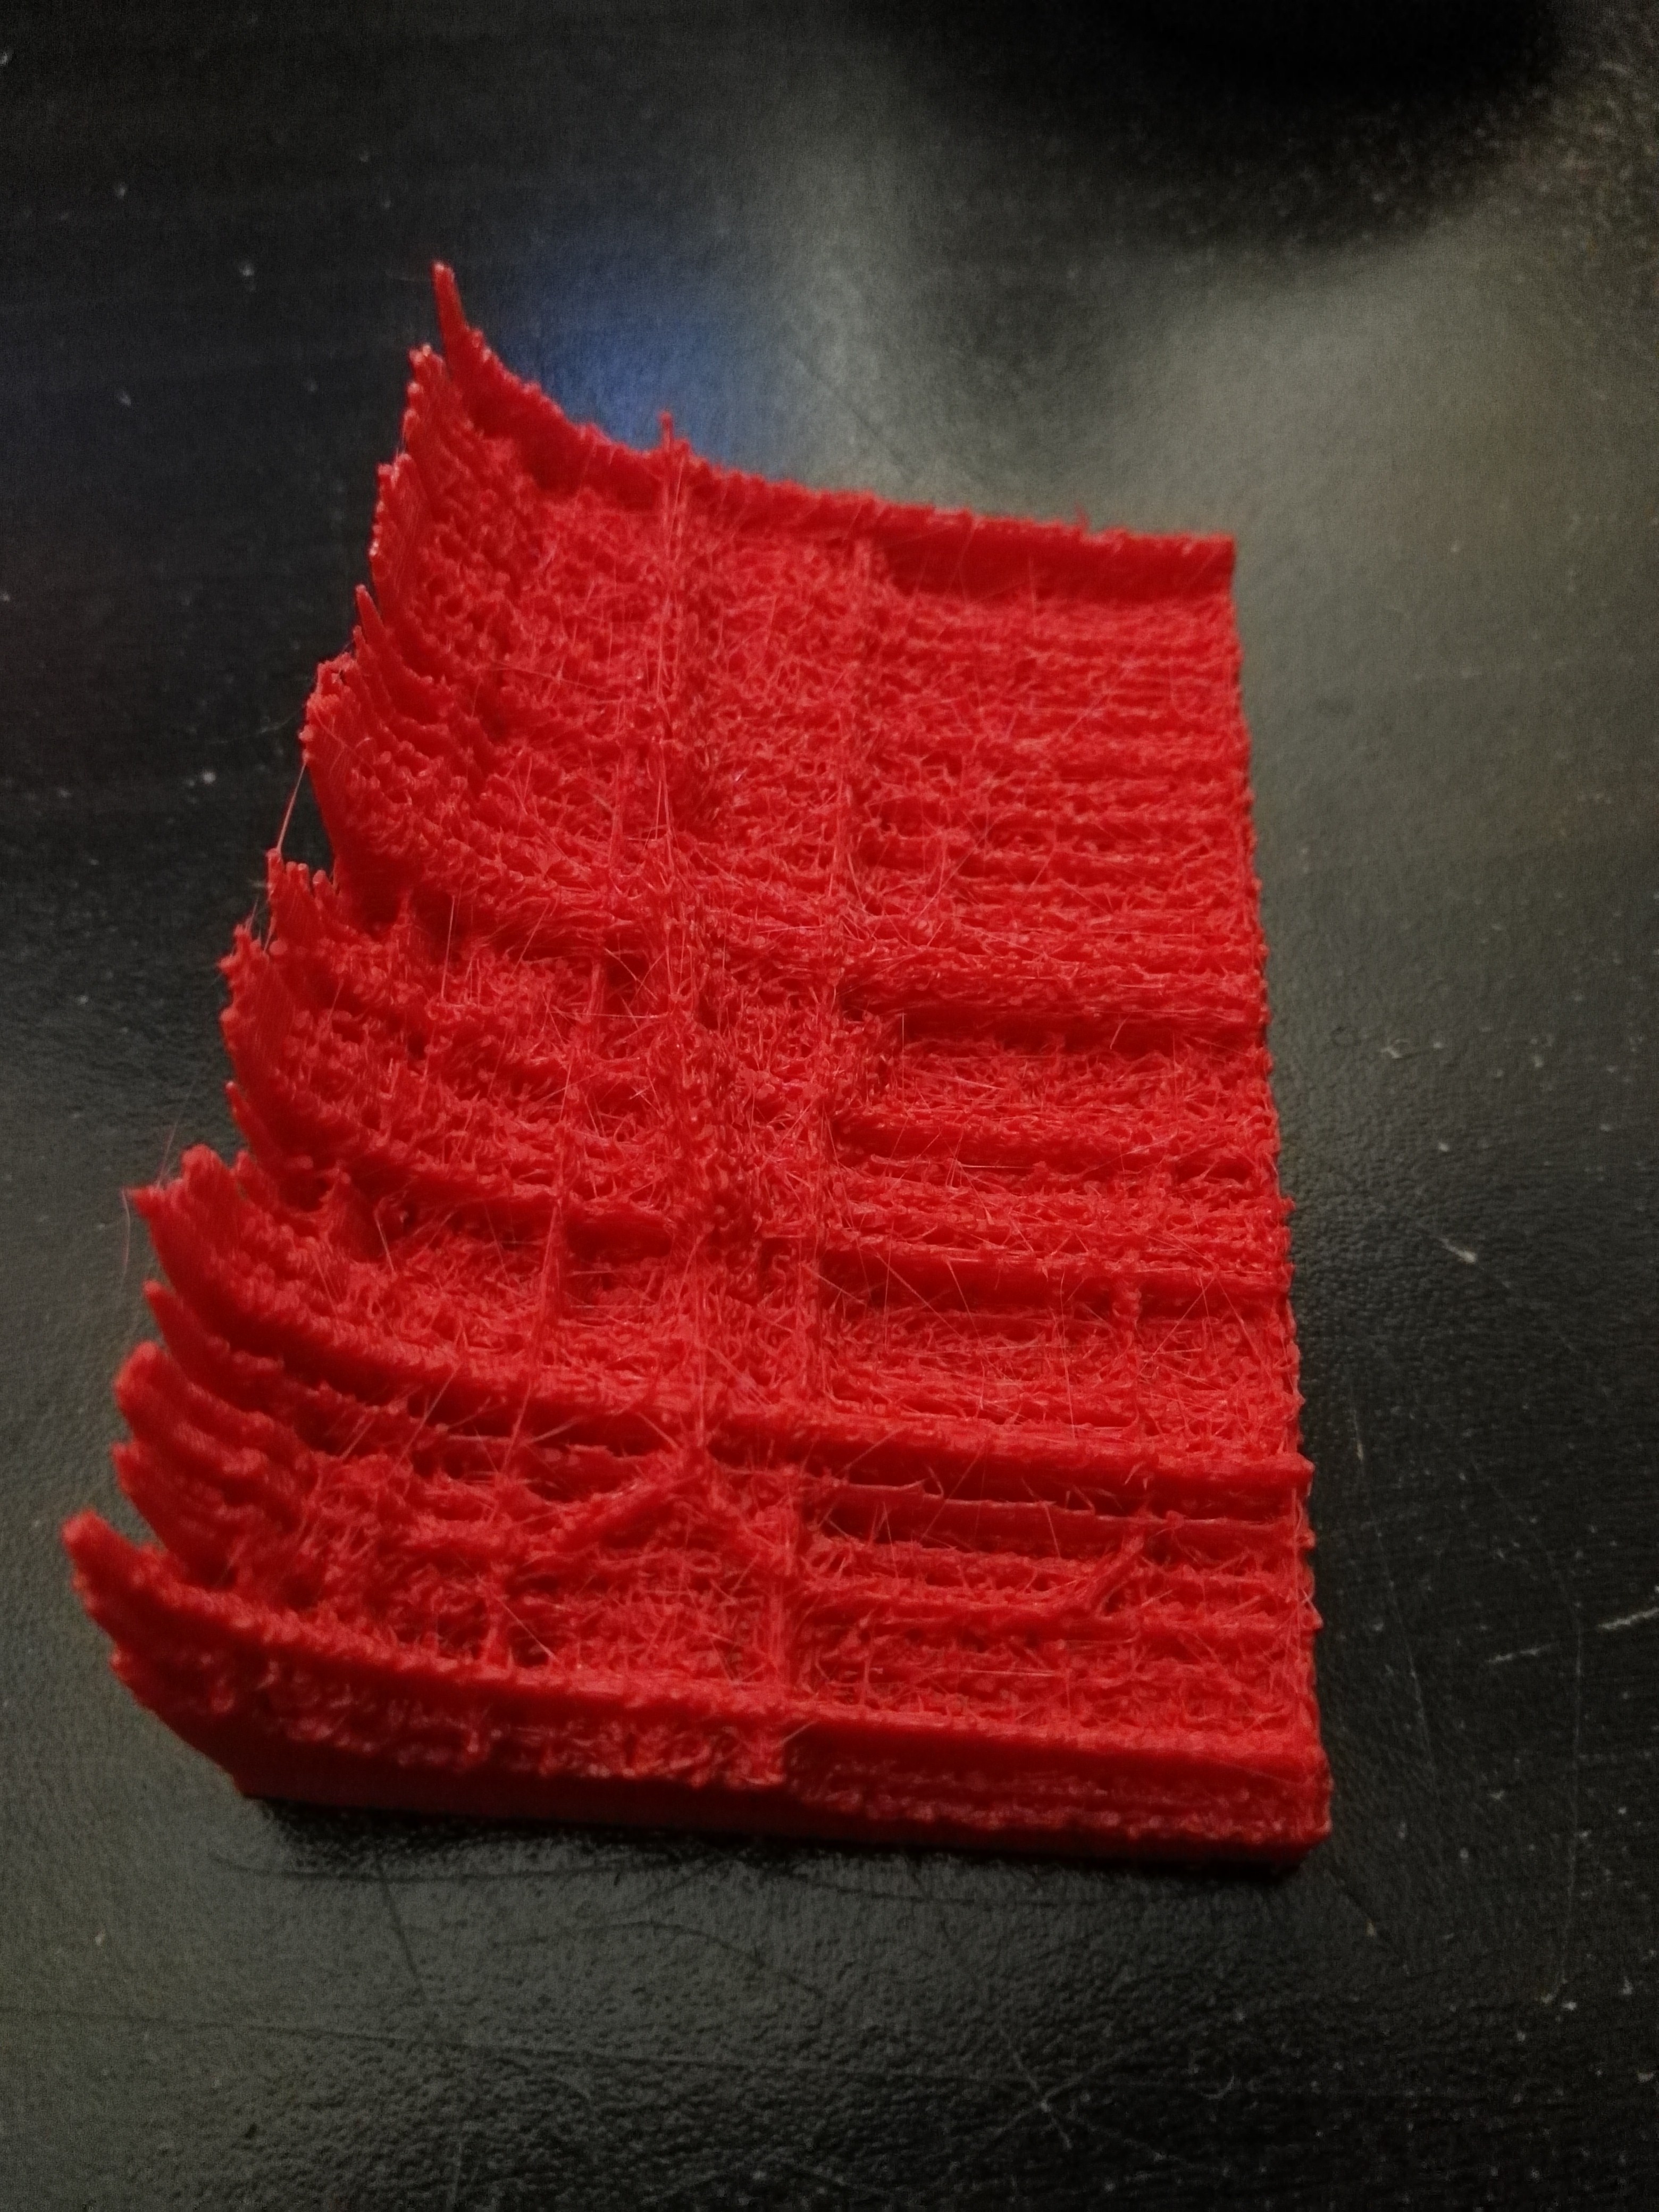
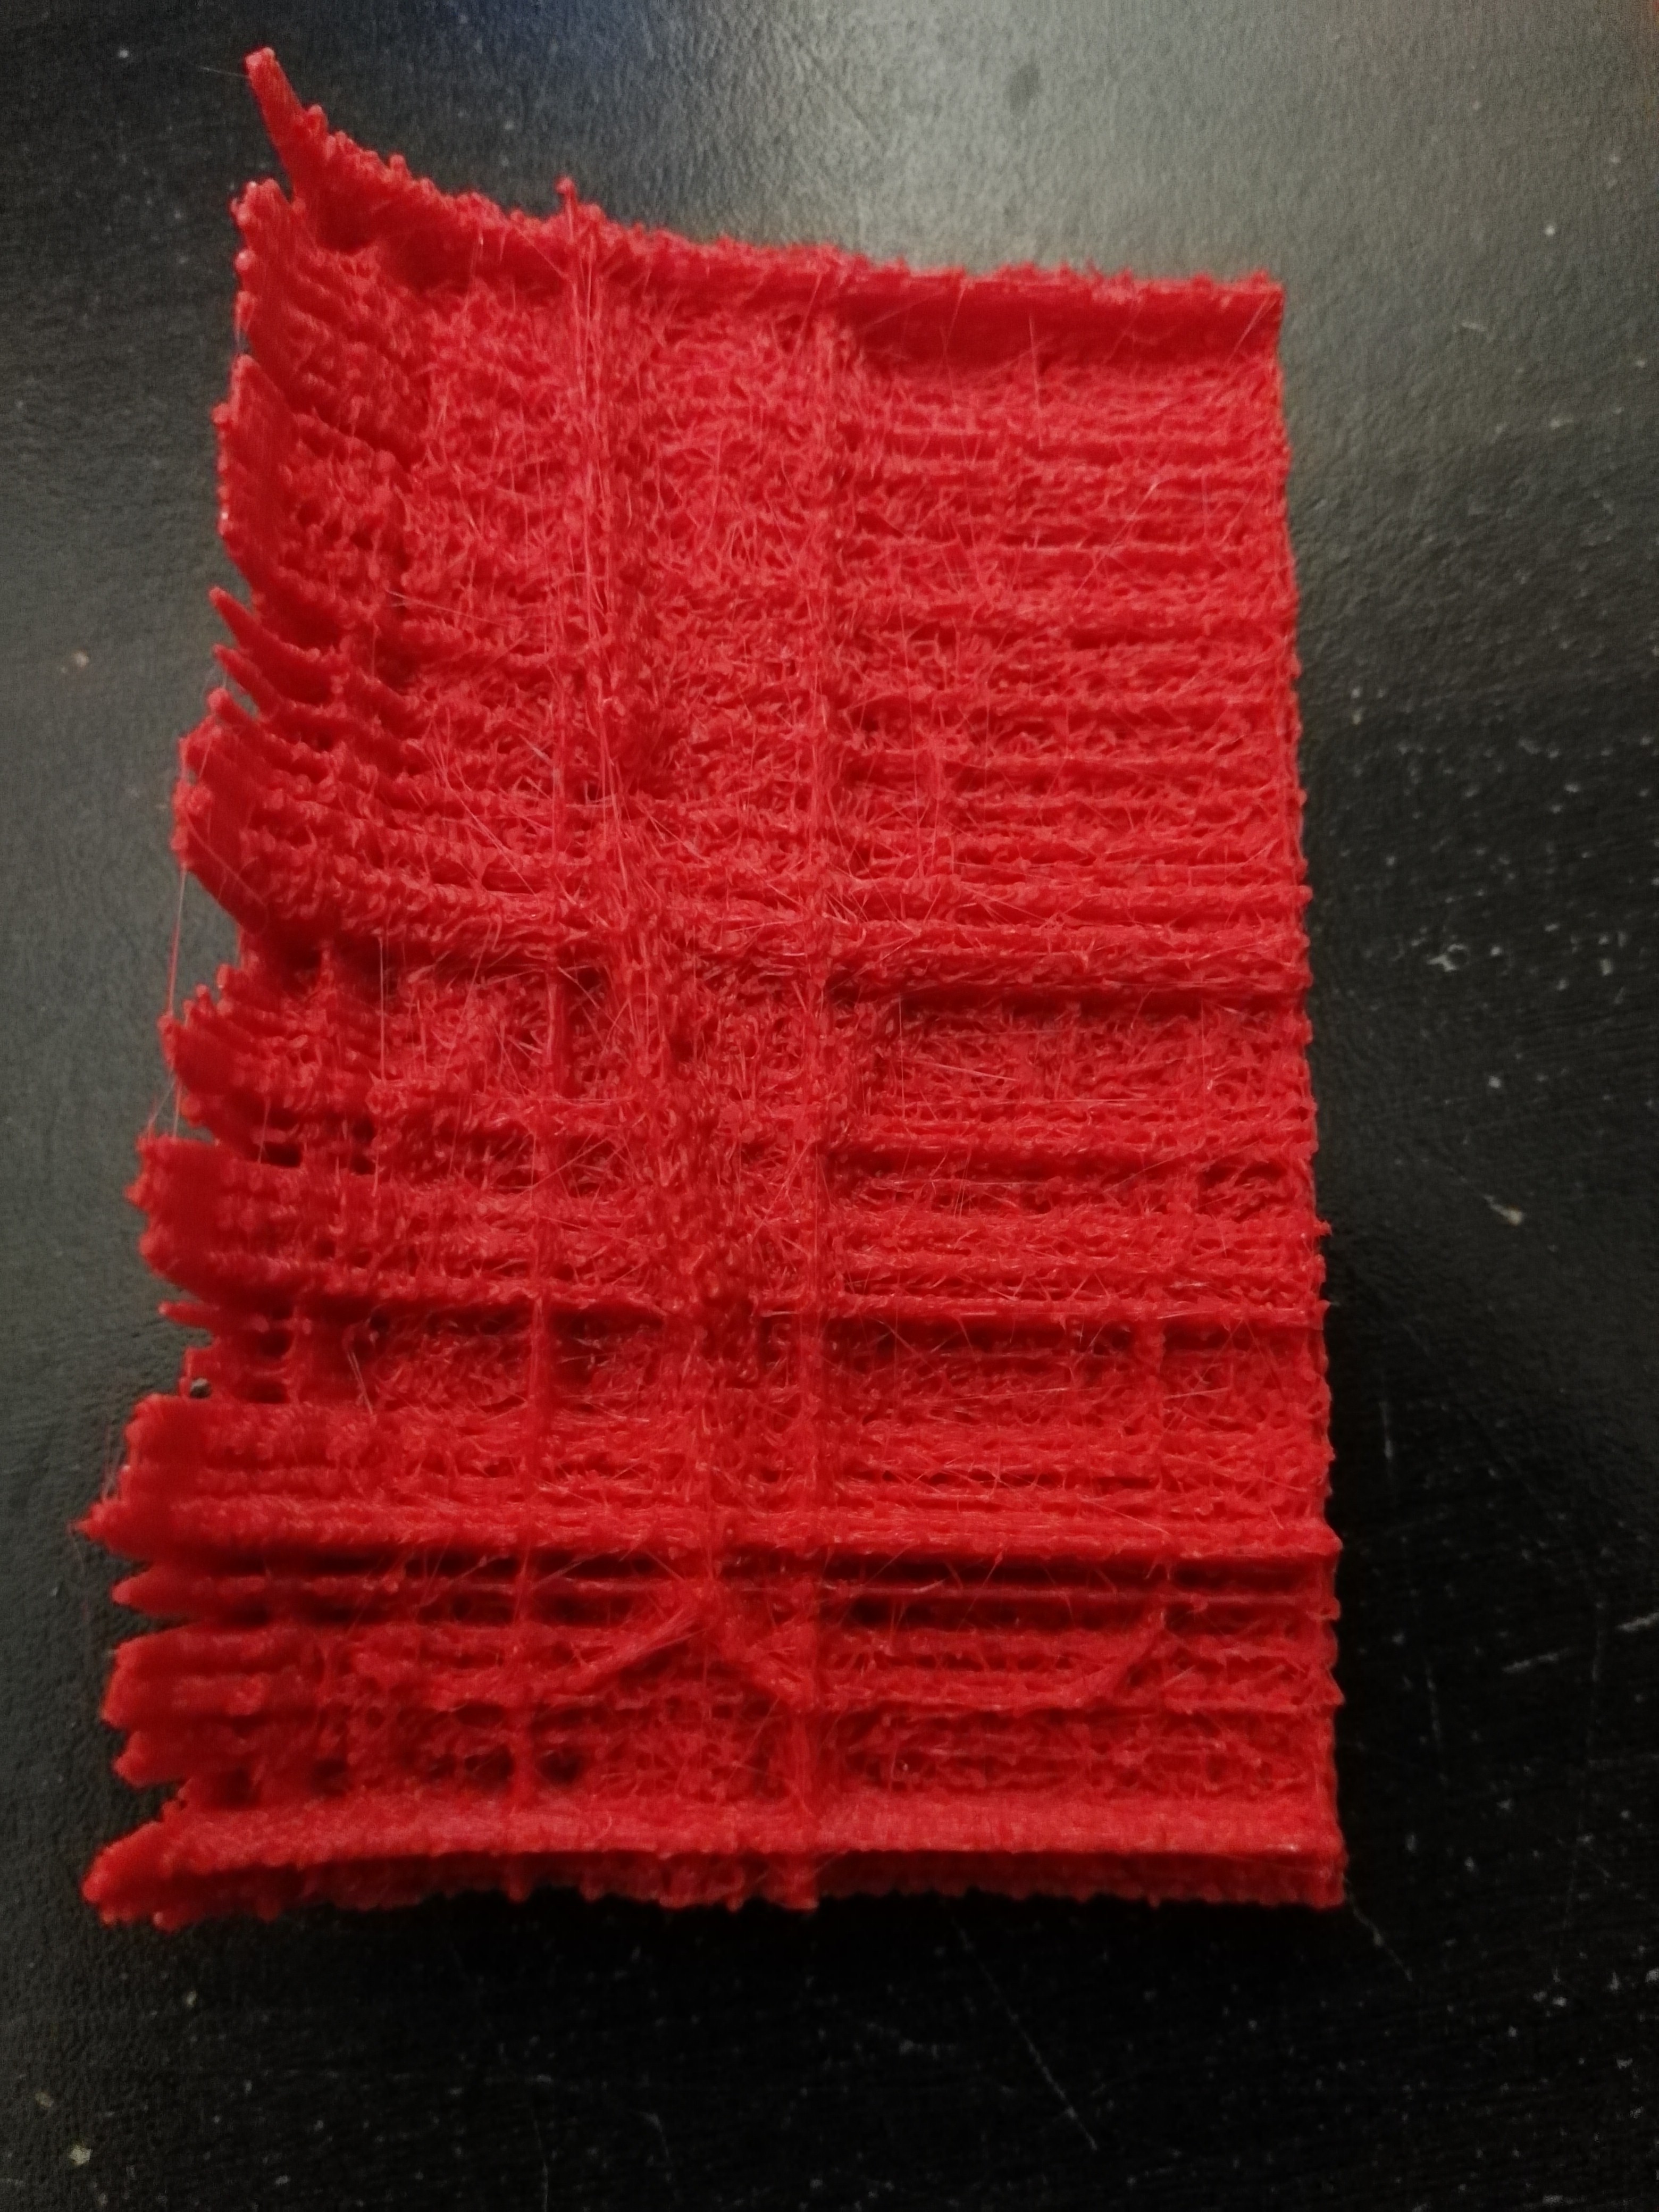
As a bonus for the project, I found my old MATLAB scripts for converting surface plots to STL files and decided to have some fun. So I now present to you a 3D print of the grid harmonics over a 40 minute window:
Here is the original data plus more (which is mirrored on the frequency axis from the print):
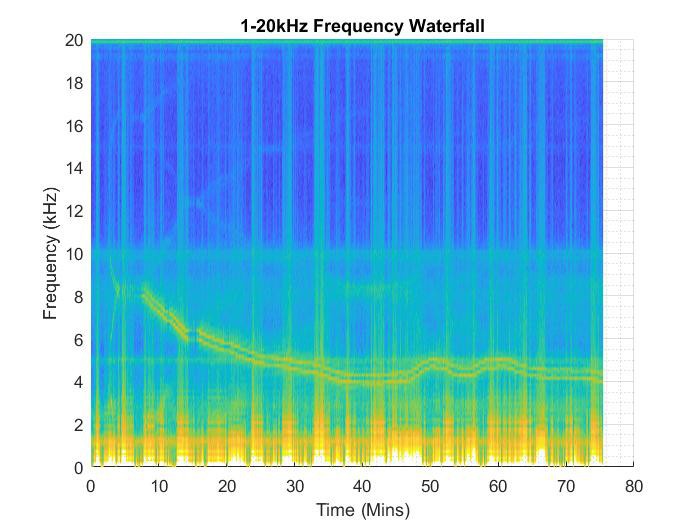
NOTE: The 3D print is the first 40 minutes of the above spectrum only.
Unfortunately, the data is not smooth. Filtering is not really practical as the data of the fainter harmonics is spatially very narrow. Although it's not really captured in the images, holding the object in the right light makes all of the harmonics very visible. If I can reduce the size of the STL file I'll upload it, but this is unlikely.
However, printing a difficult spectrum plot like this does seem like a great place to try colour changing filament that is temperature dependent. The physically higher the data printed, the higher I set the temperature (and thus the more of a colour change). Perhaps the perfect application actually?
Another project for one day :)
Discussions
Become a Hackaday.io Member
Create an account to leave a comment. Already have an account? Log In.