 Ken Yap
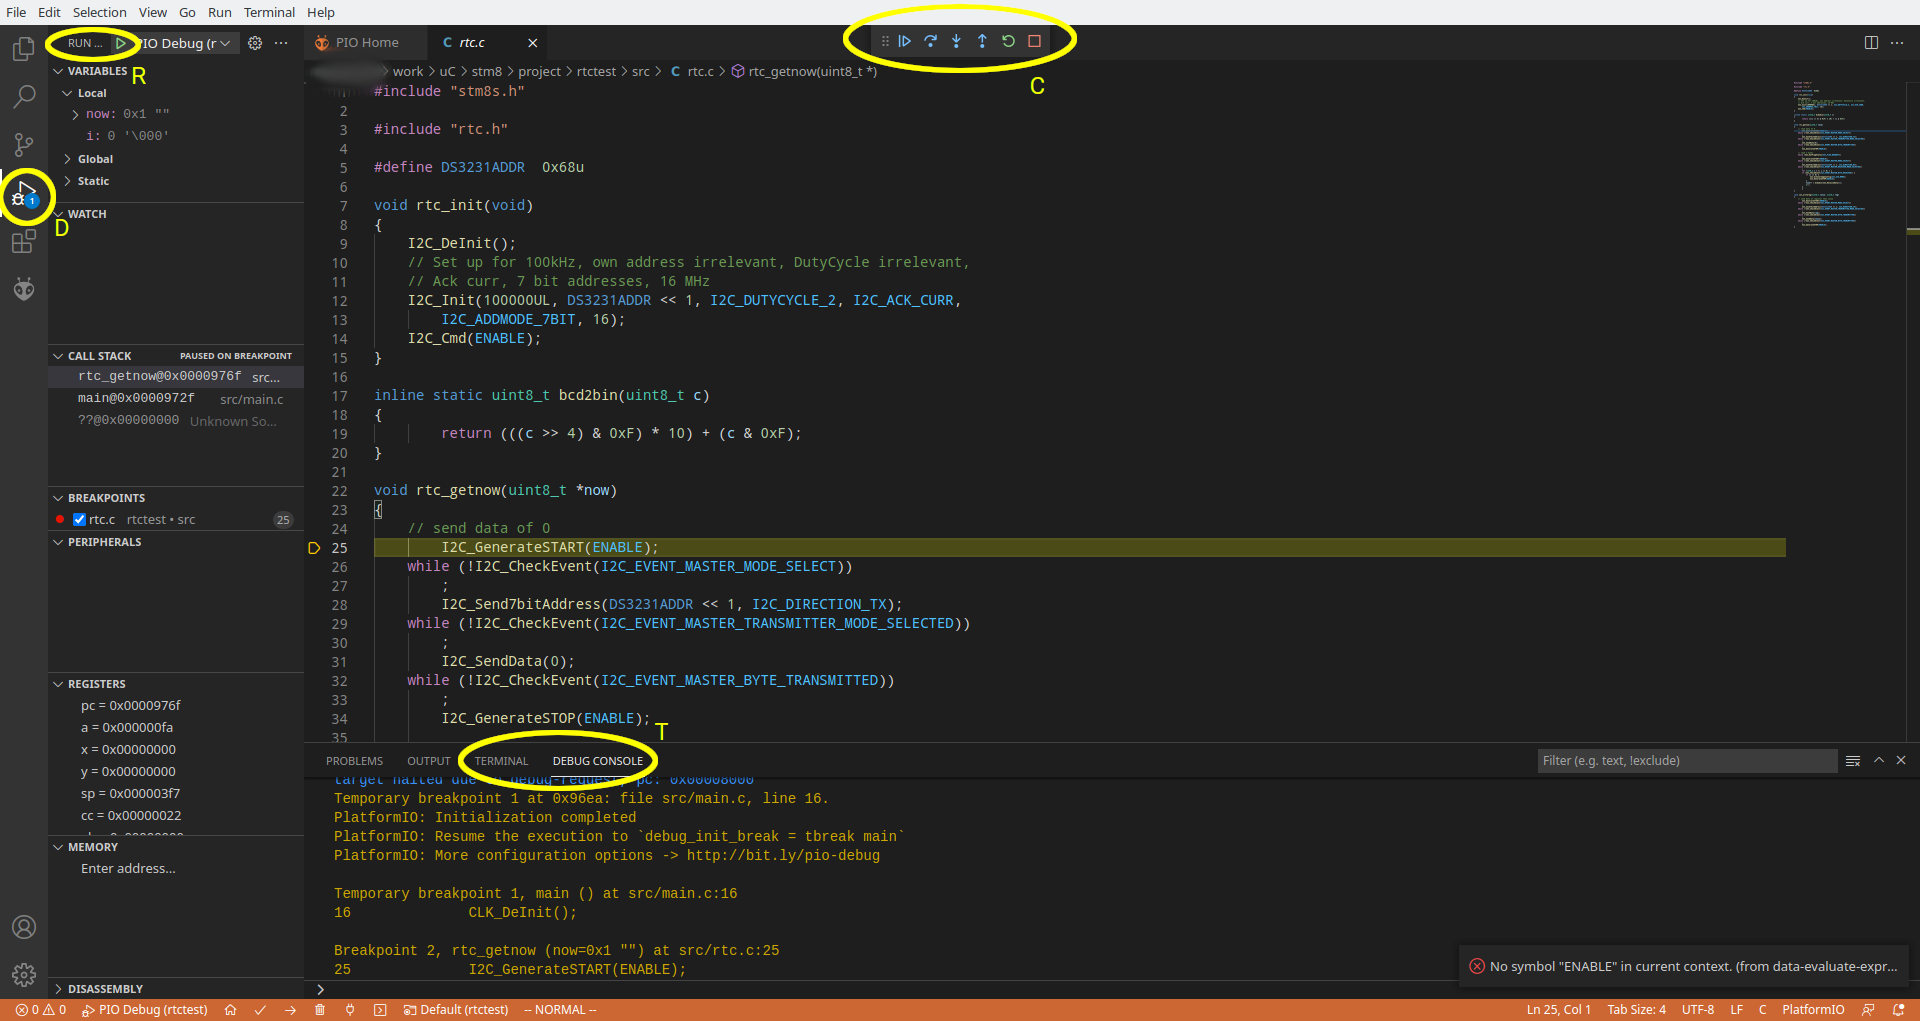
I previously showed how to set up PlatformIO. Now I demonstrate putting PlatformIO to debugging firmware for the STM8. Debugging is where the IDE comes on its own as you can see multiple pieces of information on the screen, unlike a text debug session.
Assuming you have all the build and debug tools installed for STM8 in PlatformIO, and you have the board connected to your host computer with a STlink dongle, then when you open the file explorer to the code you want to debug, and click on icon D, you should get a display like this. As you can see the relevant controls aren't exactly grouped well, they are scattered all over the screen, but you will get used to that. The left column shows the state of the program, including any breakpoints.
To set a breakpoint, right click on the space before the line number and it will allow you set or delete breakpoints. As you can see there's one on line 25.
Start the program with the arrow at R. It will first stop at the beginning of main(), then you can continue using the continue arrow control at C. Here you see we have paused at line 25. You can step into lines or over lines using the controls. These correspond to the gdb commands S and N and can be entered as text at the prompt under the debug console T. However if the program has gone into a loop without hitting any breakpoints, you will have to use the interrupt button at C. This cannot be done from the prompt. You can also restart the session.
Other gdb commands like print [variable] also work, but it's more convenient to watch the variable display in the left column.
One drawback to using debugging from the IDE is that the generated firmware will be larger and may not fit in flash memory if you are near the limits.
Discussions
Become a Hackaday.io Member
Create an account to leave a comment. Already have an account? Log In.