 martin2250
Data Logging and Visualization
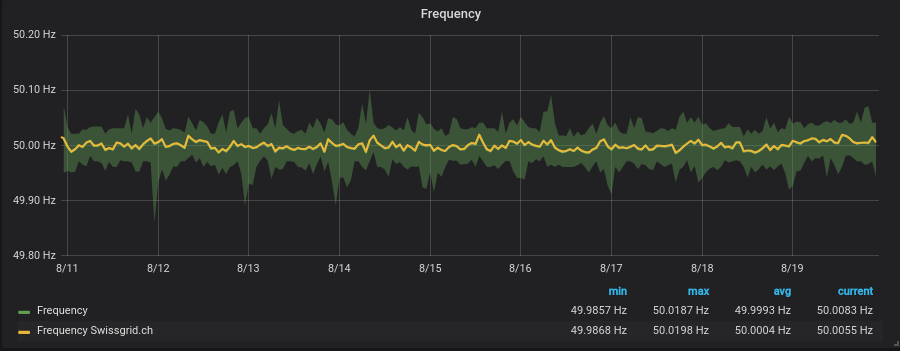
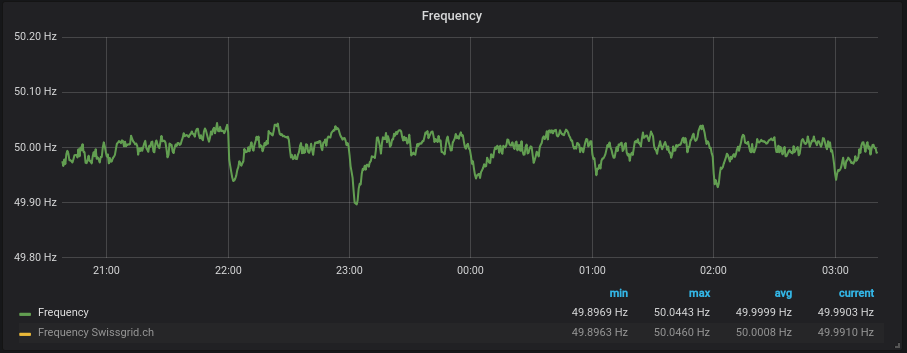
The ESP8266 provides measurements on http://<IP>/metrics in an InfluxDB compatible format:
threephase,loc=main,phase=A,name=voltage_rms value=236.86
threephase,loc=main,phase=B,name=voltage_rms value=237.57
threephase,loc=main,phase=C,name=voltage_rms value=237.77
threephase,loc=main,phase=N,name=current_rms value=1.265
threephase,loc=main,phase=A,name=current_rms value=0.42240
threephase,loc=main,phase=B,name=current_rms value=0.08956
threephase,loc=main,phase=C,name=current_rms value=1.20591
threephase,loc=main,phase=T,name=power_active value=0.24127
threephase,loc=main,phase=A,name=power_active value=0.06691
threephase,loc=main,phase=B,name=power_active value=0.01197
threephase,loc=main,phase=C,name=power_active value=0.16239
threephase,loc=main,phase=T,name=power_factor value=0.590
threephase,loc=main,phase=A,name=power_factor value=0.668
threephase,loc=main,phase=B,name=power_factor value=0.562
threephase,loc=main,phase=C,name=power_factor value=0.565
threephase,loc=main,phase=N,name=frequency value=50.000
threephase,loc=main,phase=T,name=total_energy value=X
threephase,loc=main,phase=A,name=total_energy value=X
threephase,loc=main,phase=B,name=total_energy value=X
threephase,loc=main,phase=C,name=total_energy value=X
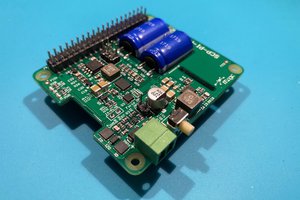
This data is gathered every 10 seconds by a Telegraf instance and stored in an InfluxDB database, both running in Docker containers on my Raspberry Pi 3. To improve reliability and write endurance over the Pi's SD card, I use a WD Green SSD as a boot drive.
Data exploration is made possible by Grafana, which resides in another docker container, connects to the database and hosts a webpage allowing you to create beautiful dashboards such as this
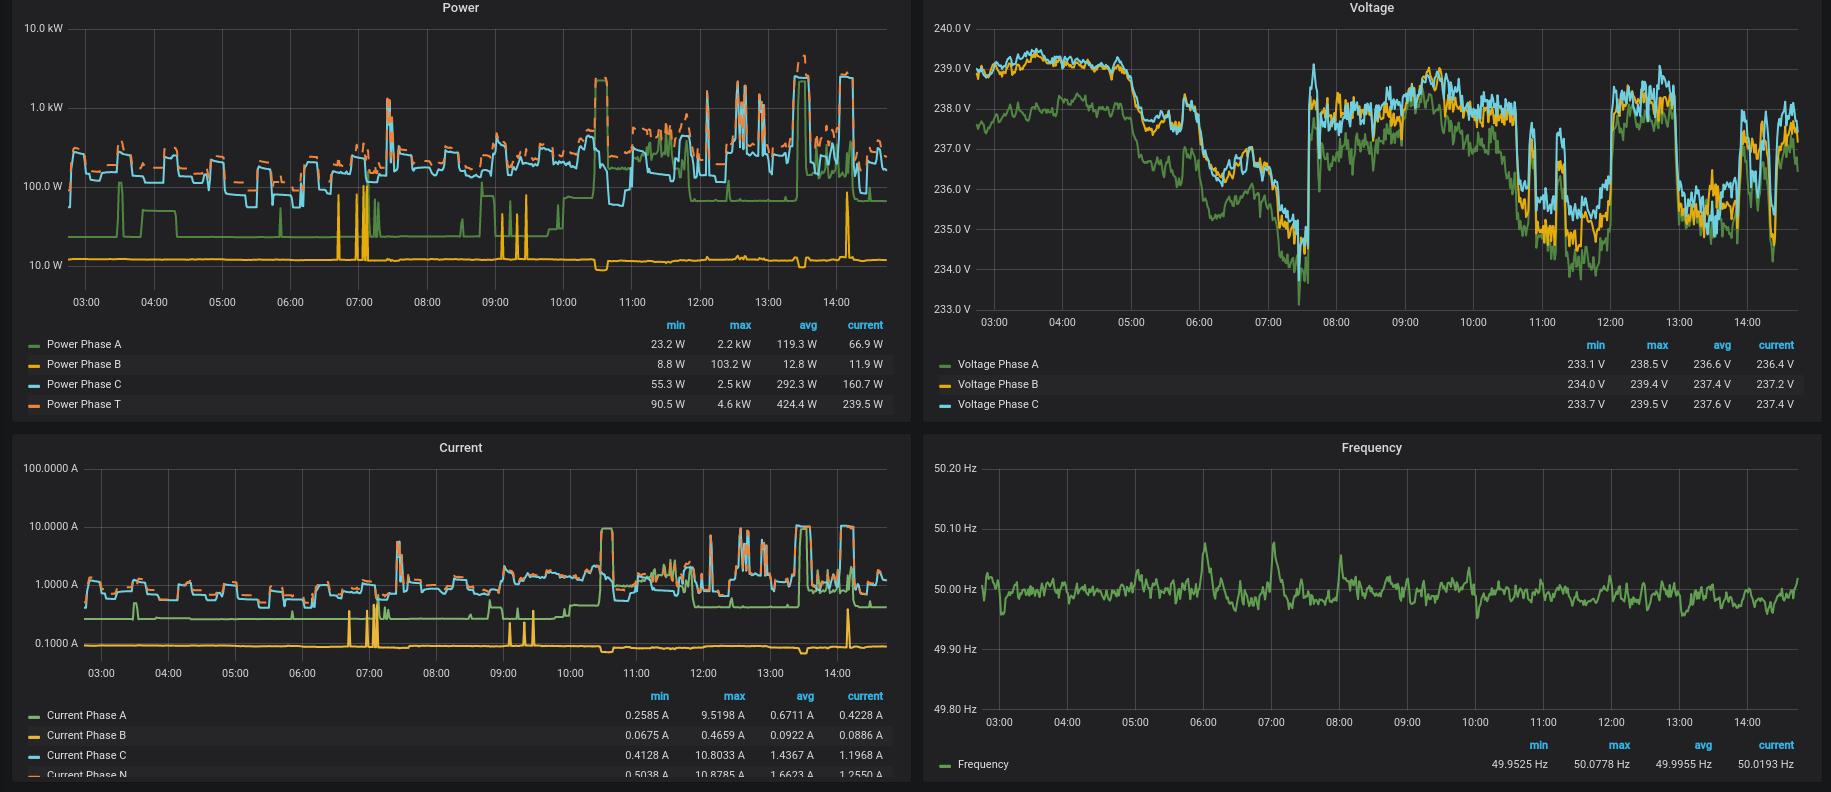
As of now, the database contains around 15 million points and despite taking longer for large queries, the Pi handles this amount of data without a problem and plenty of power to spare, allowing for future expansion.
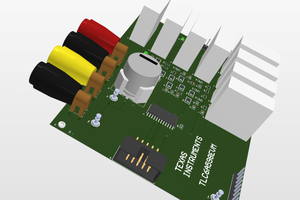
Why FRAM?
I included a small FRAM chip on the same board as the ESP8266, it stores the calibration values and more importantly the counters for the total energy.
The total energy was synced with our old analog meter at the start and should increase continuously (unless you have a PV setup). To make sure that it doesn't start from zero when the device looses power or is rebooted, the total energy should be saved regularly in non-volatile storage. To be fair, modern EEPROMs should have enough endurance when using circular buffers to level out the wear, but it is much nicer not having to worry about this and having essentially infinite endurance.
Input PCB considerations
Despite only using huge, large-pitch components, this board took the longest to design and underwent the most revisions, in order to maximize isolation distances:
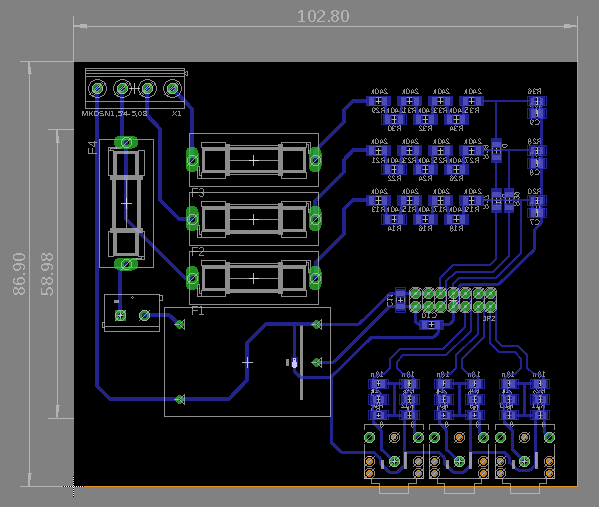
All three phases are fused with 63mA fuses. The power supply, which is connected to phase A, has a separate 2A fuse to allow for the inrush current and a terminal block to connect a switch.
I chose the IRM-01-3.3 as it is by far the safest and most space and power efficient way to provide 3.3V at a wide range of input voltages. I have briefly considered rolling my own SMPS, but this would only introduce more chance for errors which isn't acceptable for a device located in such a critical place. At around 6€ from digikey, it's hard to beat anyways.
When manufacturing this board at home, it is important to coat the copper side to prevent oxidation and keep out moisture. I used clear nail varnish which seems to hold up to the job very well. If you decide to use nail varnish, you should definitely test it first. I created a small test board with two parallel traces separated by 0.8mm, coated it with nail varnish and tested the isolation with a 1kV Fluke isolation meter. I repeated this experiment multiple times after aging the board at over 120°C for multiple hours each and the meter still showed >1Gohm. Still you should probably use a better coating which is designed for the purpose....
Read more »

 Arshmah Shahkar
 mircemk
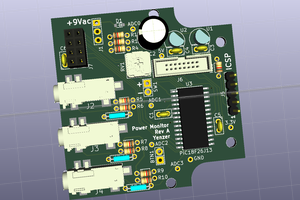
 alcor6502
It is a good project!