 Max-Felix Müller
I want to find out what takes so long in my loop. So I made some measurements to time different parts.
Here are the results for the settings in the previously uploaded code:
Timings (over 210 cycles):
Sampling: 62.0748690196446
Math: 34.39687547229585
Plotting: 6.701296851748512
The times shown here are in milliseconds.
The code was configured to take n = 128*1024 samples for each plot. With a sample rate fs = 2.4Msps we can calculate:
ts = 1/fs
t = n * ts = 54ms
Which is close enough.
By reducing the number of samples to n = 64*1024 the time it takes to collect them also gets cut in half. Furthermore the time the program takes to calculate the fft is only about a third:
Timings (over 62 cycles):
Sampling: 28.427654697049046
Math: 10.655737692309964
Plotting: 4.603389770753922
Again, the times are in ms.
How far can we go?
To calculate the fft I set the number of slots to 1024. So technically down to 1024 samples the times will decrease. Going even lower will force the psd function to fill missing values with zeros. This is called zero-padding. My limited testing had it seem like the time it takes to calculate the fft would go up when zero-padding starts. Sampling time obviously decreases further.
These times are for 1024 samples:
Timings (over 78 cycles):
Sampling: 0.28314040257380557
Math: 0.1401809545663687
Plotting: 3.5302119377331853
Where's the downside to decreasing the number of samples?
Have a look for yourself:
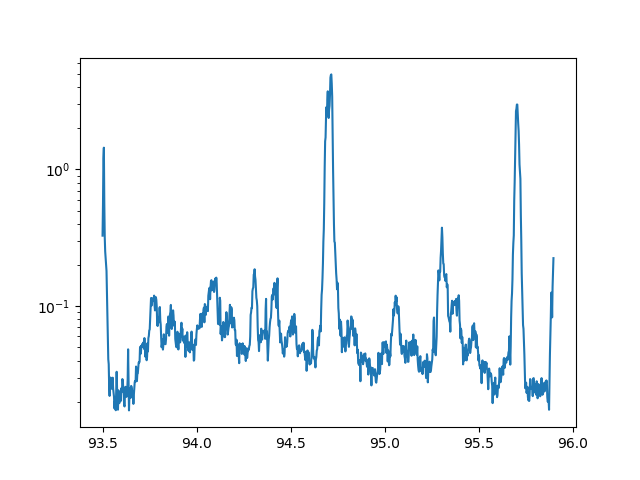
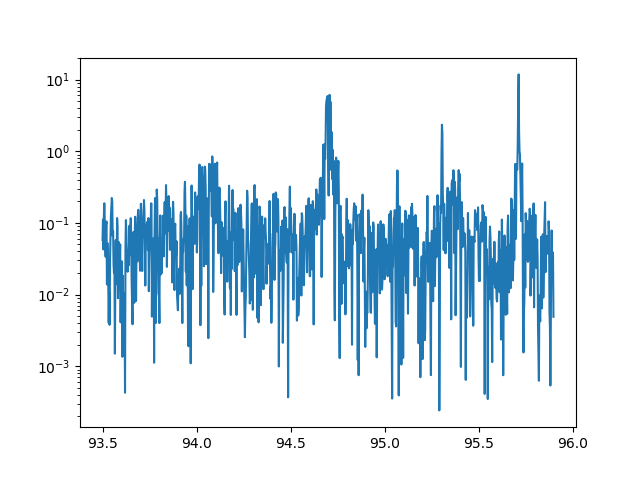
The first picture shows one reading of 128*1024 samples while the second picture only took 1024 samples.
Notice that you can still clearly see the peaks in the signal.
So what sampling rate shall I choose? I have no idea. Further testing has to be made. I guess it depends on what I am trying to accomplish witth the collected data.
Discussions
Become a Hackaday.io Member
Create an account to leave a comment. Already have an account? Log In.