As an avid sports competitor (representing GB as an age group athlete in 10 ITU/ETU Duathlon/Triathlon championships), I have spent a lot of time collecting data for all my sporting activities and like most people in this arena upload their data to Strava or other similar applications.
Fairly recently I have become involved in 3D printing and whilst being an Engineer (Electronics, H/W & S/W); it felt more suitable to build a 3D printer rather than buying one. As I felt that I would get a better understanding of the inner workings of a printer and be able to troubleshoot problems much easier, additionally there is the satisfaction of completing a challenge.
I investigated a number of printers and decided on a HICTOP self-assembly, I built the printer and set about making a myriad of different objects with printing times from 20mins to 10hrs. Along the way there were pitfalls and disasters (setting a print going watching it progress with no issues for several hours, going the bed with the expectation of a completed print in the morning only to find a rats nest of filament because it detached from the bed), all of which improved my knowledge, patience not being a problem. Models have been created using BlockCAD and Cura.
How does 3D printing and Sports data on Strava have a connection you may ask?
Well, whilst looking at a recent route I wondered what it would look like as a 3D model and what would be involved in the process.
How would I take a GPX file and turn it into a suitable file for the 3D printer?
At this point I had no idea of the file format required by the printer having been focused on using modelling and slicing tools which handled the printer control details.
So, I set about finding out about GCODES, researching details of the commands and structure to give me a better understanding of the requirements.
I still had to convert the GPX file so I had double the task to convert both the input file and generate the output file.
Which tool would I use for the task, well this part was not really difficult as I use VBA and EXCEL on a daily basis, but what advantage does Excel in itself offer?
For the task in hand for each X/Y co-ordinate this could be visualised in one row for X/Y position and multiple columns of its corresponding data the important ones being X, Y and Z. All the other relevant data per position was also loaded for completeness which although not specifically required for this project at this time, could be.
It was also easy to display the X/Y positions in a chart to compare against the original and to check for errors and orientation issues.
I had now created a parser for the GPX file and this was displayed on Sheet1.
The next stage was to create a 2D visualisation of this data where for each X/Y position in conjunction with its corresponding Z each column for that row would have an incremental value assigned up to the highest Z value in the dataset (ZDS). If the maximum Z for the row was less than the ZDS the cells from Z to ZDS would be filled with null values this was displayed on Sheet 2.
Incrementing down the rows and extracting the X/Y values and the corresponding Z value in the first column of incremental data. This repeats at the first X/Y value again taking the next column of incremental data. This continues until the ZDS is reached.
Because the maximum X, Y or Z can run into thousands of metres the data needs to be scaled to fit on the limited area of the print bed in millimetres.
This is accomplished using the following formula.
New Value = (Current value – Dataset Min)/Dataset Range * New Range + New Minimum.
Where
Dataset Range = Dataset Max – Dataset Min
New Range = New Max – New Min
Suitable values being selected to produce a usable print.
The data on Sheet 2 is used to produce the GCODES for the printer.
I found the following very useful. https://reprap.org/wiki/G-code
For the main body of the GCODE mainly G0 (Rapid Move) and...
Read more »

 Daniel Westhof
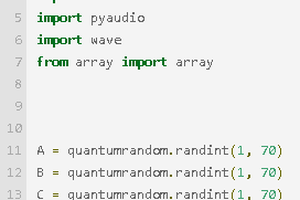
 Tea B
Tea B