i have started coding in automatic adjustments for two reasons. 1 simplifies things, and 2 the voltage bias adjusts over time slightly. the file that shows over 5000 samples of data is uploaded here as filteredeffect.xlsx and arduino code used for the sampling and filtering is here arduino_2_4_filtering.ino
previously i have had excel datat to suggest lowering noise was possible and i was able to do it short term by hard coding the values and calibrating the adc voltage of Arduino with volt meter. by allowing automatic adjustment by the code, manual measurement and calibration is not needed.
so i'm average the voltage over 20 samples and then compare to raw data.
i hard encode the range to look at.
#define min_delta_V 0.01
#define max_delta_V 0.01
i also decided to have data repeat last good value, when voltage out of control limits, this is just so i can compare the same data, and do it live instead of thru excel. i do export it all to excel, but i get all the data in a single run and get to see how the filtering works. i am starting with filtering out out of spec low voltage and out of control variations. in the near future i will be implementing correction from all but the out of spec voltages. for now i am just rejecting these measurements and showing last known value in spec and in control
most the data looks like this the green is the filtered.
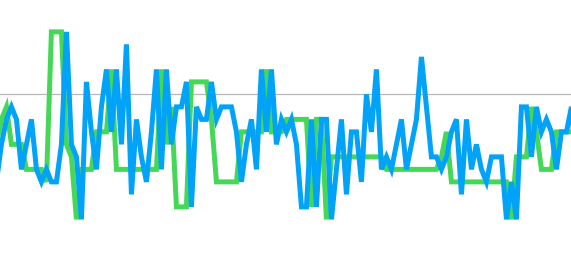
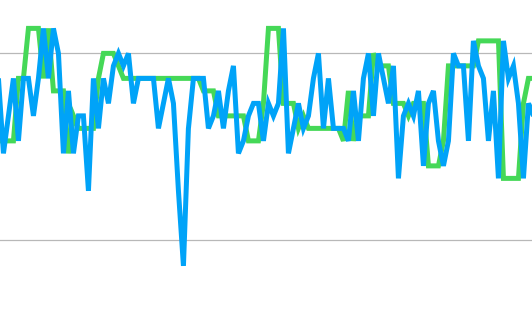
but sometimes the data looks like this
the blue is the raw data, the spikes are rejected from looking at the voltage levels.
here is another one
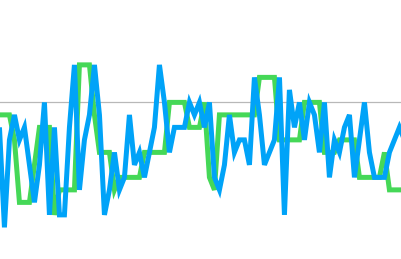
it does not filter it all, but it makes a difference of filtered is a range of (max-min) of 18, versus blue raw data that is a range of (max-min) of 25.
this is only the first step, reject out of control values and out of spec measurements.
next step is to in software on Arduino is to adjust noise and reduce variation from compensation.
there still will be rejected measurements, for example out of spec low voltages because they are on the range of laser power and bias of laser.
currently i reject measurements that are out of spec, out of deviation limits of +/-0.01v, and replace those values with known good values in filtered data, and show unfiltered data column as well.
i should also add this. the above values are just replaced values when voltage is out of control limits
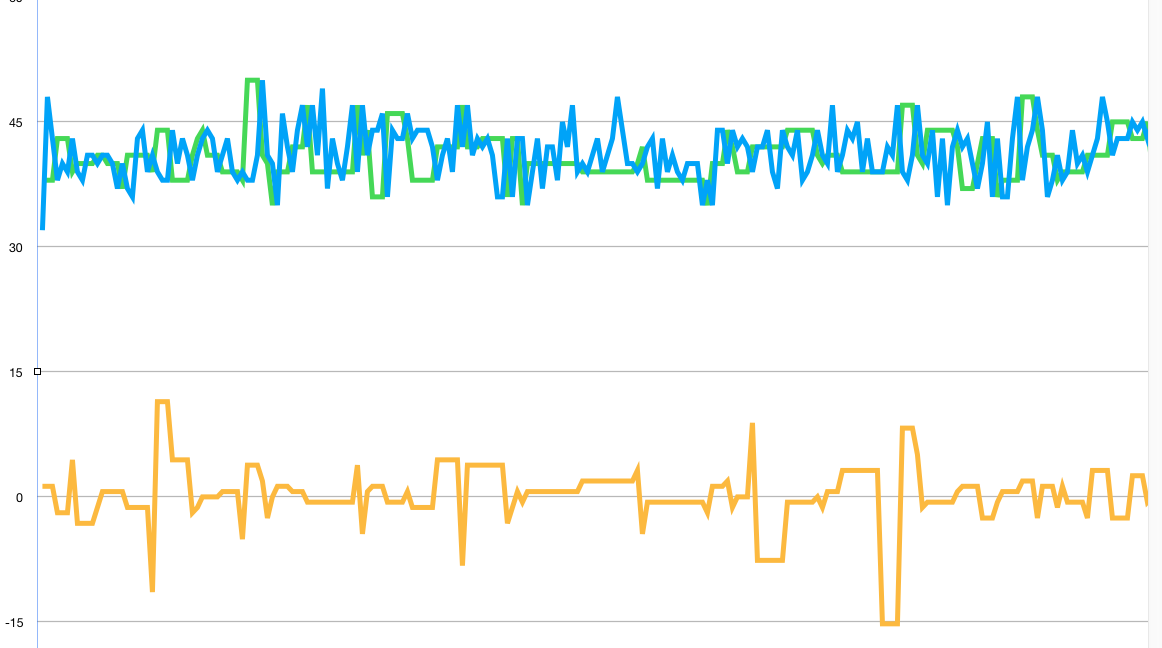
here is a graph that also shows voltage delta x100. the spikes are where the green values are replaced with last known good value, and the blue is the raw data.
Discussions
Become a Hackaday.io Member
Create an account to leave a comment. Already have an account? Log In.