 David H Haffner Sr
Log#41; Further qualifying the UV/VIS functionality of the DAV5 V3 Raman spectrometer by imaging a sample of Rhodamine B (Rhodamine dyes are used extensively in biotechnology applications such as fluorescence microscopy, flow cytometry, fluorescence correlation spectroscopy and ELISA.)
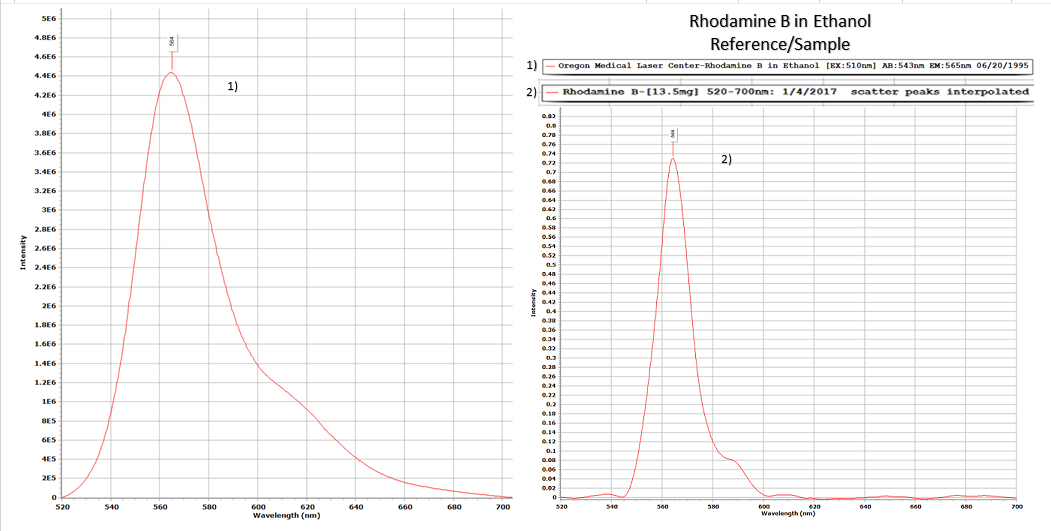
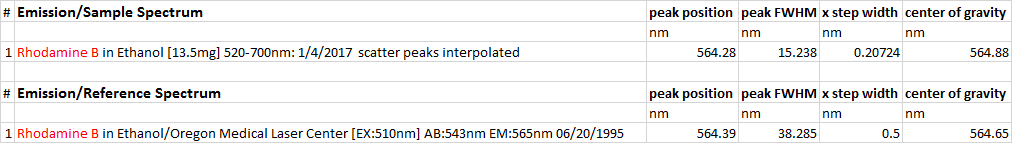
Note that this does NOT in any way diminish the data, as you can see that the spectral shapes are nearly identical.


Samples were prepared in 1cm pathlength quartz cells with absorbance less than 0.1 at the excitation and all emission wavelengths to uniformly illuminate across the sample, and to avoid the inner-filter effect. The dark counts were subtracted and the spectra were corrected for wavelength-dependent instrument sensitivity.
References:
http://omlc.org/spectra/PhotochemCAD/html/009.html - rhodamine b in ethanol
http://www.turnerdesigns.com/t2/doc/appnotes/998-5111.pdf - tracer dye prep
Discussions
Become a Hackaday.io Member
Create an account to leave a comment. Already have an account? Log In.