 Hulk
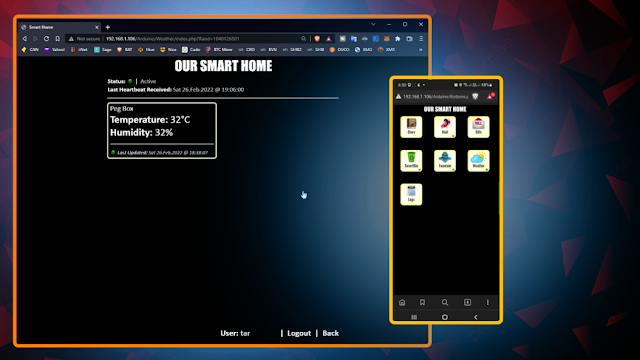
HulkIn my last tutorial I created a Weather Station using Arduino and NodeMCU using DHT11 or DHT22 temperature and humidity sensor and displayed it using an OLED Display. In this tutorial, I am going create a Peg-Box using the same board but with a little bit of twist. In this setup, I am going to send the Temperature and Humidity readings to my Raspberry Pi based home server and store it in a MySQL database. The data can then be viewed using PHP and Google Charts, on a Mobile Phone or a PC connected to the home network.
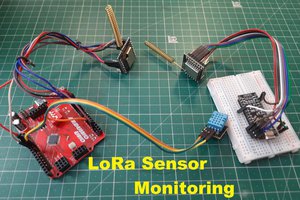
Circuit Diagram

The setup is very simple. The temperature and humidity sensor sends the collected data to the NodeMCU on pin D3. NodeMCU then sends the data over WiFi to the Raspberry Pi, which is then saved in the MySQL database.
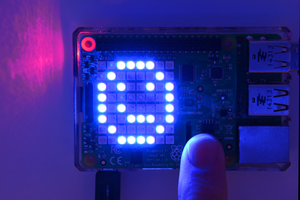
The Yellow LED, which is the status indicator flashes every second and is connected to D6 pin of the NodeMCU. The Blue LED connected to pin D5, lights up when NodeMCU sends the temperature and humidity readings to the database.
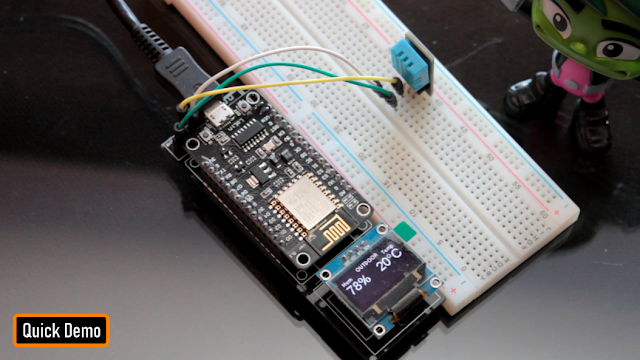
If you are planning to install this box somewhere inside the house, then you can also add an OLED display and display the readings on it.
The Board

So, this is how my board looks like in 2d and 3d.
There are 3 breakout boards in this 100cm x 100cm assembly. Each board can be used with either Arduino or NodeMCU and DHT11 or DHT22 sensor or sensor module.
Temperature and humidity readings can be collected using either a DHT11 or DHT22 Module or by using one of these sensors with a 10K resistor.
The bottom section of the board is for the OLED display. The attached gerber is bit different from what you see on screen. I made some modifications in the final version and moved the sensors a bit far from the microcontrollers.
Component Assembly

Lets start by soldering the female pin-headers to the board. The pin-headers will house the NodeMCU in it.
Next, lets soldered few more pin-headers for the LEDs, DHT11 sensor and the OLED display.
Before installing the circuit in the peg-box, lets hook up the OLED Display and make sure everything works as expected. Boom, nailed it.
The Code

The code starts by including all the libraries and by defining all the constants and variables that will be used throughout the program.
Then there are two functions SendIamAlive() and SendTemperatureAndHumidity() which sends heartbeat and the data read from the temperature sensor to the database server.
The ReadDHTSensor() function reads the data from the DHT11 or DHT22 sensor.
In the setup section we first setup the WiFi and then send a SendIamAlive() message to the server advising that it is back up and running. Then in the loop section the microcontroller send a heartbeat every minute using the SendIamAlive() function and if the time elapses it sends the humidity and temperature data using the SendTemperatureAndHumidity() function.
The White LED flashes every seconds and the Blue LED turns on when the device sends the temperature and humidity data to the database server.
MySQL

So,the data sent by the NodeMCU over WiFi is saved in the MySQL database hosted on a RaspberryPi 4.
Here you can see, the microcontroller sends the data every 30 minutes (you can change the frequency) which is then saved in the MySQL database. The data saved on the Pi's MySQL database can then be used to generate various different types of graphs either by using google charts or any other 3rd party application. It totally depends on you how you want to present it.
3D Design

Now, lets look at the design of the peg-box. Using freely available pallet planks, I designed the body of the box.
The pallet planks I am using are 160cm x 9cm x 2cm (length, width and thickness). So, the rest of the measurements will be based on that.
The top bit of the peg-box will house the microcontroller and the sensors in it. Putting it on the top prevents the electronics from adverse climatic conditions.
The back bit will stick to wall and hence we don't need to cover it up.
You can...
 Zymbit
 Sagar 001
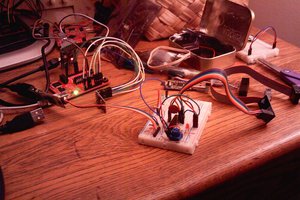
 Ethan Durrant