Rucksikaa.R
Story
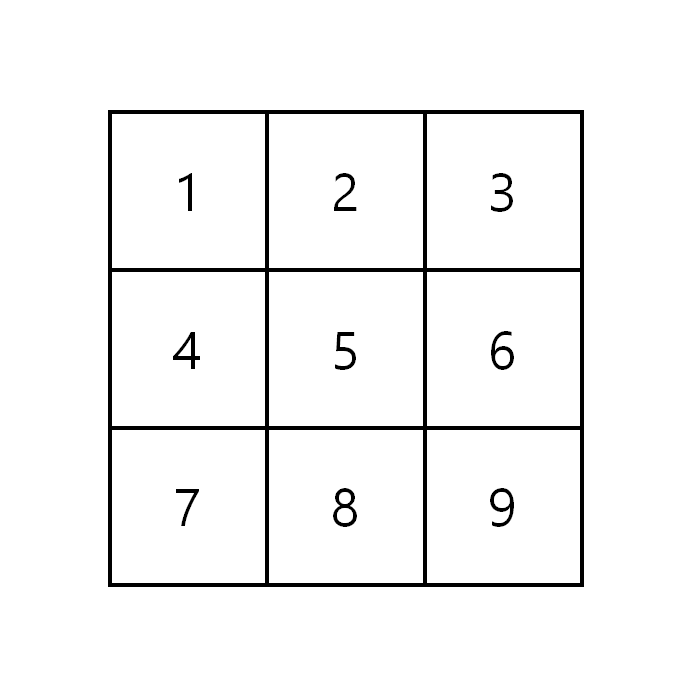
I am pretty sure that you’ve come across a popular Tic-Tac-Toe game that can be played by anyone from all age ranges. If not, I will provide a brief explanation. This strategy game, also known as noughts and crosses (or Xs and Os), is more common among kids to help them develop their planning, problem-solving and cognitive skills. It can be played as a classic paper-and-pencil game or even as a computer game. The players have a three-by-three grid and take turns in placing Xs and Os. The player who places three of his marks in a vertical, horizontal, or diagonal row wins the game.
Recently, I’ve been really interested in developing smart interfaces, and I came up with an idea to implement the Xs and Os game on the M5Stack Core using TinyML techniques. In this project, I’ll show the whole implementation pipeline. Here’s a teaser of what we’ll get as an outcome:
Overview - Game and Software
For my experiment, I created the game using Tkinter and Python. This is a two-player game so you will need someone else to play with you!
Another important aspect is how to draw the Xs and Os. This is where our M5Stack Core 2 ESP32 IoT Development Kit (I will call it M5Stack from here) and Neuton TinyML come into play. By the way, though Neuton is not an open-source tool, all functions are free and its models can run on almost any MCU.
Then I focused on preparing a proper dataset. I was inspired to apply this idea after taking a look at the MNIST dataset. I will explain why as you read further :)
I drew the position number on the M5Stack and the respective mark was to be placed on the specified position in the 3x3 grid. The handwritten digit would be predicted by the Neuton TinyML model and the model's output would be passed on to the Python program.
MNIST Dataset & Its relevance to the Project
The MNIST (Modified National Institute of Standards and Technology) dataset is the "hello world" dataset of computer vision, sourced from the MNIST database which is a large collection of handwritten digits.
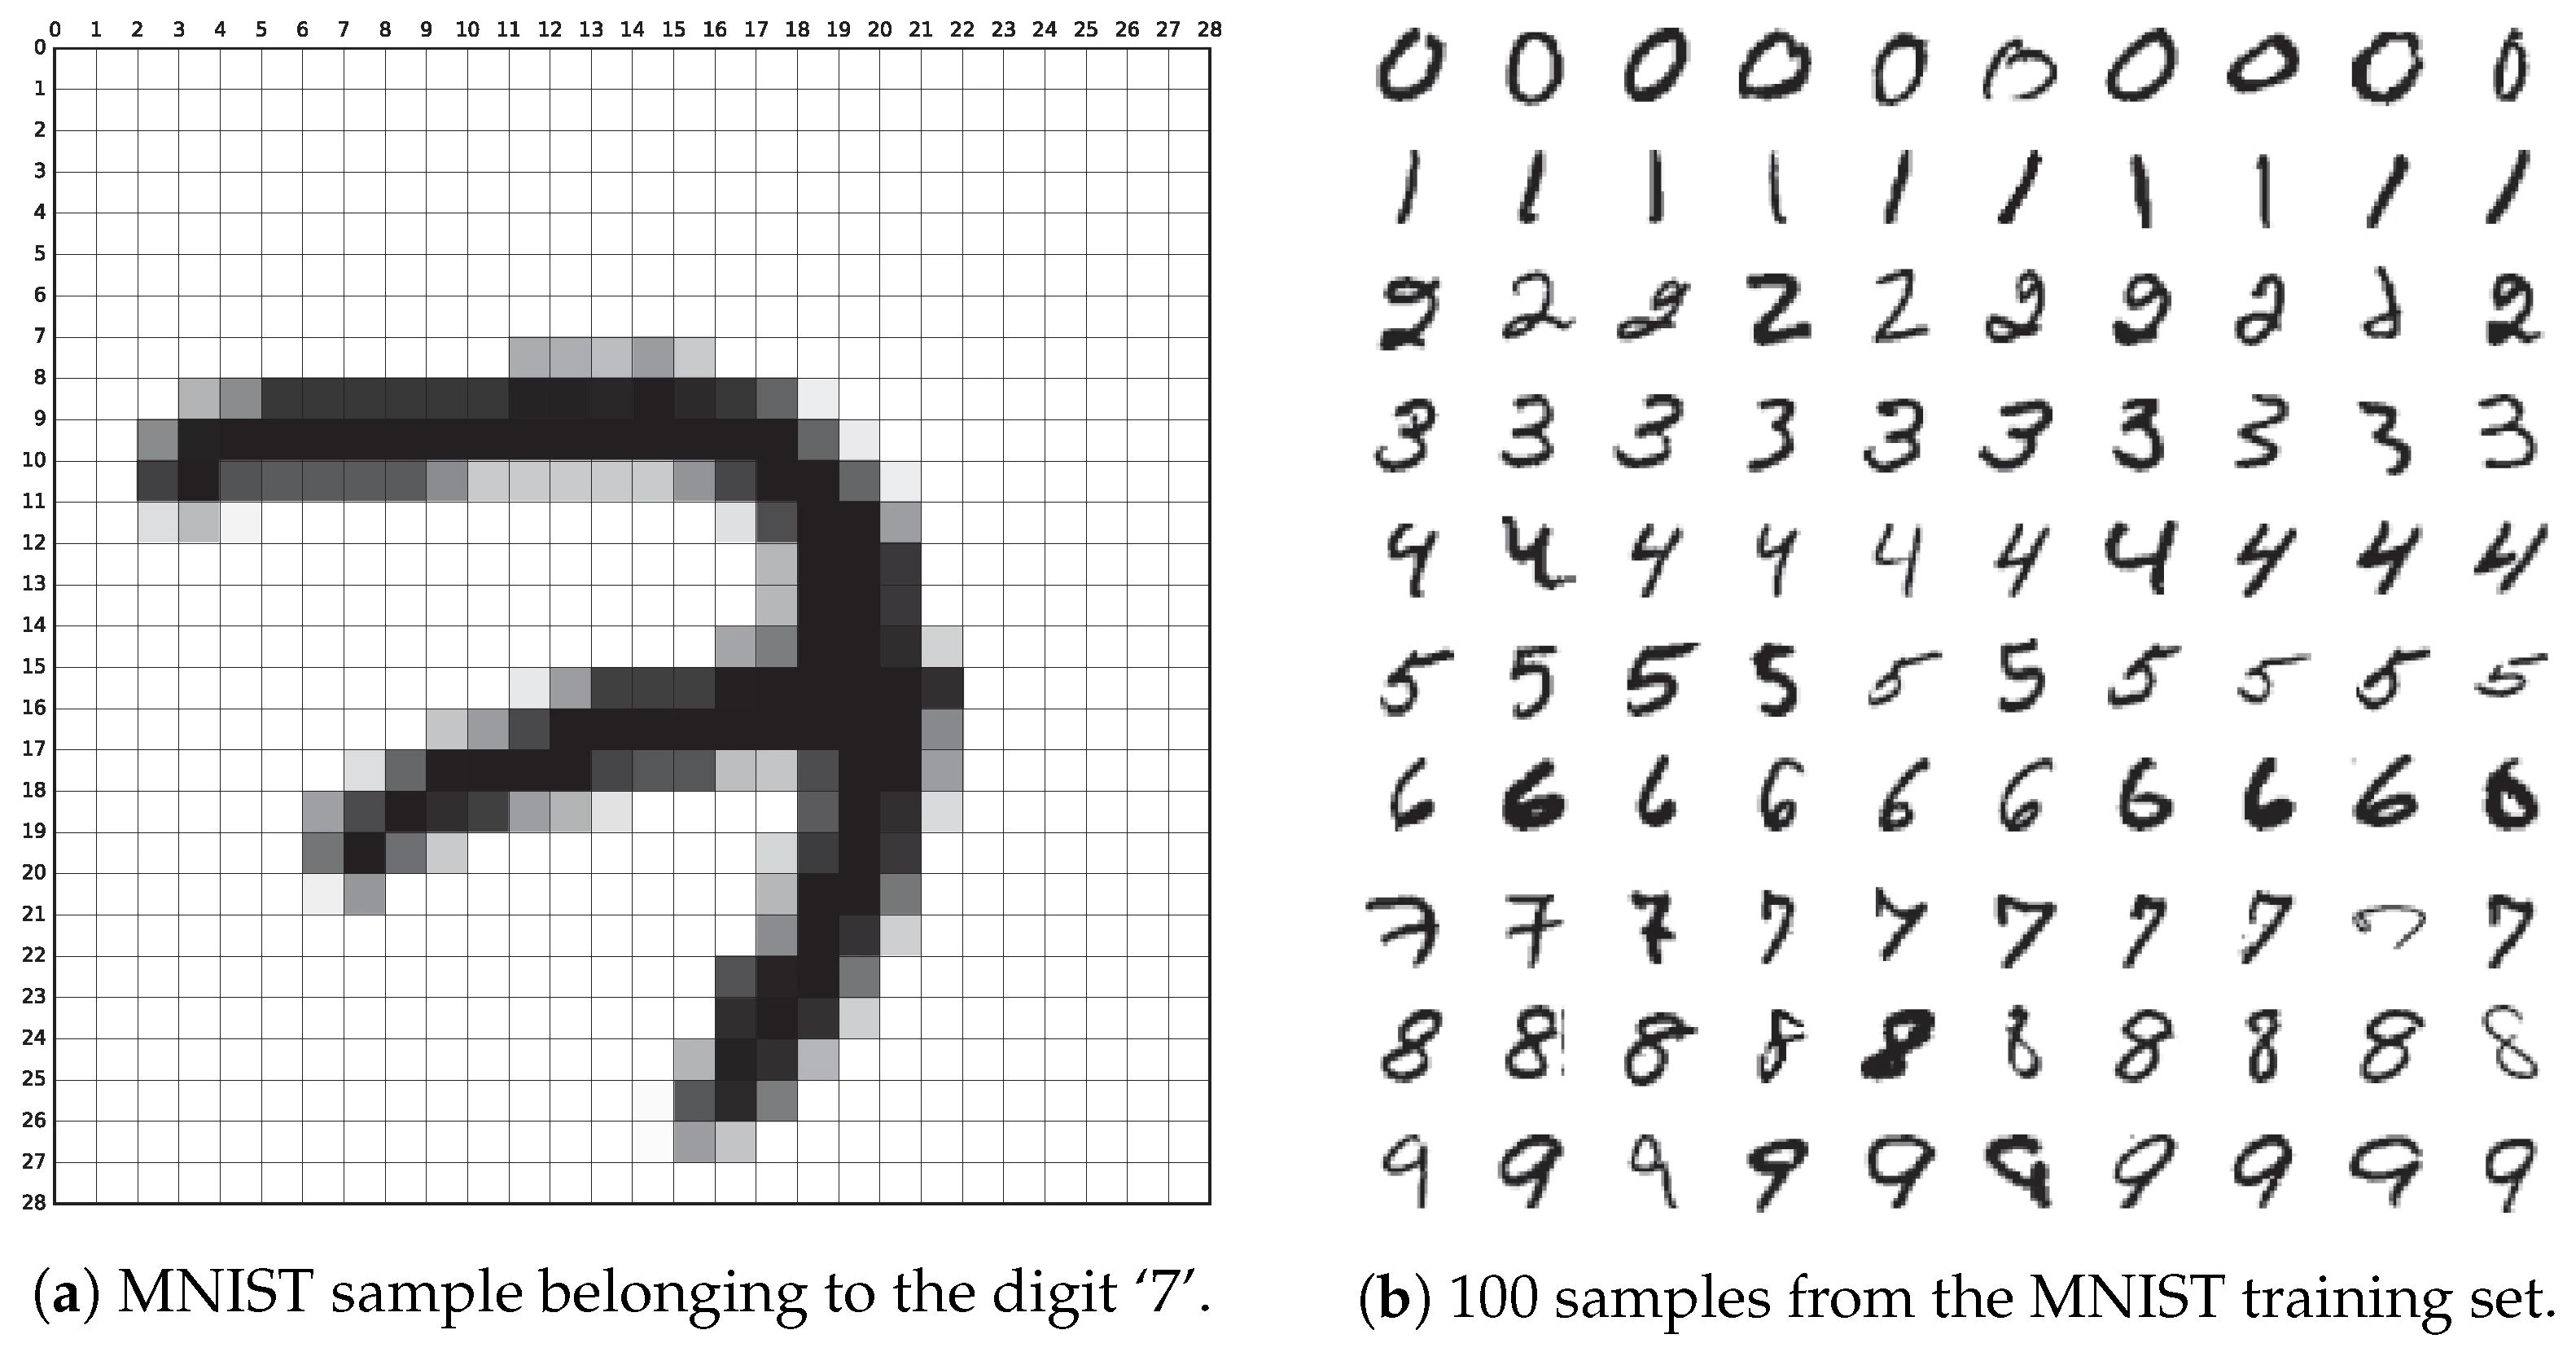
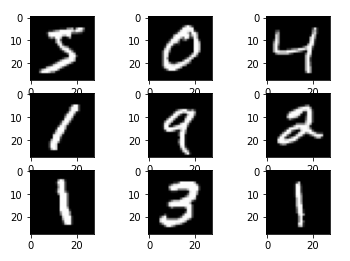
Each sample is a 28x28 grayscale image of a hand-drawn digit between 0 and 9. There are 784 pixels in total and each pixel value indicates the lightness/darkness of the respective pixel. A higher pixel value means the pixel is dark and if it's low – the pixel is light. The pixel value has a range of 0-255 (inclusive).
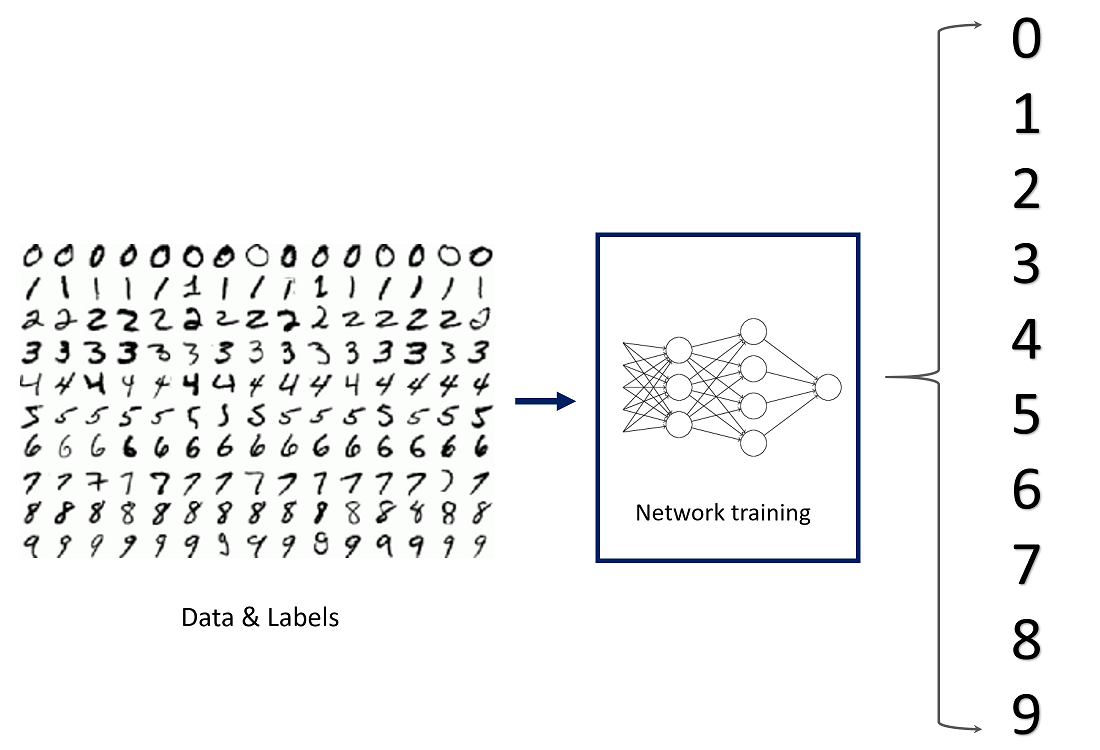
Neuton already has pre-trained datasets that are ready for deployment and the MNIST dataset is one of them. The training dataset contains 42, 000 samples while the test dataset contains 28, 000 samples. The target variable of the training dataset is the 'label' variable which contains the digit that should be recognized and the feature variables are the pixel locations which contain the pixel values of the respective pixels.
The pixel location of a pixel is calculated using the following formula:
x = i * 28 + j
x is the pixel location. I and j are integers between 0 and 27 (inclusive). I denotes the pixel's row while j denotes the pixel's column and the indexing is by zero.
I decided to create my own dataset based on this idea.
Data Collection: Preparing the Training and Test datasets
I used my M5Stack to collect the data and prepare the training and test datasets. I decided to assign 75% of the data as the training dataset and the remaining 25% as the test dataset.
The target variable of my training dataset will be the 'Label' variable and it will contain the position number. The position number ranges from 1 to 9, inclusive. I collected 200 samples for each digit, 150 of which belonged to the training dataset and 50 of which belonged to the test dataset. There will be 255 feature variables that contain the pixel values of the respective pixels. The MNIST training dataset contained 784 feature variables but I decided to narrow it down to 255 in my dataset as I won't be drawing the digit all over the screen. I verified...
Read more »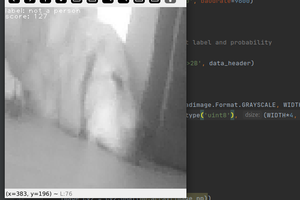
 kasik
kasik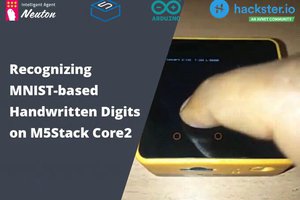
 Sumit
Sumit