 mircemk
A barograph is a barometer that records the barometric pressure over time in graphical form. This instrument is also used to make a continuous recording of atmospheric pressure.
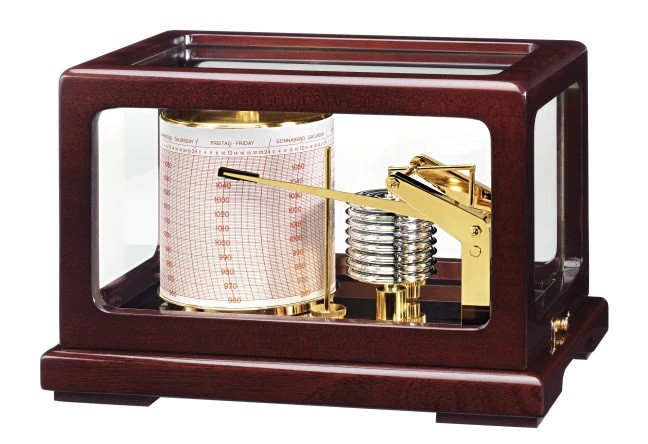
The former Barographs use the pressure-sensitive element, which is linked to a pen arm in such a way that the vertical displacement of the pen is proportional to the changes in the atmospheric pressure. This pen marks pressure changes on specially marked paper that is placed on a disc that rotates 360 degrees over 24 hours. In the picture below you can see what a Barograph from the last century looks like.
The barometer and the barograph are basic local instruments (independent of the Internet) in Meteorology that serve to predict the weather. This time I will present you a very simple way, using an Arduino microcontroller, you can make an electronic Barometer + Barograph that presents the results in graphic form on a 20x4 LCD display. The basic project is taken from "cxem.net" by the author AMatroskin, in which I modified and now the pressure is displayed in hPa instead of mmHg, and what is much more important, instead of the Absolute, the Relative Atmospheric Pressure for the specific altitude is displayed, which is a common standard in Meteorology.
For this purpose we need to enter the Relative Standard Atmospheric Pressure for the current altitude (As described further in the text), in the line:
#define SEALEVELPRESSURE_HPA (932.17) // for Ohrid, 698m altitude
and we can calculate that, on one of the online calculators, such as:
https://www.mide.com/air-pressure-at-altitude-calculator
Also further down the line
value = round ((bme.seaLevelForAltitude(698, bme.readPressure())/100))
the current altitude in meters should be entered.
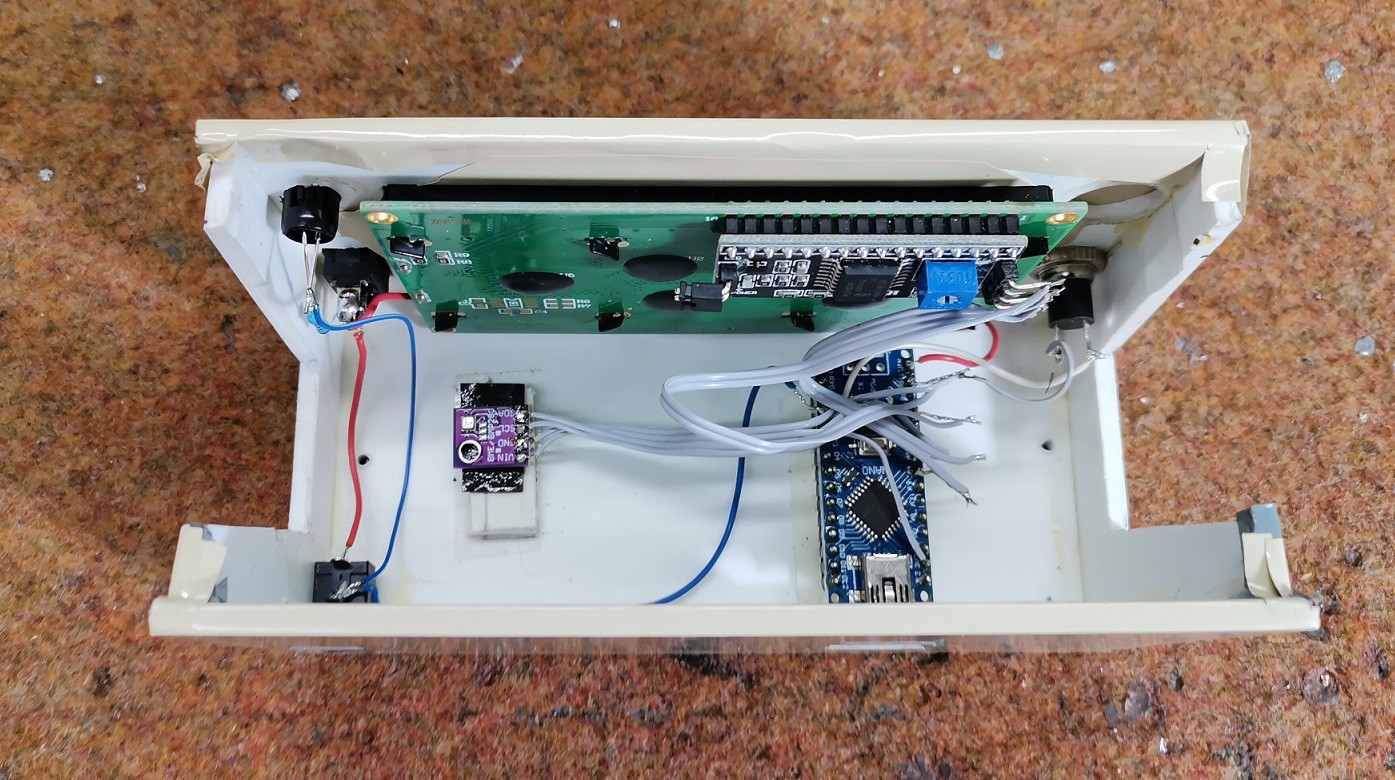
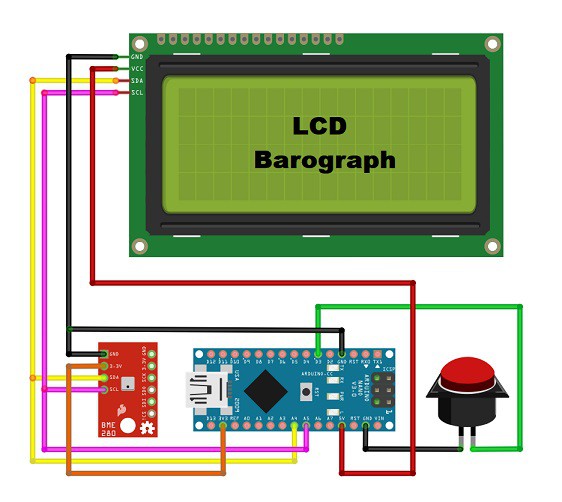
As I mentioned before, the device is very simple to build and contains only a few components:
- Arduino Nano microcontroller
- 20x4 I2C protocol LCD Display
- BME 280 Pressure sensor board
- and one Button
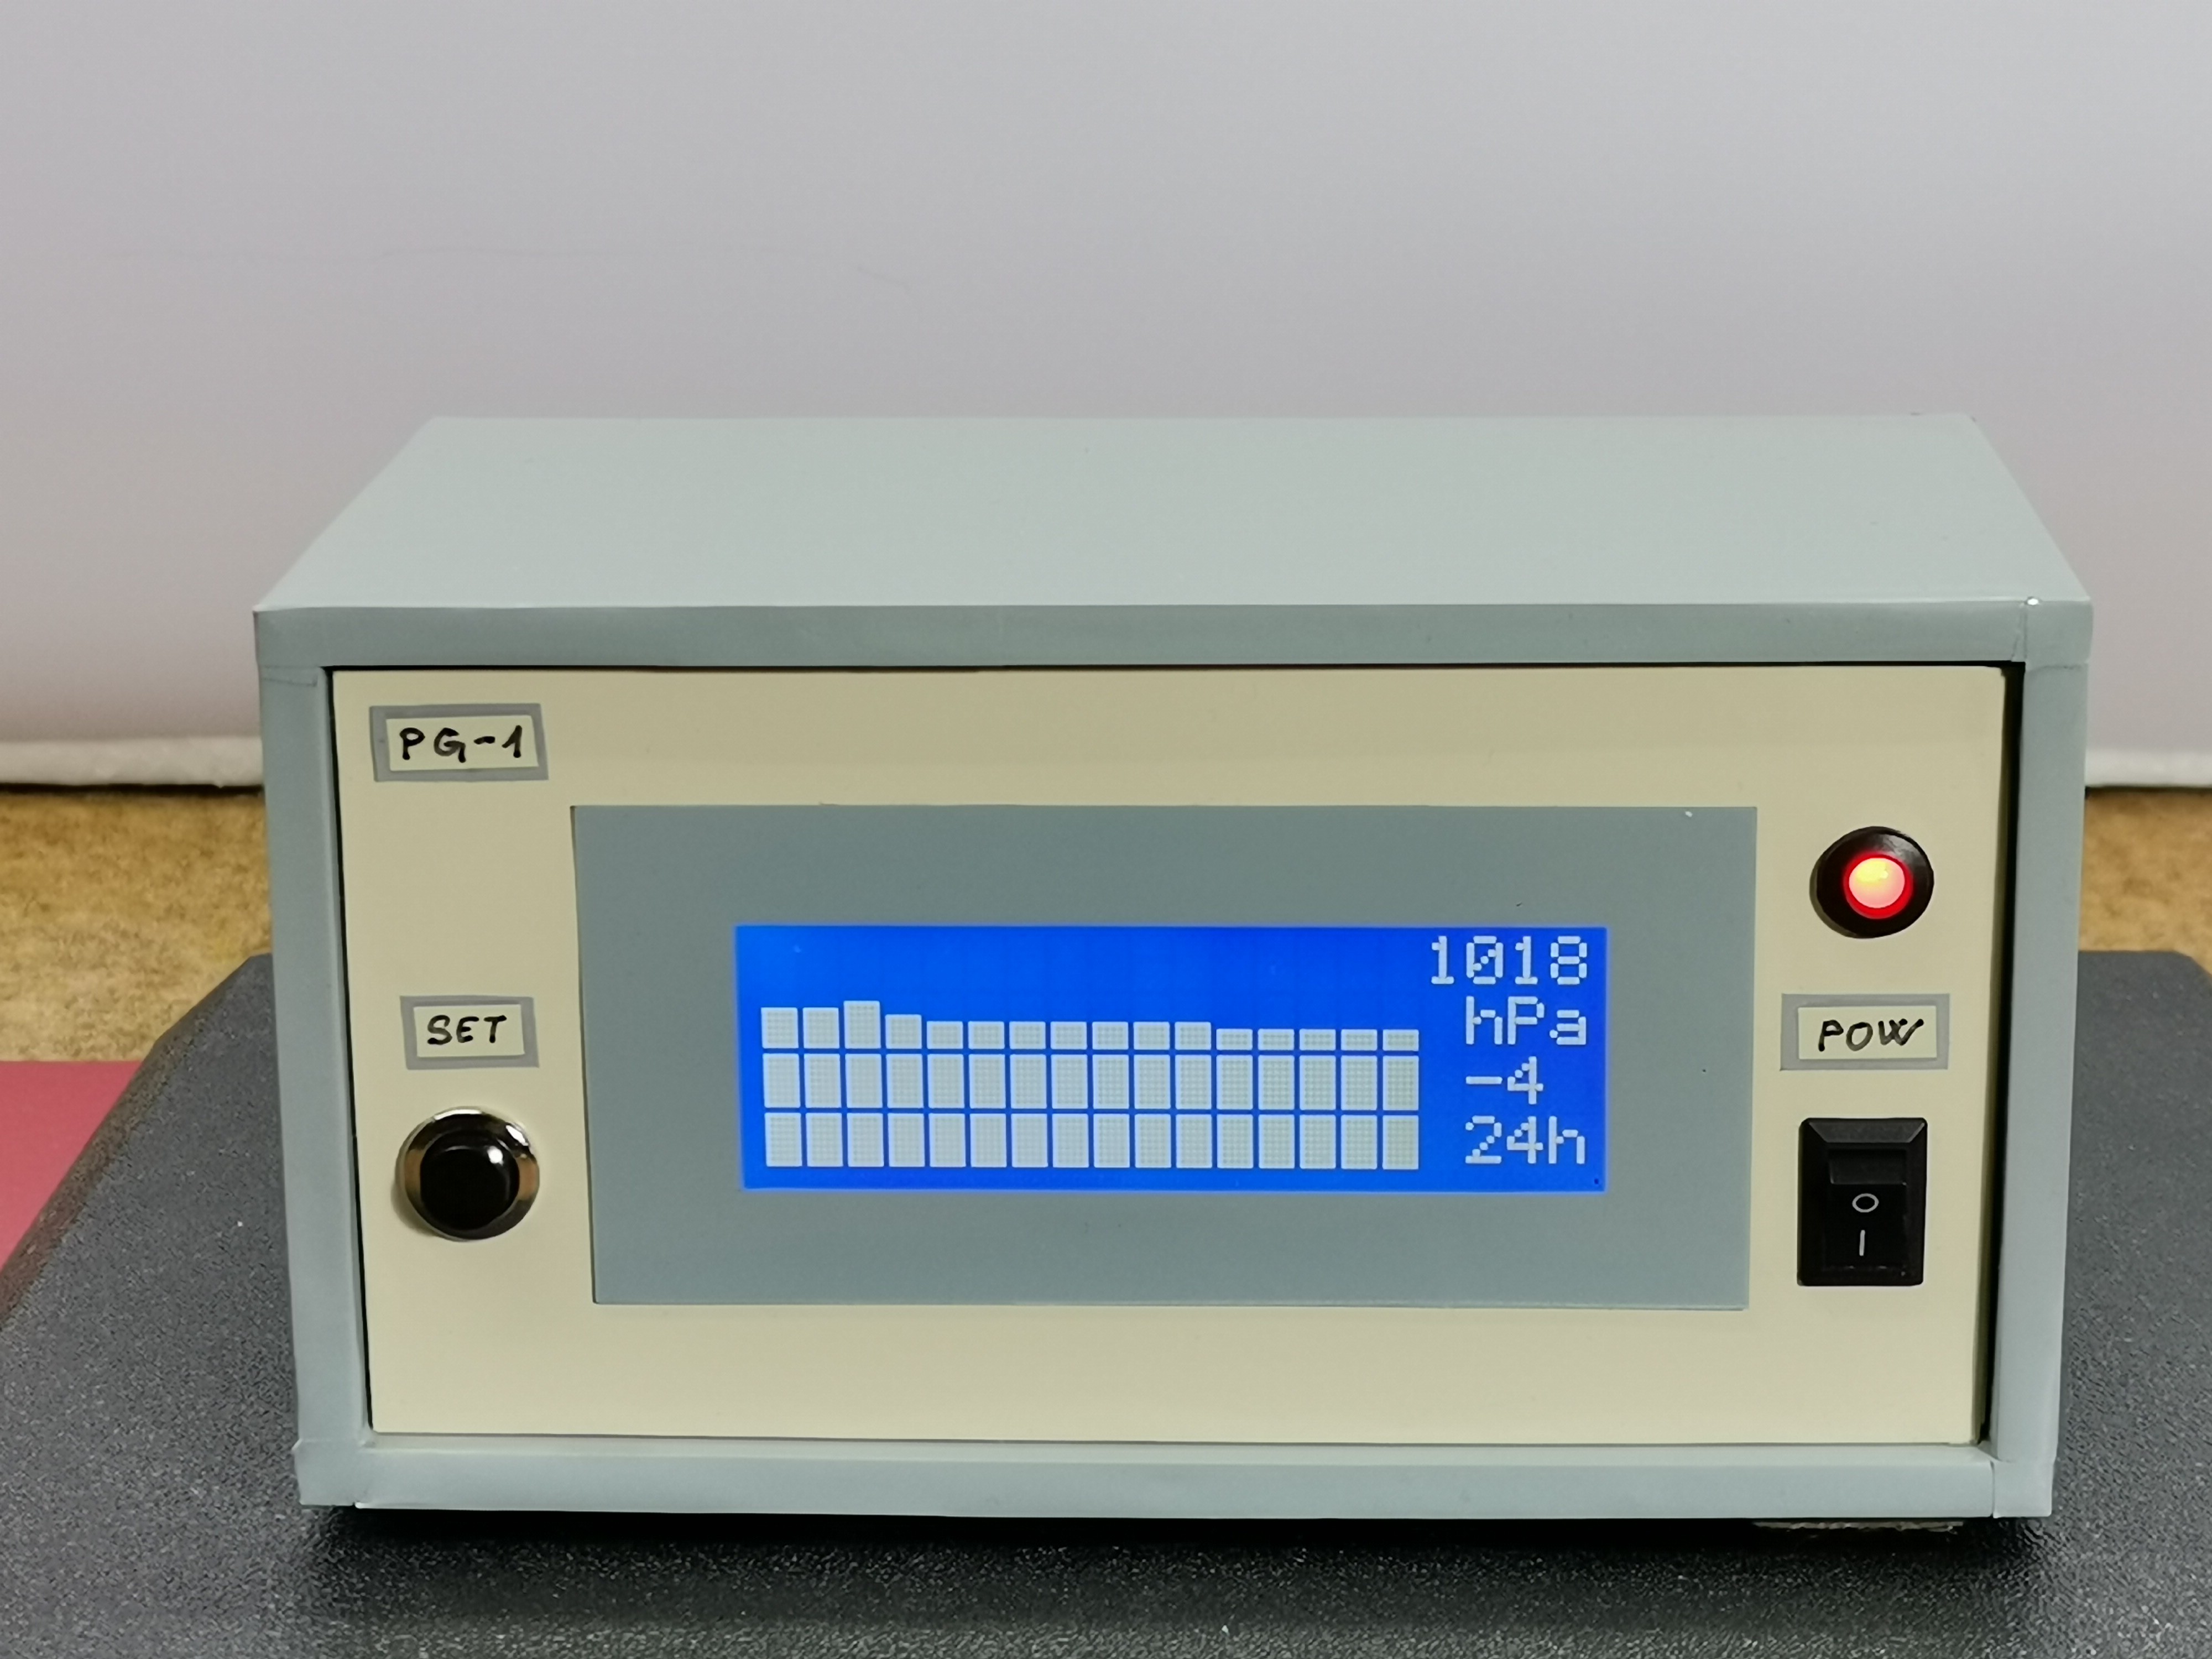
Now let's see how the device works in reality. First of all, it takes 24 hours to draw a complete graph. The display shows the current Relative Atmospheric Pressure, as well as the positive or negative difference in hectopascals, for a given previous time period. This period can be 3,6,12, and 24 hours. Correct interpretation of this difference is the basis for accurate weather prediction. And now a few words about the graph. The maximum number of values on the vertical axis can be 28 (7vertical dots on every of four rows). At the beginning of the code, the range in which the air pressure is read can be changed, i.e. the smallest and the largest value. Depending on these values, the resolution of the graph also changes. For example, if we choose the difference between the minimum and maximum pressure to be 28, then 1 Hectopascal corresponds to one line on the Y axis of the graph. The sixteen values on the X axis represent time, and here the resolution depends on the selected elapsed time value.
Basically, when the pressure rises, an improvement in the weather is expected, and conversely, when it decreases, a worsening of the weather is expected.
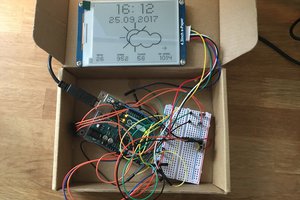
And finally, the device is placed in a suitable box made of PVC material with a thickness of 5 mm, and covered with self-adhesive colored wallpaper. Let me mention that the BME280 sensor is placed inside the box, because in this case we measure only the pressure, which is independent of the temperature
 RT-Thread IoT OS
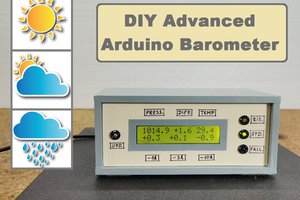
 fandonov
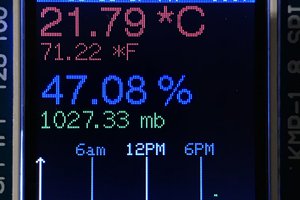
 Timo Birnschein