 j
jµ Spec Mk.3
The µ-Spec Mk.3 provides multiple sensors, measurements with individuals graphs and diagrams. My goal was an easy and intuitive use. All measurements can be saves as CSV files on a µSD card.
The ides was to use two µ controllers. One provides all data, the other will show, plot on 5" TFT and/or save data. The 5"TFT came with an esp32s3. The sensor collector side is an esp32 dev. board.

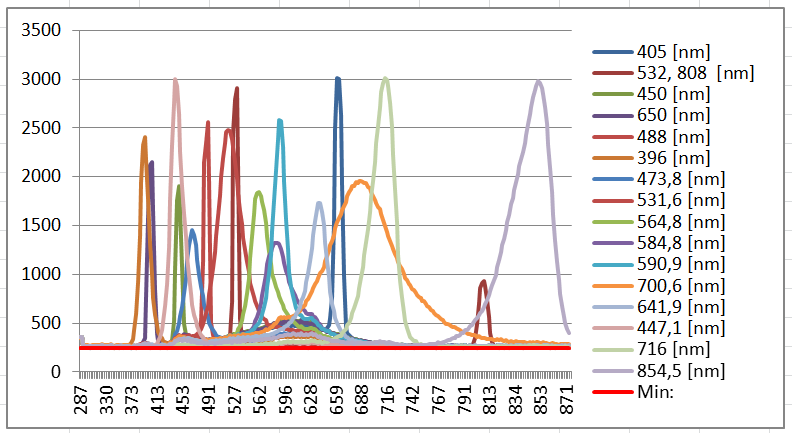
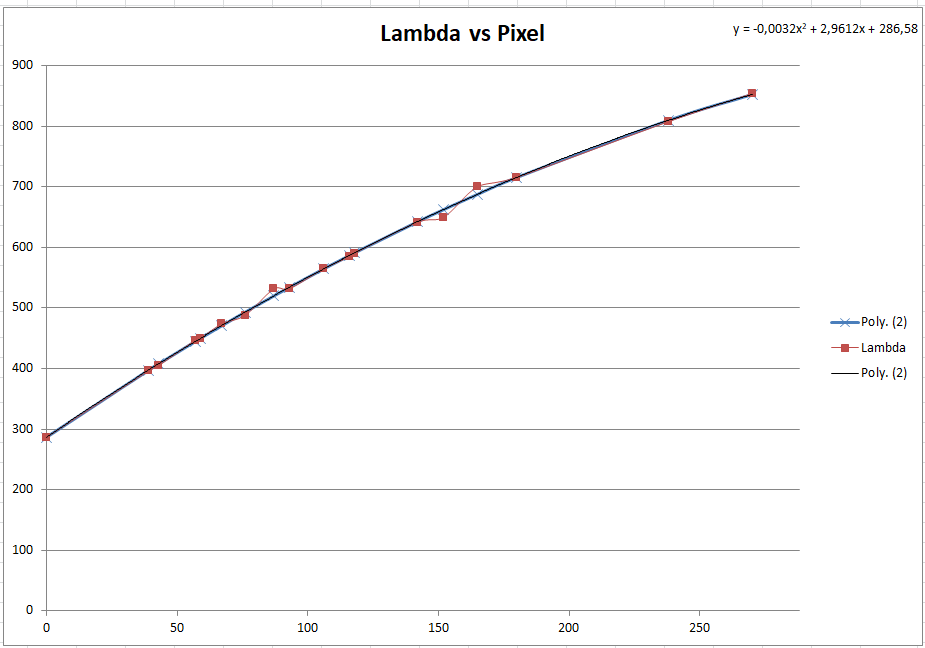
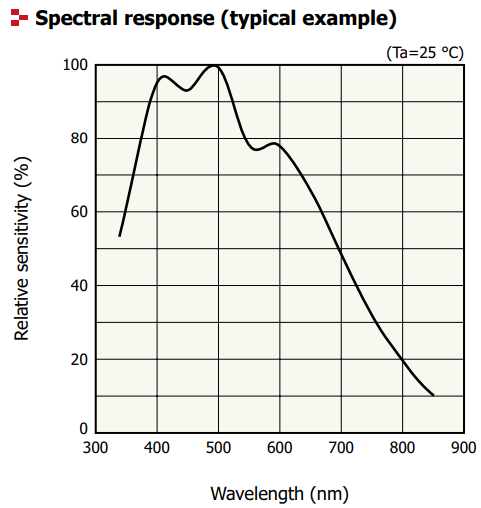
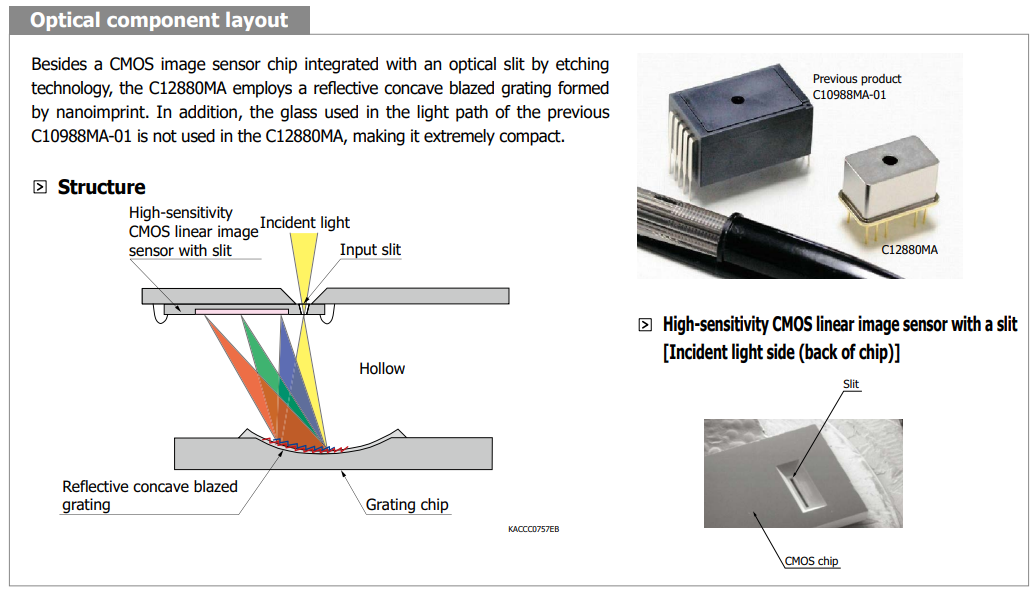
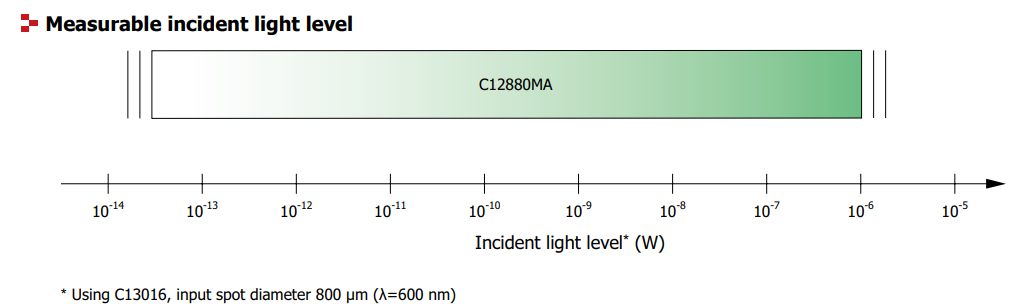
288 Ch. Spectrometer (C12880MA)
Test:
- Auto integration Time
- Peak detect
- Waterfall Diagram
Measuring Transmission Coefficient:
Test:
- normal and dynamic optical filter
- in raw & waterfall imaging
- Wavelength selection with transmission coeff. output [%]
Measuring Reflection Coefficient:
- Wavelength selection with transmission coeff. output [%]
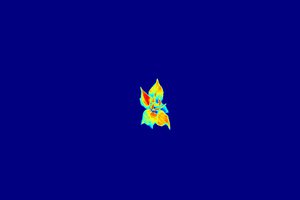
Magnetic Field Imagery:
- 8x8 Hall sensors
- interpolated
- absolute & relative B-Field coded color map
- normal: 30 fps, interpolated: 10 fps, slow mode: 1 fps
Audio FFT with MEMS Mic (ADMP 401):
- Raw Signal plot
- Waterfall diagram: Amplitude over frequencies
- calibrated dBspl meter
- Peak frequency amplitude detect
- 20 fps
Test: Audio Sweep: 20 - 10000 Hz
Thermo Camera (MLX 90640):
- interpolated Image 32x24 to 100x100 px
- min/max over time graph
- Histogram of values in picture
- only 1 fps of possible 2 fps /;
 Mayke
Mayke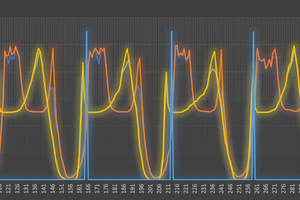
 Simon Merrett
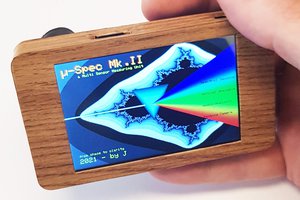

excellent, fantastic, very very good