Close
0%
0%

AIRee

A creative way of visualizing Data on air pollution.

Similar projects worth following
Data visualization usually appears as boring and unilateral for most people. This leads to the consequence of a lot of people missing out on essential informations about their environment and the way it affects their lives.

By placing the AIRee device in the public space we aim to create a signalization for environmental awareness and raise consciousness on how air pollution affects us. Our device combines art and science and will enable people to "see" air pollution being displayed in a creative way.

WHAT PROBLEMS AND NEEDS ARE WE ADDRESSING ?

Air pollution is a serious global challenge with damaging impacts for climate, the environment, and human health. According to several World Health Organization reports, approximately 7 million people die each year worldwide as a consequence of air pollution.

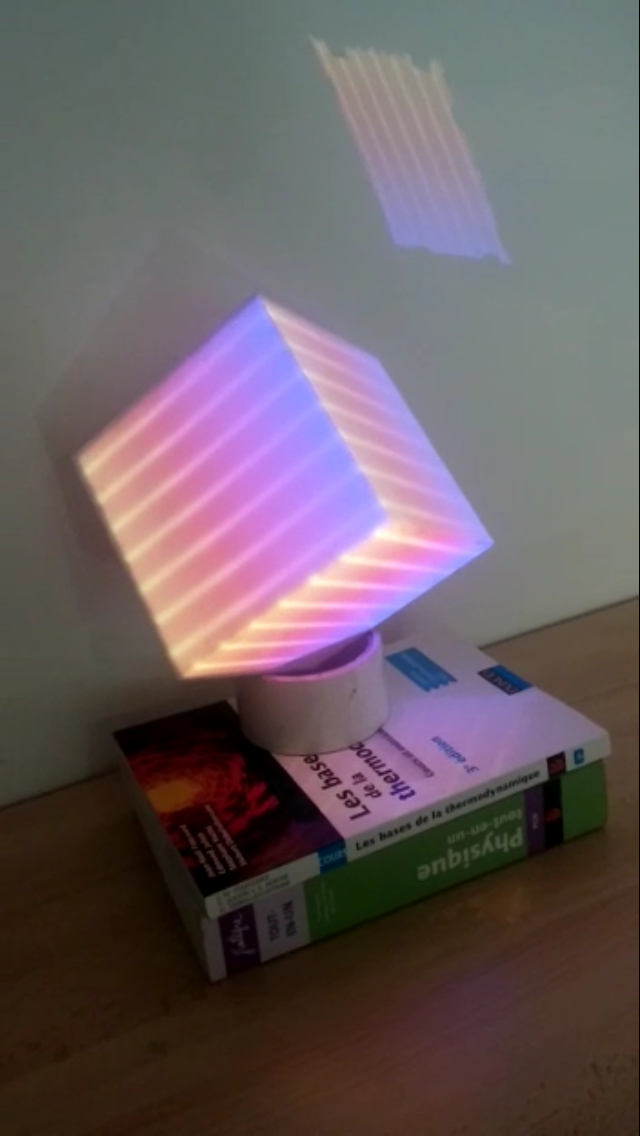
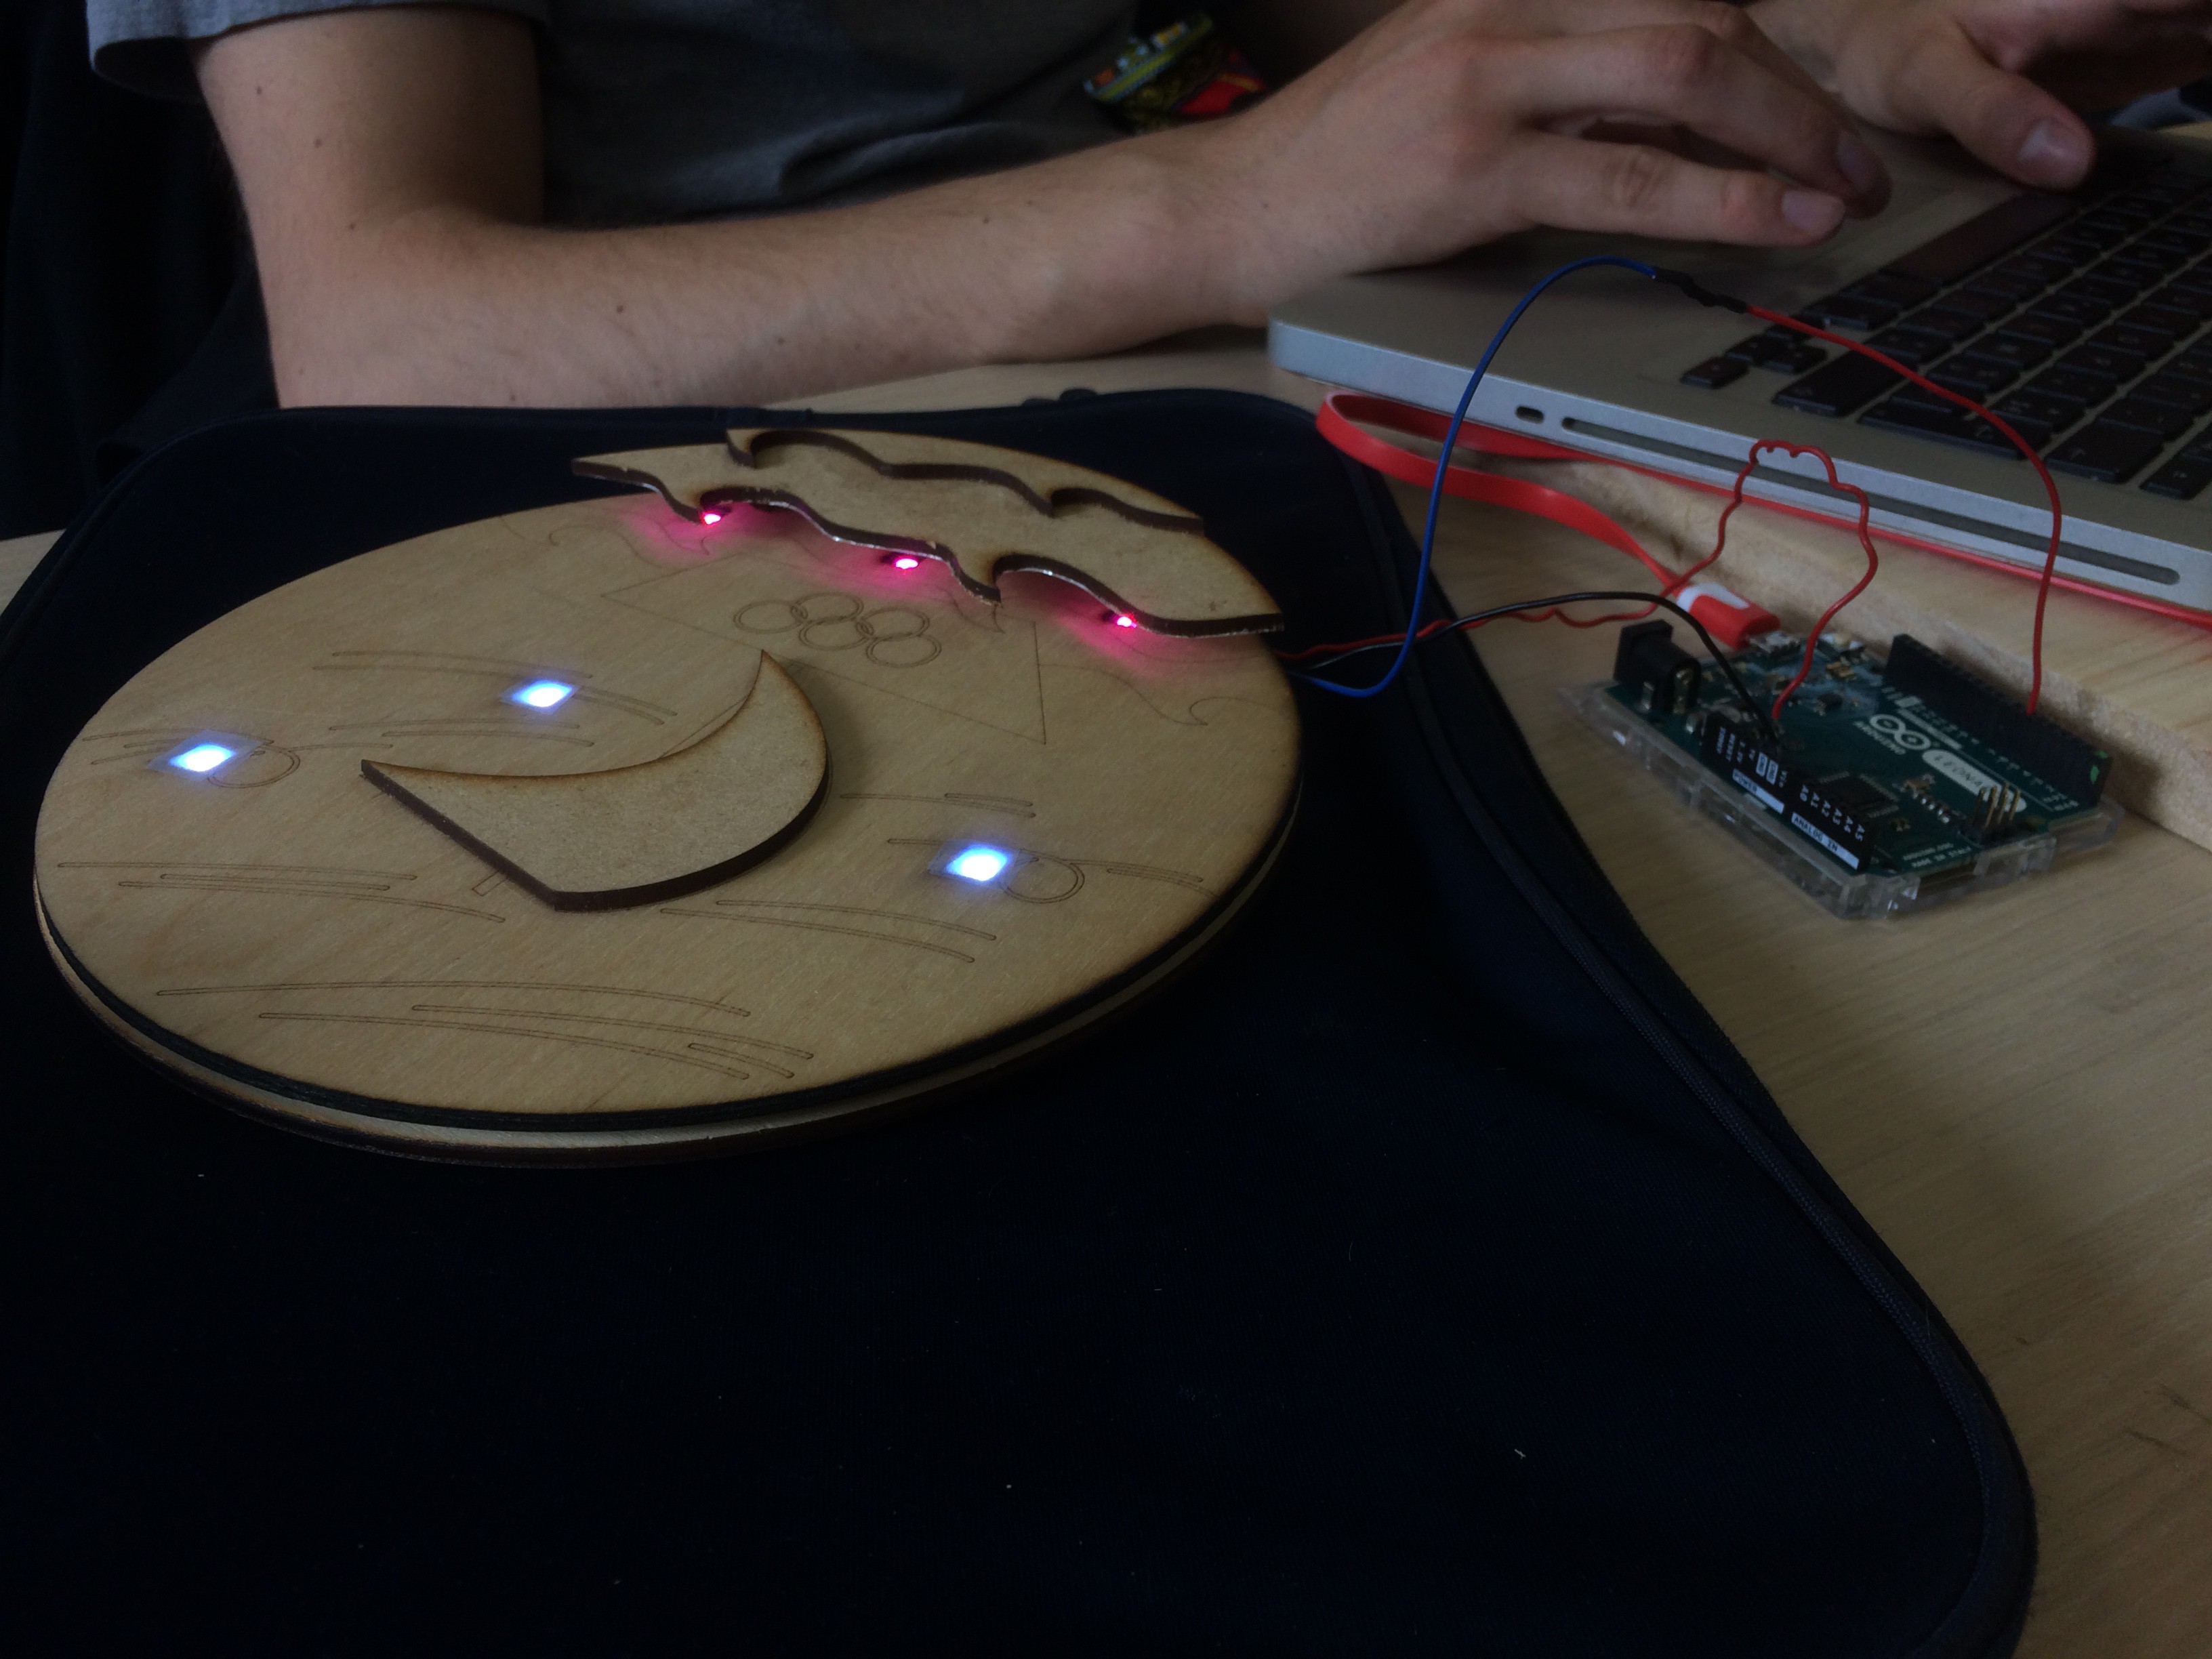
With our device we want to raise awareness on how air pollution affects our lives and the environment around us. Furthermore, we also want to enable people to "see" air pollution, this invisible factor so present in our daily life.

This project is inspired in the UN Sustainable Development Goal 3.9, which targets "substantially reducing the number of deaths and illnesses from hazardous chemicals and air, water and soil pollution and contamination" and UN Sustainable Development Goal 11.6., which targets "reducing the adverse per capita environmental impact of cities, including by paying special attention to air quality and municipal and other waste management".

AIRee tackles not only the UN Sustainable Development Goals for 2030, but also the environmental improvement goals for the Olympic Games taking place in Paris in 2024.

  • 1 × Arduino Leonardo
  • 4 × Adafruit NeoPixel Digital RGB LED Capacitors / Aluminum Electrolytic
  • 1 × Wood plate 20cm diameter for the main plate and extra wood pieces for the other layers (waves etc.)
  • 20 × Wires
  • 1 × Aluminium foil

View all 7 components

  • How to signalise ?

    paul.lemaignan09/04/2017 at 08:36 0 comments

    Showing to the public some informations in a simple way is not evident. 

    We came with the idea of showing the Paris emblem that we refine in modern way.


    We put the Emblem in a circle that is a very impacting form.


    We add on the boat design the five wheel from Olympics Games because of Paris's ongoing work of decreasing air pollution for 2024 Olympics. 

    And to show the information what a better way than light? So we had some LED all around. It has an aspect of clock that people find familiar and their eyes go from left to right naturally.

  • Development and research results :

    Manuela Mo08/10/2017 at 19:10 0 comments

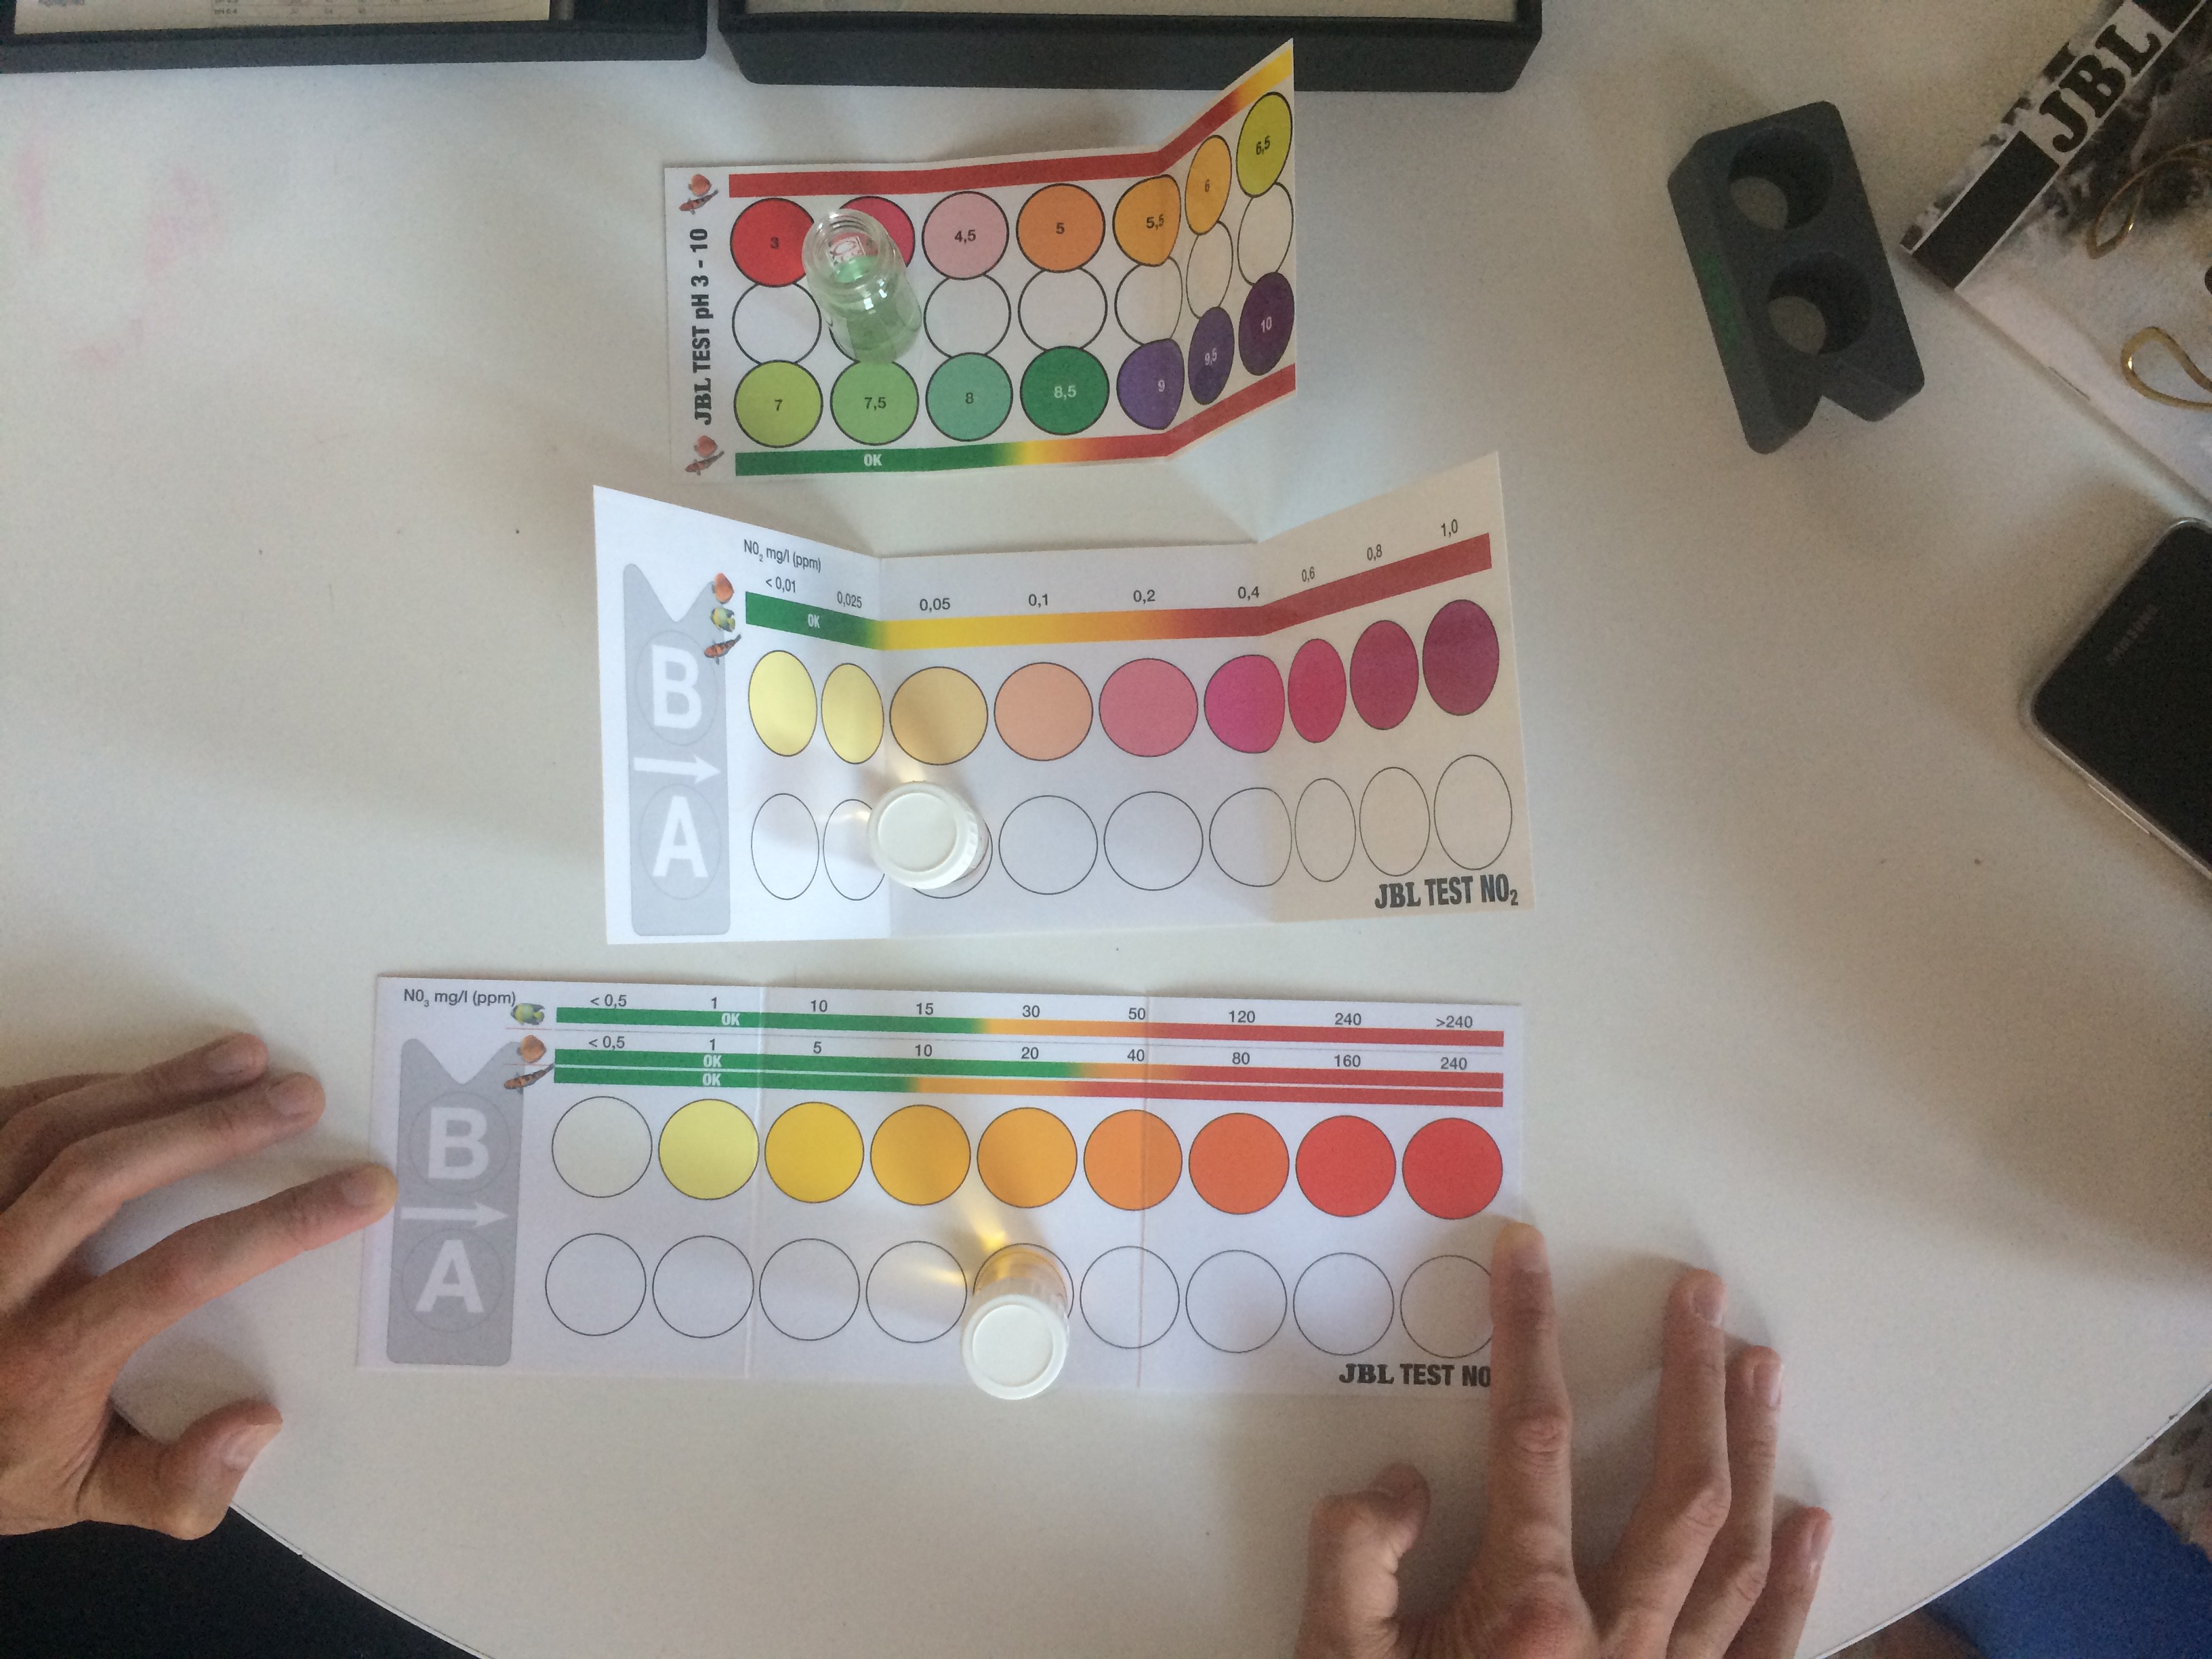
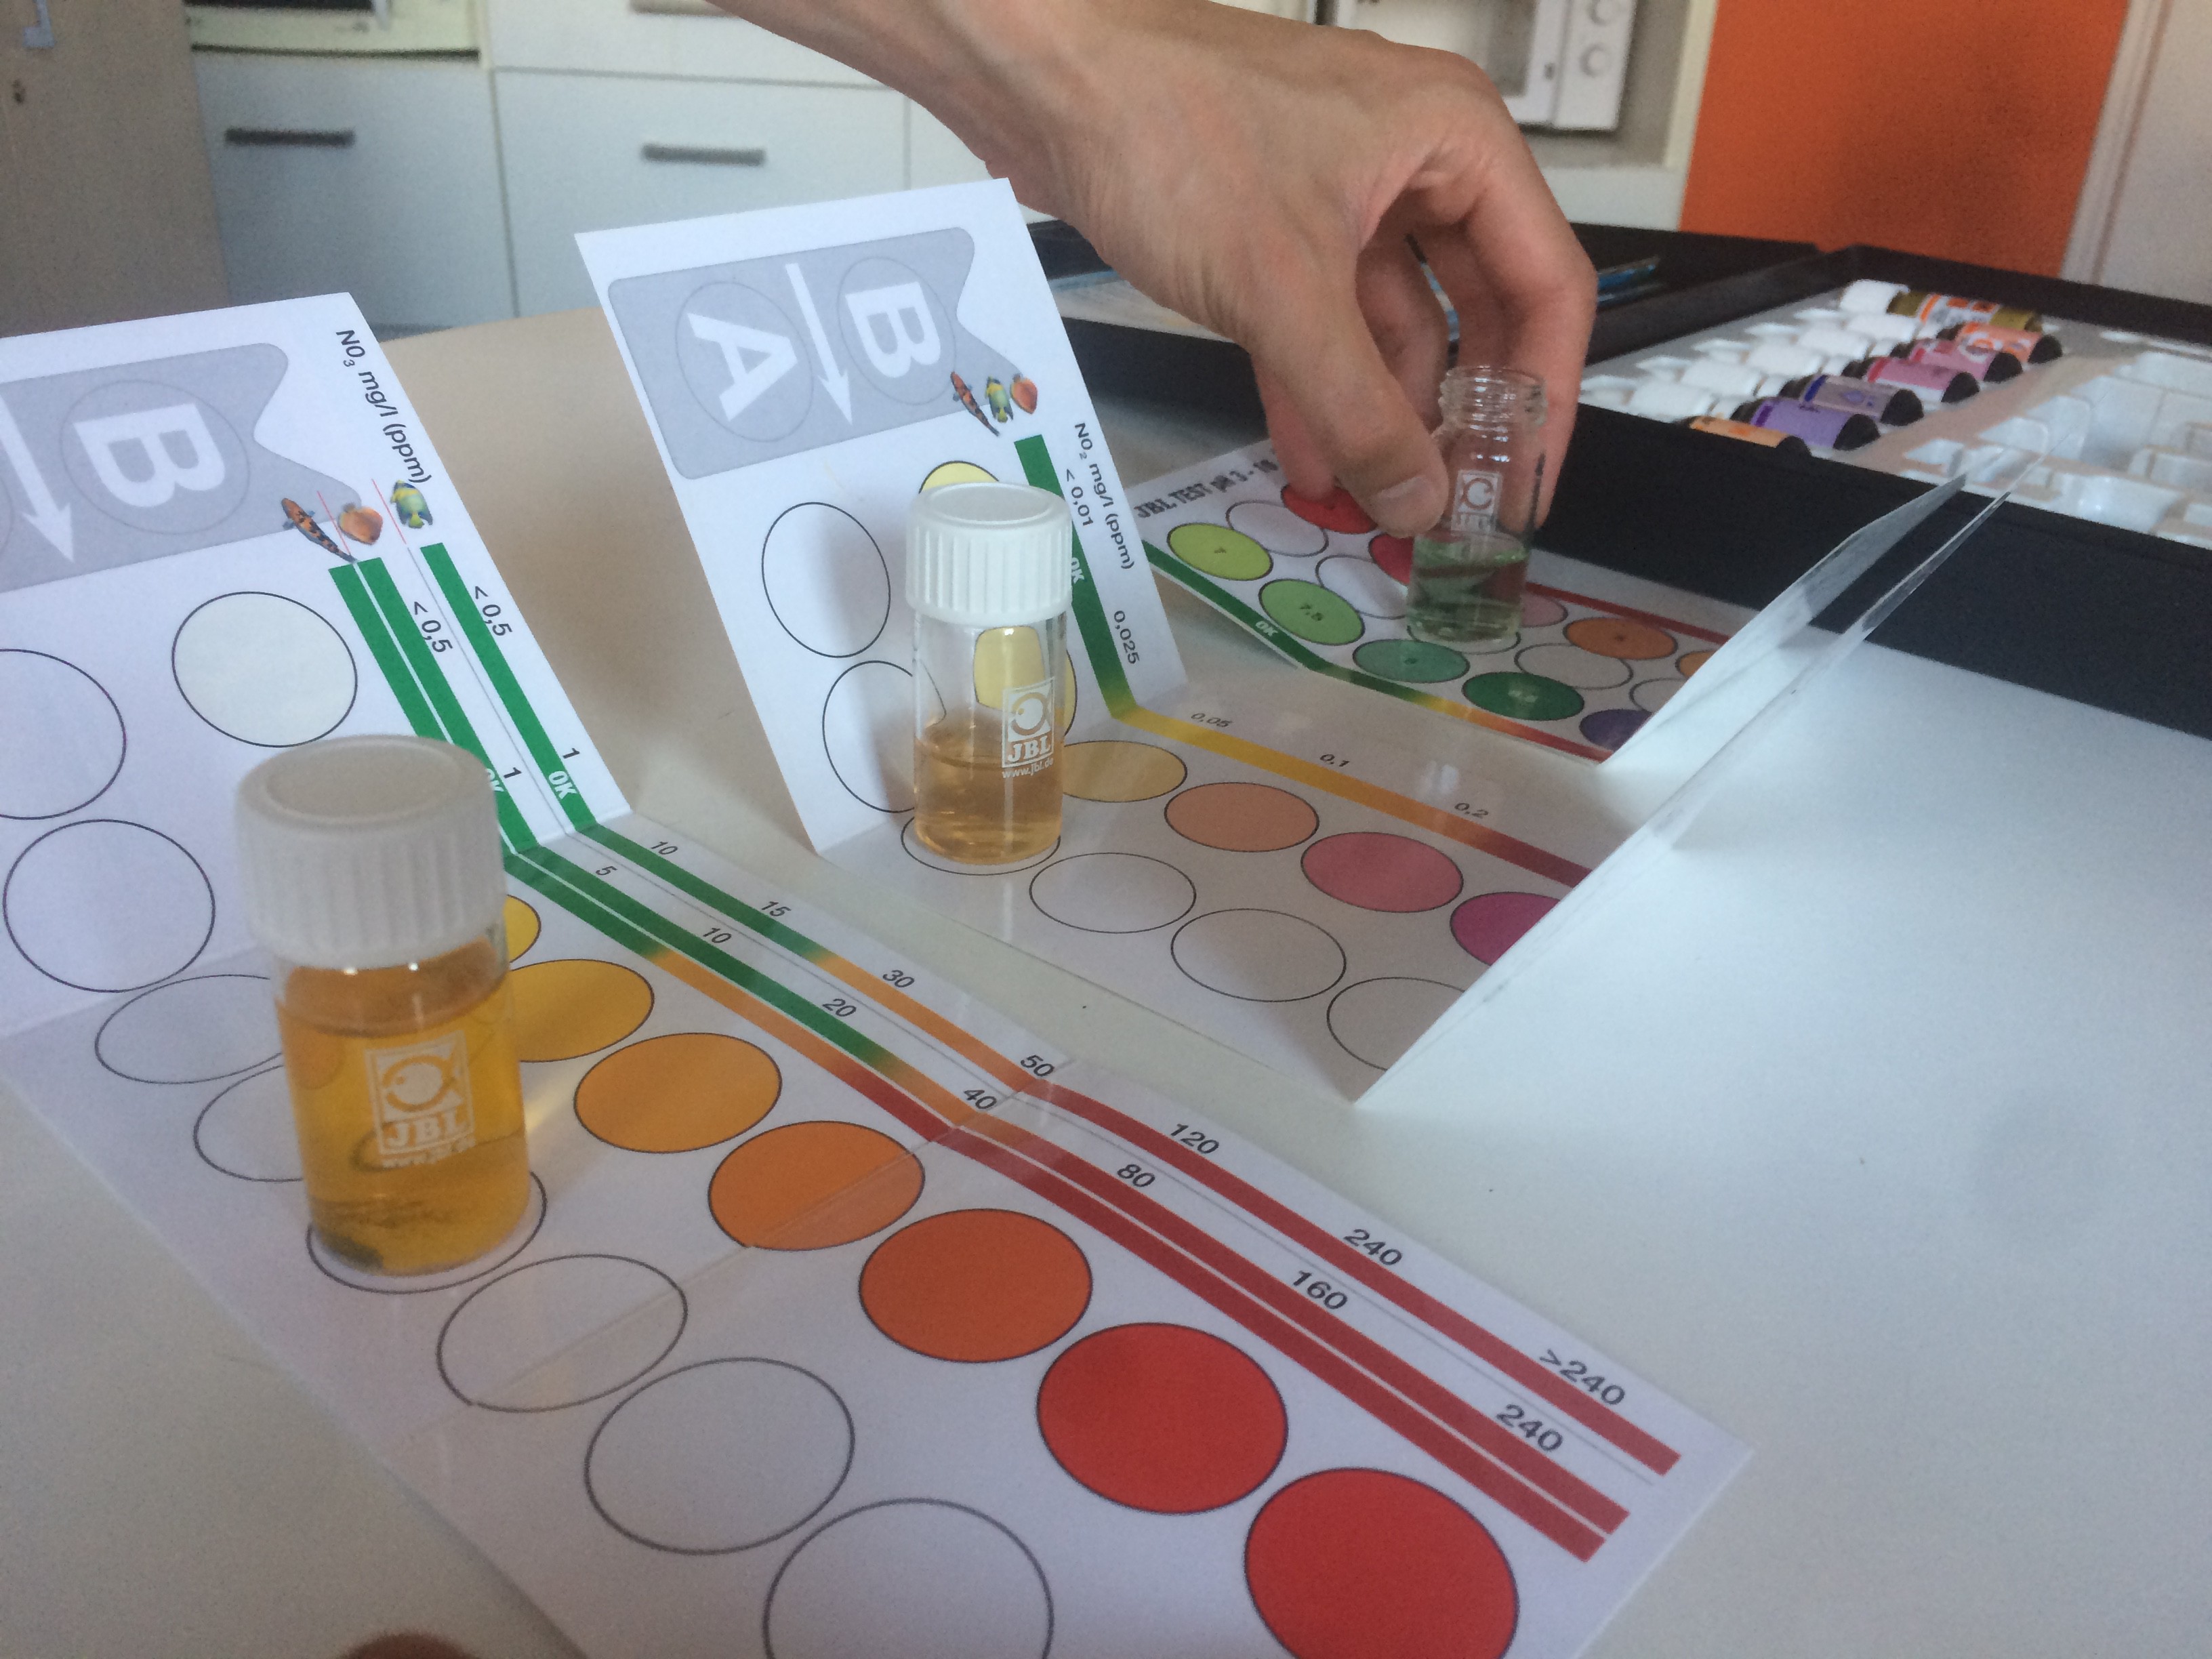
    JBL test for pH, NO3 and NO2


    According to our research, there are no accessible and simple devices that can measure water quality and identify the pollution level in water accurately. After testing pH, NO2 and NO3 with the chemical test from JBL (which can be easily purchased on Amazon) we found out that it's possible to identify the presence of these substances, but the level of concentration is only determined by the water color and its correspondence to the colors on the given JBL value scale. In this way, from a chemical point of view it is very hard to determine the precise concentration of specific substances in the water. 

    Having this limitation in mind, in the next step we brainstormed on creative ways of visualizing air and water pollution data.
    We visited the farm in Normandy and did a water test workshop with the children.

    Some of the ideas that arose through the brainstorming were: visualizing data through visual mapping, creating kinetic origamis moving in real-time according to the measured pollution index, and lastly, an air and water pollution indicating device aimed for the public space in Paris (i.e. bus stops, metro entrances, public squares).
    We imagined this device having Neopixel RGB LEDs, that would be programmed with an Arduino and change colors according to the data on air and water pollution.


    First visual mapping prototype (just testing how the technical part of it)

    First prototype for the idea of a kinetic origami moving in real-time according to the measured pollution index.

    And lastly the prototype we chose to build up on for the rest of the project time :

    This object was designed with Blender, materialized in the form of a wood plate with different layers and shaped in with a laser cut machine. It displays a navigating boat on its surface, making a reference to the emblem of the City of Paris.
    The emblem of the City of Paris is a representation of the motto "Fluctuat nec mergitur" , meaning "Tossed by the waves but never sinks". By using this reference our message is that the fight against the air pollution in Paris should be seen like this boat, that despite the destabilizing waves, never sinks or stops heading forward. 
    As an outcome of these steps of our project we decided to focus more on air pollution, because we found the corresponding data to be easier to be accessed and measured. 

    To one of the upper 'wave' layer we added an Aluminium foil to create an interesting effect of color dispersion. 

    In the following step we built a NeoPixel Digital RGB LED Strip circuit, connected it to an Arduino board (which is connected to the laptop via a USB cable) and programmed it to light up the desired color combination at the desired time intervalls.

    As the team member who was executing this step was a total beginner in Arduino with the help of YouTube video tutorials she managed to add the Neopixel Library to the Arduino software and test the Neopixel LED with the already existing samples, named as 'Examples' in the Arduino Library section. In that way you already have a pre-fabricated code, that you can just run on your Arduino board and make the Neopixel units light up.

    After that we installed the RGB circuit into the four holes of the wood plate and controlled it through the Arduino software. Moreover, we added a 9V Battery to the circuit, so that it could become a portable device.


  • The initial idea

    Manuela Mo08/10/2017 at 19:02 0 comments

    The project idea started with the ambition of creating a device that measures the level of pollution in water and which is integrated in an artistic sculpture. According to the level of the tested substances’ concentrations (and pollution) the sculpture would change its form and/or color, representing the obtained results in real-time.

    The device was requested by the owner of the “Ferme Européenne des Enfants", a pedagogical farm in Normandy, France, aimed for children to learn about the traditional and ecological/organic farm life (milking the cow, picking eggs, shaving sheeps' wool, feeding) and ecological awareness.

    First Brainstorming for the project

    Creating our first Origami prototypes for the project.

View all 3 project logs

  • 1
    AIRee Pollution Clock
    #include <Adafruit_NeoPixel.h>
    #ifdef __AVR__
      #include <avr/power.h>
    #endif
    // Which pin on the Arduino is connected to the NeoPixels?
    // On a Trinket or Gemma we suggest changing this to 1
    #define PIN 6
    // How many NeoPixels are attached to the Arduino?
    #define NUMPIXELS      48
    // How much brightness for the LEDs (from 0-255)?
    #define BRIGHTNESS     255
    // How many different colors?
    #define NUMCOLORS      7
    // Parameter 1 = number of pixels in strip
    // Parameter 2 = Arduino pin number (most are valid)
    // Parameter 3 = pixel type flags, add together as needed:
    //   NEO_KHZ800  800 KHz bitstream (most NeoPixel products w/WS2812 LEDs)
    //   NEO_KHZ400  400 KHz (classic 'v1' (not v2) FLORA pixels, WS2811 drivers)
    //   NEO_GRB     Pixels are wired for GRB bitstream (most NeoPixel products)
    //   NEO_RGB     Pixels are wired for RGB bitstream (v1 FLORA pixels, not v2)
    //   NEO_RGBW    Pixels are wired for RGBW bitstream (NeoPixel RGBW products)
    Adafruit_NeoPixel strip = Adafruit_NeoPixel(NUMPIXELS, PIN, NEO_GRB + NEO_KHZ800);
    Adafruit_NeoPixel pixels = Adafruit_NeoPixel(NUMPIXELS, PIN, NEO_GRB + NEO_KHZ800);
    // IMPORTANT: To reduce NeoPixel burnout risk, add 1000 uF capacitor across
    // pixel power leads, add 300 - 500 Ohm resistor on first pixel's data input
    // and minimize distance between Arduino and first pixel.  Avoid connecting
    // on a live circuit...if you must, connect GND first.
    // Input a value 0 to 255 to get a color value.
    // The colours are a transition r - g - b - back to r.
    uint32_t Wheel(byte WheelPos) {
      WheelPos = 255 - WheelPos;
      if(WheelPos < 85) {
        return strip.Color(255 - WheelPos * 3, 0, WheelPos * 3);
      }
      if(WheelPos < 170) {
        WheelPos -= 85;
        return strip.Color(0, WheelPos * 3, 255 - WheelPos * 3);
      }
      WheelPos -= 170;
      return strip.Color(WheelPos * 3, 255 - WheelPos * 3, 0);
    }
      int delayval = 100; // delay between each light show for the pollution values
      int delayval1 = 500; // delay between show of white light and start of pollution values
      int delayval2 = 5000; // 
      int pollutionValues[NUMPIXELS]; // list of pollution values
      int thresholdValues[NUMCOLORS] = {0, 21, 43, 61, 81, 100}; // Thresholds for the categories of pollution values
      int redColors[NUMCOLORS] = {0, 0, 0, 255, 255, 255}; // Values on red scale for the pollution categories
      int greenColors[NUMCOLORS] = {0, 255, 255, 255, 53, 0}; // Values on green scale for the pollution categories
      int blueColors[NUMCOLORS] = {0, 255, 0, 0, 0, 0}; // Values on blue scale for the pollution categories
      
    void setup() {
      // This is for Trinket 5V 16MHz, you can remove these three lines if you are not using a Trinket
      #if defined (__AVR_ATtiny85__)
        if (F_CPU == 16000000) clock_prescale_set(clock_div_1);
      #endif
      // End of trinket special code
      strip.begin();
      strip.show(); // Initialize all pixels to 'off'
    }
    void rainbowCycle(uint8_t wait) {
      uint16_t i, j;
      for(j=0; j<256*1; j++) { // 1 cycle of all colors on wheel
        for(i=0; i< strip.numPixels(); i++) {
          strip.setPixelColor(i, Wheel(((i * 256 / strip.numPixels()) + j) & 255));
        }
        strip.show();
        delay(wait);
      }
    }
    void loop() {
      //initialisation: show of pollution scale with arbitrary pollution values
      for (int i=0; i<NUMPIXELS; i++) {
        pollutionValues[i] = 2 * i;
      }
      for (int i=0; i<NUMPIXELS; i++) {
        // Iterate over the thresholds to find the right pollution category
        for (int j=0; j<NUMCOLORS; j++) {
          if (pollutionValues[i] < thresholdValues[j]) {
            pixels.setPixelColor(i, pixels.Color(redColors[j],greenColors[j],blueColors[j]));
            pixels.show();
            delay(delayval);
            break;
          }
        }
      }
      //rainbow animation
      rainbowCycle(6);
        
      for (int i=0; i<NUMPIXELS; i++) {
        pixels.setPixelColor(i, pixels.Color(80,80,80));
      }
      pixels.show();
      delay(delayval1);
      // Show of pollution values since beginning of the year
      int pollutionValuesBis[NUMPIXELS] = {43, 52, 91, 45, 36, 93, 62, 28, 26, 59, 21, 47, 28, 57, 33, 25, 36, 18, 30, 34, 27, 29, 41, 19, 29, 25, 25, 18, 30, 38, 44, 61, 37, 44, 45, 39, 34, 41, 40, 56, 42, 36, 35, 54, 81, 56, 38, 66};
      //int pollutionValuesLast[NUMPIXELS] = {30, 38, 44, 61, 37, 44, 45, 39, 34, 41, 40, 56, 42, 36, 35, 54, 81, 56, 38, 66};//
      for (int i=0; i<NUMPIXELS; i++) {
        pollutionValues[i] = pollutionValuesBis[i];
      }
      // [UPDATE LED]
      for (int i=0; i<28; i++) {
        // Iterate over the thresholds to find the right pollution category
        for (int j=0; j<NUMCOLORS; j++) {
          if (pollutionValues[i] < thresholdValues[j]) {
            pixels.setPixelColor(i, pixels.Color(redColors[j],greenColors[j],blueColors[j]));
            pixels.show();
            delay(delayval);
            break;
          }
        }
      }
      for (int i=28; i<29; i++) {
        for (int j=0; j<NUMCOLORS; j++) {
          if (pollutionValues[i] < thresholdValues[j]) {
            pixels.setPixelColor(i, pixels.Color(redColors[j],greenColors[j],blueColors[j]));
            pixels.show();
            delay(delayval);
            break;
          }
        }
      }
      // for later dates than our date: show of last year's pollution levels
      for (int i=29; i<NUMPIXELS; i++) {
        for (int j=0; j<NUMCOLORS; j++) {
          if (pollutionValues[i] < thresholdValues[j]) {
            pixels.setPixelColor(i, pixels.Color(redColors[j]/50,greenColors[j]/50,blueColors[j]/50));
            pixels.show();
            delay(delayval);
            break;
          }
        }
      }
      // blink of current week LED
      int var = 0;
      while(var < 15){
        for (int i=28; i<29; i++) {
          for (int j=0; j<NUMCOLORS; j++) {
            if (pollutionValues[i] < thresholdValues[j]) {
              pixels.setPixelColor(i, pixels.Color(redColors[j],greenColors[j],blueColors[j]));
              pixels.show();
              delay(delayval1);
              pixels.setPixelColor(i, pixels.Color(0,0,0));
              pixels.show();
              delay(delayval1);
              break;
            }
          }
        }
      var++;
      }
      // turn off all LEDs before restarting the loop
      for (int i=0; i<NUMPIXELS; i++) {
        pixels.setPixelColor(i, pixels.Color(0,0,0));
      }
      pixels.show();
      delay(delayval);
    }

View all instructions

Enjoy this project?

Share

Discussions

Similar Projects

Does this project spark your interest?

Become a member to follow this project and never miss any updates