Radu Motisan
-
Server Upgrade / SITE V4.0
09/13/2015 at 21:25 • 0 comments![]()
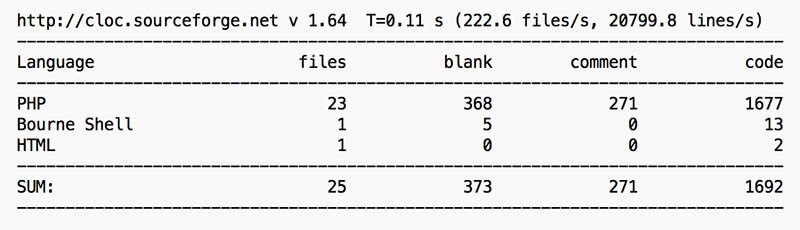
The complexity of the uRADMonitor system stretches from a multitude of compact hardware detectors capable of sensing the invisible ionising radiation and air quality, to the big data software solutions that can handle the huge amounts of data in real time. With the network spreading at a fast pace, periodic upgrades on the server side are a must, in order to provide a high quality, uninterrupted service.
![]()
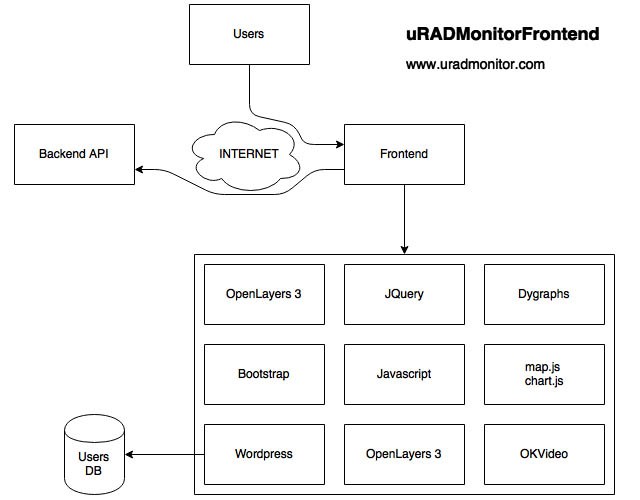
This uRADMonitor server upgrade improves both the backend and the frontend. While the former brings a more efficient big-data-ready database implementation and RESTFul APIs for robust data access, the latter was shaped in a modern user interface with animated maps and interactive charts. The Backend and the Frontend are hosted on separated servers.
The Backend or data.uradmonitor.comThis is a separate server, in charge of the system database and the uRADMonitor RESTful APIs. It’s purpose is to provide input/output real time data operations via a mature API interface. It receives data from the distributed detectors, and provides data to the frontend, mobile apps and other parties, all via API calls. The data is stored in a big-data ready database.
![]()
The RESTful API methods are properly organised, and the code can be extended to support additional calls. Currently the following APIs are supported, all using JSON formatted data:
[POST] http://data.uradmonitor.com/api/v1/upload/e1/[encrypted data] , used by the uRADMonitor units to upload data
[GET] http://data.uradmonitor.com/api/v1/devices , used to retrieve the content of the summary table, the complete list of units in the network and their basic parameters
[GET] http://data.uradmonitor.com/api/v1/devices/[id] , used to retrieve the list of supported sensors for the specified unit ID
[GET] http://data.uradmonitor.com/api/v1/devices/[id]/[sensor]/[timeinterval] , used to retrieve the measurements for the given ID, sensor and time interval.![]()
Here are a few examples, click to see the output:
The Frontend or www.uradmonitor.com
http://data.uradmonitor.com/api/v1/devices
http://data.uradmonitor.com/api/v1/devices/93000001
http://data.uradmonitor.com/api/v1/devices/110000AA
http://data.uradmonitor.com/api/v1/devices/110000AA/cpm
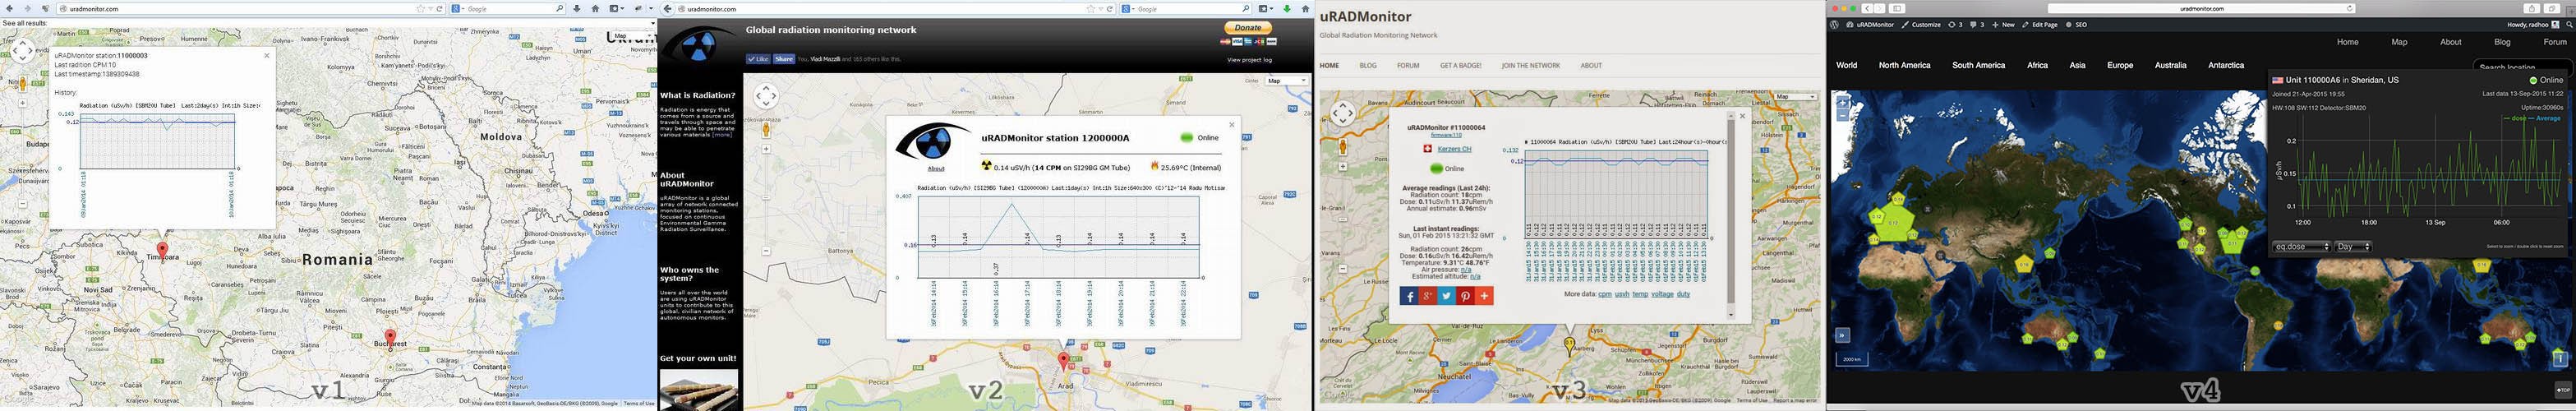
http://data.uradmonitor.com/api/v1/devices/110000AA/cpm/604800This is the visible side of the centralised server system, as it is in charge of generating the webpage showing all radiation and air quality readings. The webpage is a modern implementation using the powerful OpenLayers 3 mapping library. Thanks to JQuery and Dygraphs the data is shown in interactive charts, this time generated on the client side to allow features like local timezone mapping and zooming, highly requested among uRADMonitor users.
The Clusters
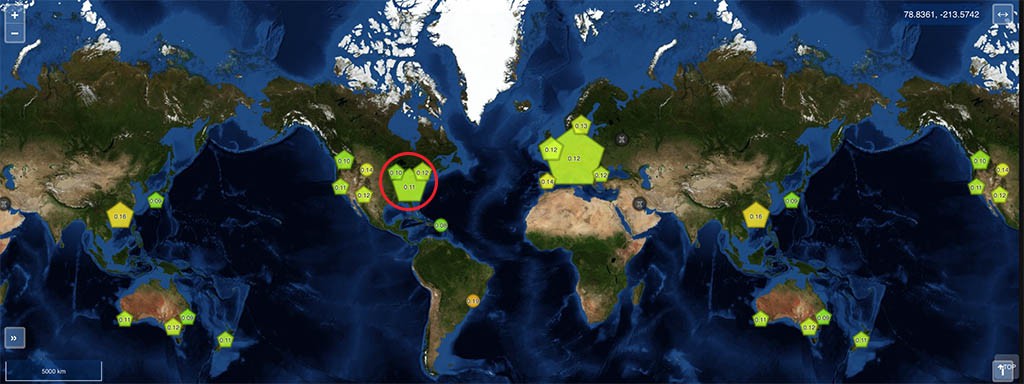
Because of the high number of units on the map, close to 300 uRADMonitor units at the time of writing this article, representing all at far zoom out is impossible, due to obvious overlapping. The solution was to group the close units in clusters, automatically, based on the zoom level. The individual units are represented by circles, while the clusters are pentagons. The bigger the pentagons, the more units they are composed of. Clicking a cluster will unveil its comprising units automatically, by zooming the map to that particular location:![]()
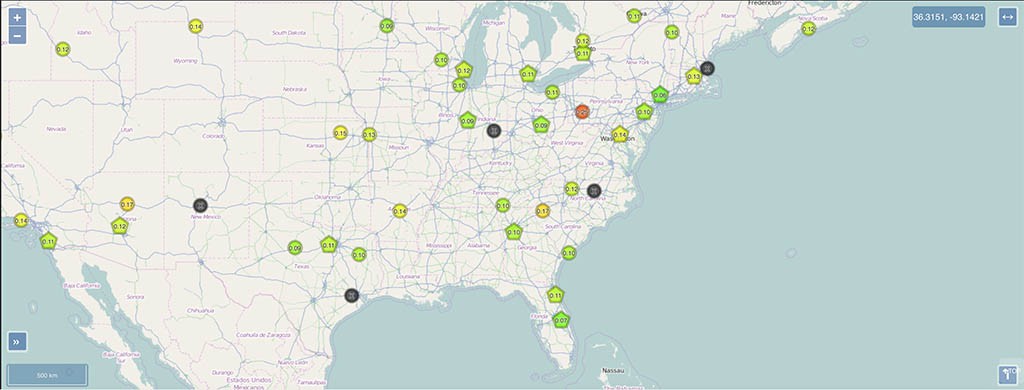
Clicking the highlighted big cluster on the Eastern US territory will zoom the map automatically so the comprising units become visible:
![]()
The colors are a gradient going from green to red, representing the Equivalent Radiation dose in uSv/h measured by that particular detector for the last 24 hours. For clusters, an average between all units contained is calculated instead, while the same color representation is used. Offline units are shown in black.
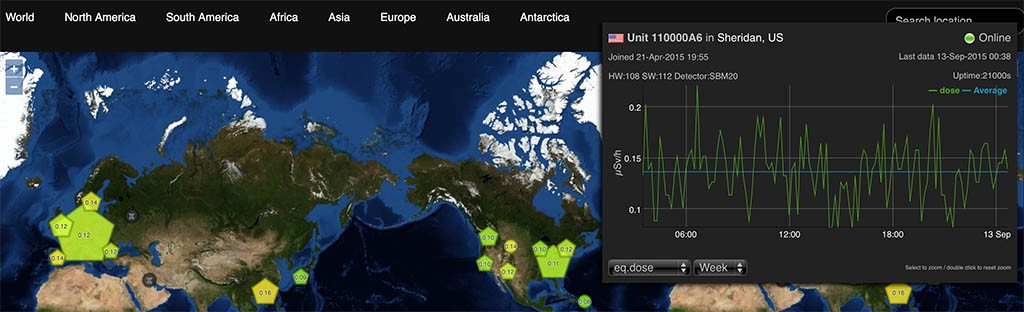
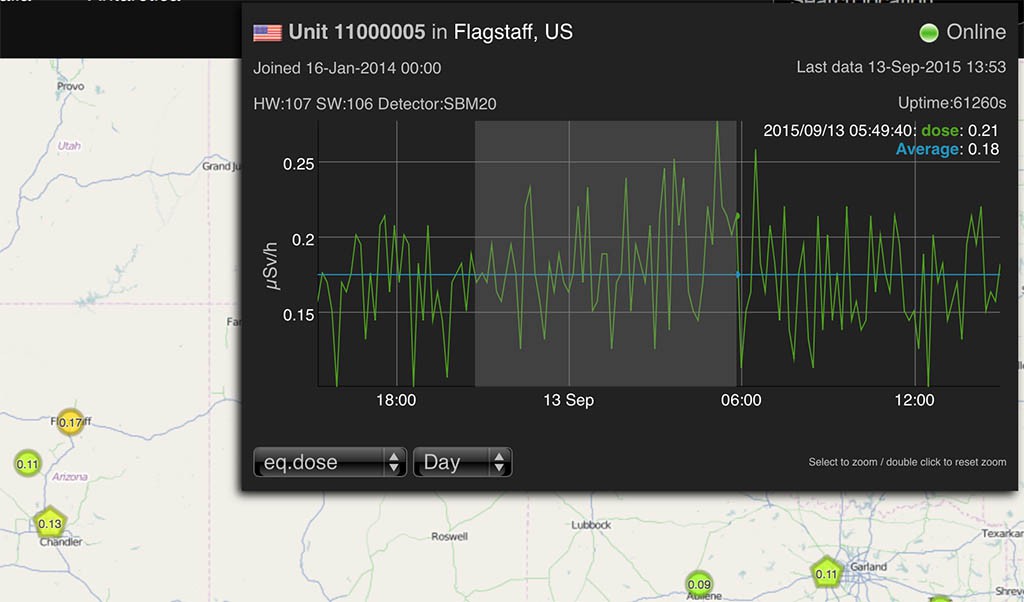
Clicking each individual unit opens a popup, where you can see the interactive chart, and can select the other sensors or a different timeframe. The charts support zooming, by selecting a portion of interest on the chart (click and drag).
The chart lines are shown in green while the average is blue. The details show the time the unit joined the network and the last time data was received. The firmware version and the hardware revision versions are also shown. The resolution is set to 10minutes maximum.![]()
![]() The map menu can be used to jump to various geographical areas, while the “Search location” box takes in any address and resolves the location to geographical coordinates, to jump to the specified place.
The map menu can be used to jump to various geographical areas, while the “Search location” box takes in any address and resolves the location to geographical coordinates, to jump to the specified place.![]()
There are a few improvements planned already, such as showing the units in close proximity (list of closest units and distance to them), full screen charts, comparison between various values and stations, and most important, allowing users to manage their own stations by changing location coordinates or setting alarm thresholds (eg. for radiation or air quality readings).
-
Nominated at CESAwards2015
09/02/2015 at 09:49 • 3 commentsNot a technical log, but an excellent piece of news that is too good to let go. uRADMonitor got into the shortlist of nominees for the Central European Startup Awards 2015, for the Best Cloud/Data application category.
The Central European Startup Awards is a unique series of events in the CEE region, launched in 2014 to gather the best of the best from the CEE startup community. This competition covers 10 countries in Europe (Austria, Poland, Czech Republic, Slovakia, Romania, Bulgaria, Serbia, Croatia, Slovenia, Hungary) and represents a section of the Global Startup Awards initiative.![]()
For the next phase, each of the 10 countries will provide a national winner. There are 8 categories so this means 8 finalists for all competiting countries. The Grand Finale will take place in October in Vienna. The winners of the Romanian competition will be publicly announced on 9th of September.![]() We’re honoured to bear this recognition of our efforts, and are looking forward to continue building on what we have started. uRADMonitor is committed to provide a homogenous global solution for environmental monitoring, using distributed hardware. The newest model tracks 7 environmental parameters and has also been recognised internationally in the Hackaday Prize competition, as one of the 10 finalists of the #BestProduct category.
We’re honoured to bear this recognition of our efforts, and are looking forward to continue building on what we have started. uRADMonitor is committed to provide a homogenous global solution for environmental monitoring, using distributed hardware. The newest model tracks 7 environmental parameters and has also been recognised internationally in the Hackaday Prize competition, as one of the 10 finalists of the #BestProduct category. -
The custom LCD connector
08/31/2015 at 15:40 • 3 commentsThe Beta variants used a custom LCD connector. Initially built in two iterations, the first relied on the XPT2046 touchscreen driver which was eventually discarded due to unforeseen problems presented previously. The second connector was used in the Beta units:
![]()
![]()
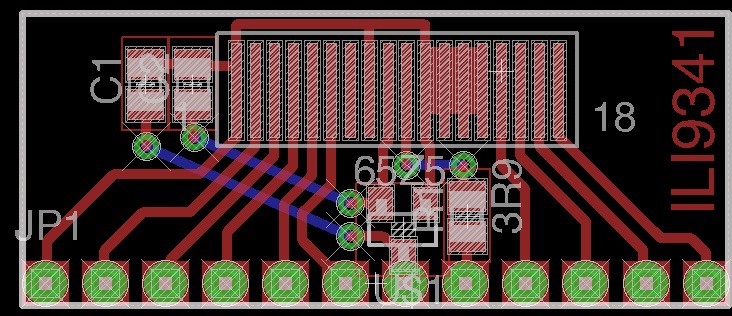
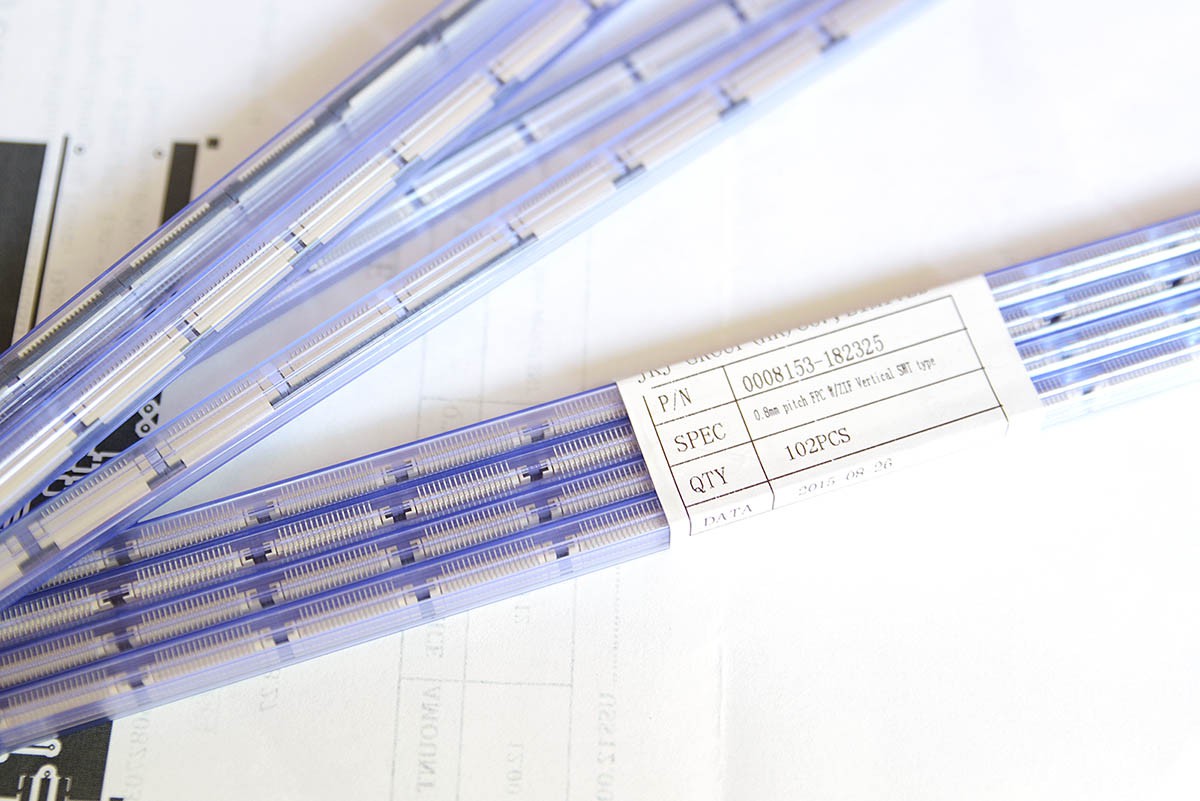
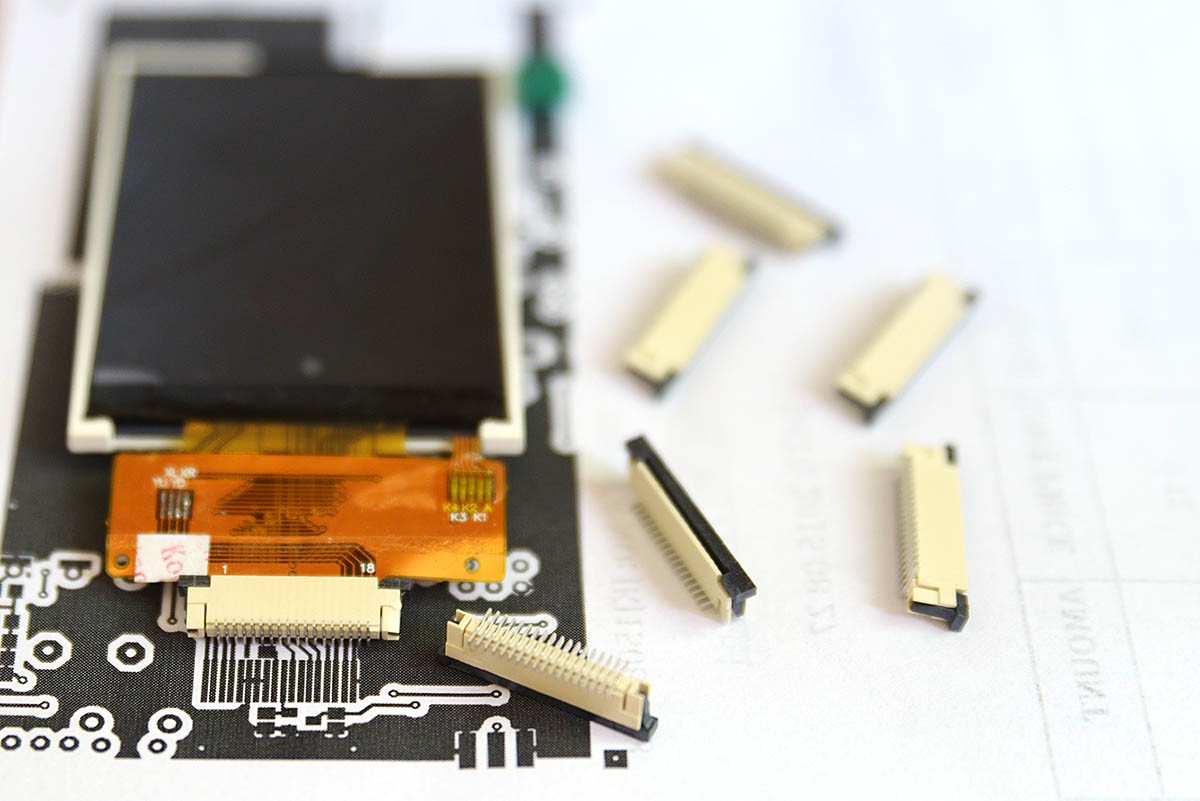
The oversized FPC connector also required a large area to be milled out in the enclosure, to allow assembling. It really had to be replaced by a standard connector. The present iteration puts this new change in place. Finally the connectors have arrived, even before the PCBs:
![]()
![]()
![]()
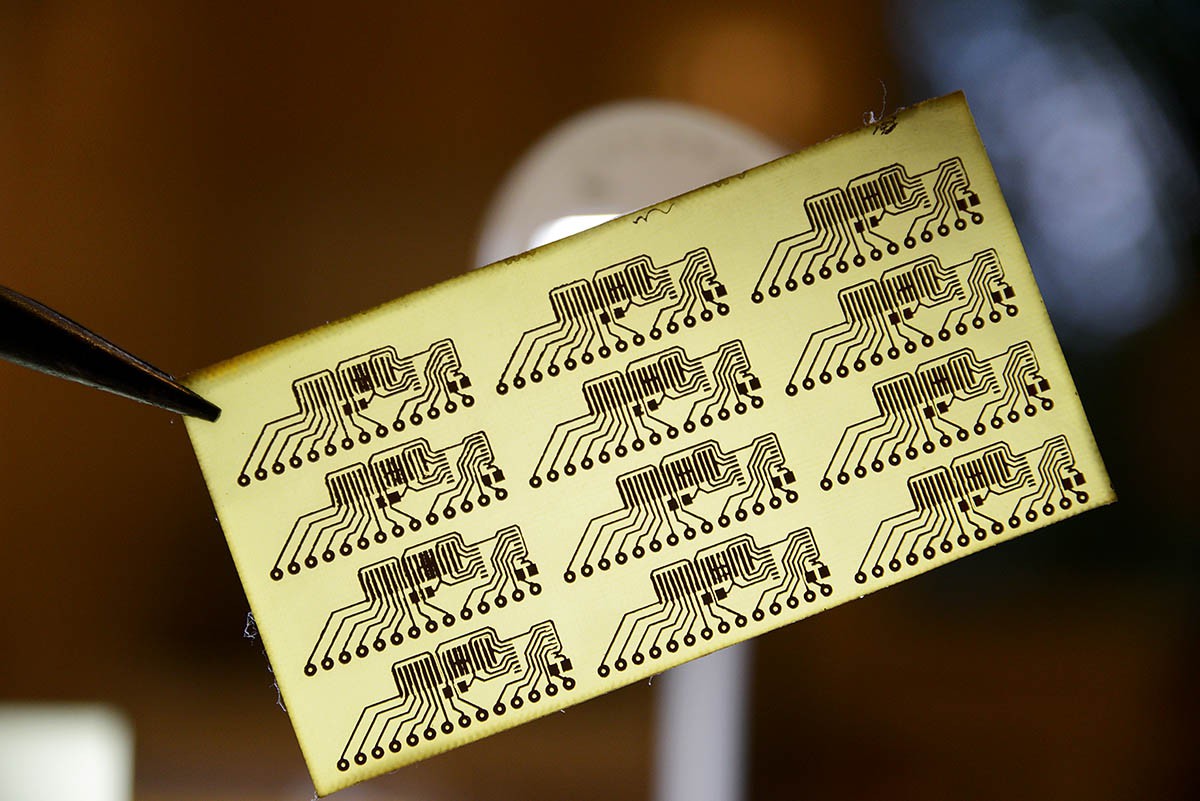
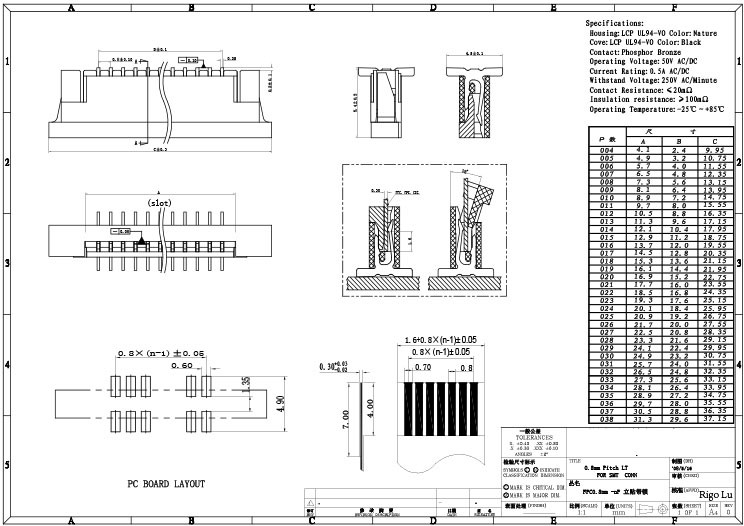
The new FPCs have been custom designed and manufactured, since they required specific parameters such as 0.8mm pitch and 18pins, to fit the ILI9341 connector. And they do. Perfectly, as the pictures show
-
Post Beta hardware iteration
08/23/2015 at 10:52 • 0 commentsFor the Portable Environmental Monitor beta release, both the project summary and the system design document presented some of the things to improve next. The first PCB was fine, but there was a linear regulator wasting power, that had to be replaced. Also, new ideas needed more hardware changes. Here is another hardware iteration (v1.0.102 to implement all that.
The new changes include:![]()
- power efficient Lithium battery voltage converter, using LTC3440. Beta variant used the BL8530 + AMS1117 for 3.3V, wasting some energy as heat. The LTC3440 is a high efficiency, buck-boost DC/DC converter that operates from input voltages above, below or equal to the output voltage, in this case 3.3V.
- the geiger counter circuit now needs a voltage multiplier to be able to jump from 3.3V to 450-500V as needed for the LND712 Geiger tube.
- the ISP connector was changed from 10pin to 6pin to save space on the redundant pins.
- the LCD connector, was in Beta a custom made. Being able to identify a source for prefabricated PCB 0.8mm pitch 18pins connectors, the custom connector was dropped, and this brought a few improvements: the aluminium enclosure doesn't need a huge cut to connect the LCD and the design is more modular, allowing both easy assembling and disassembling.
- external eeprom IC added, to cache the readings locally until an Internet connection becomes available
- RTC IC added, for continuous timekeeping and allow waking up the unit on a predefined interval
- some components were rearranged and some sizes recalculated to make assembling easier
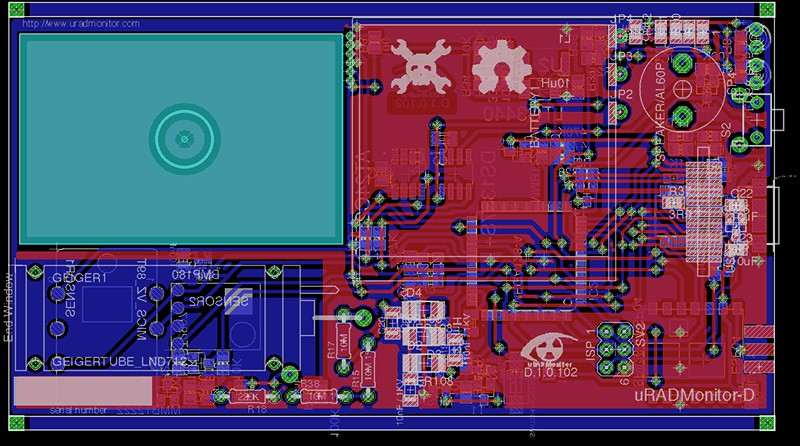
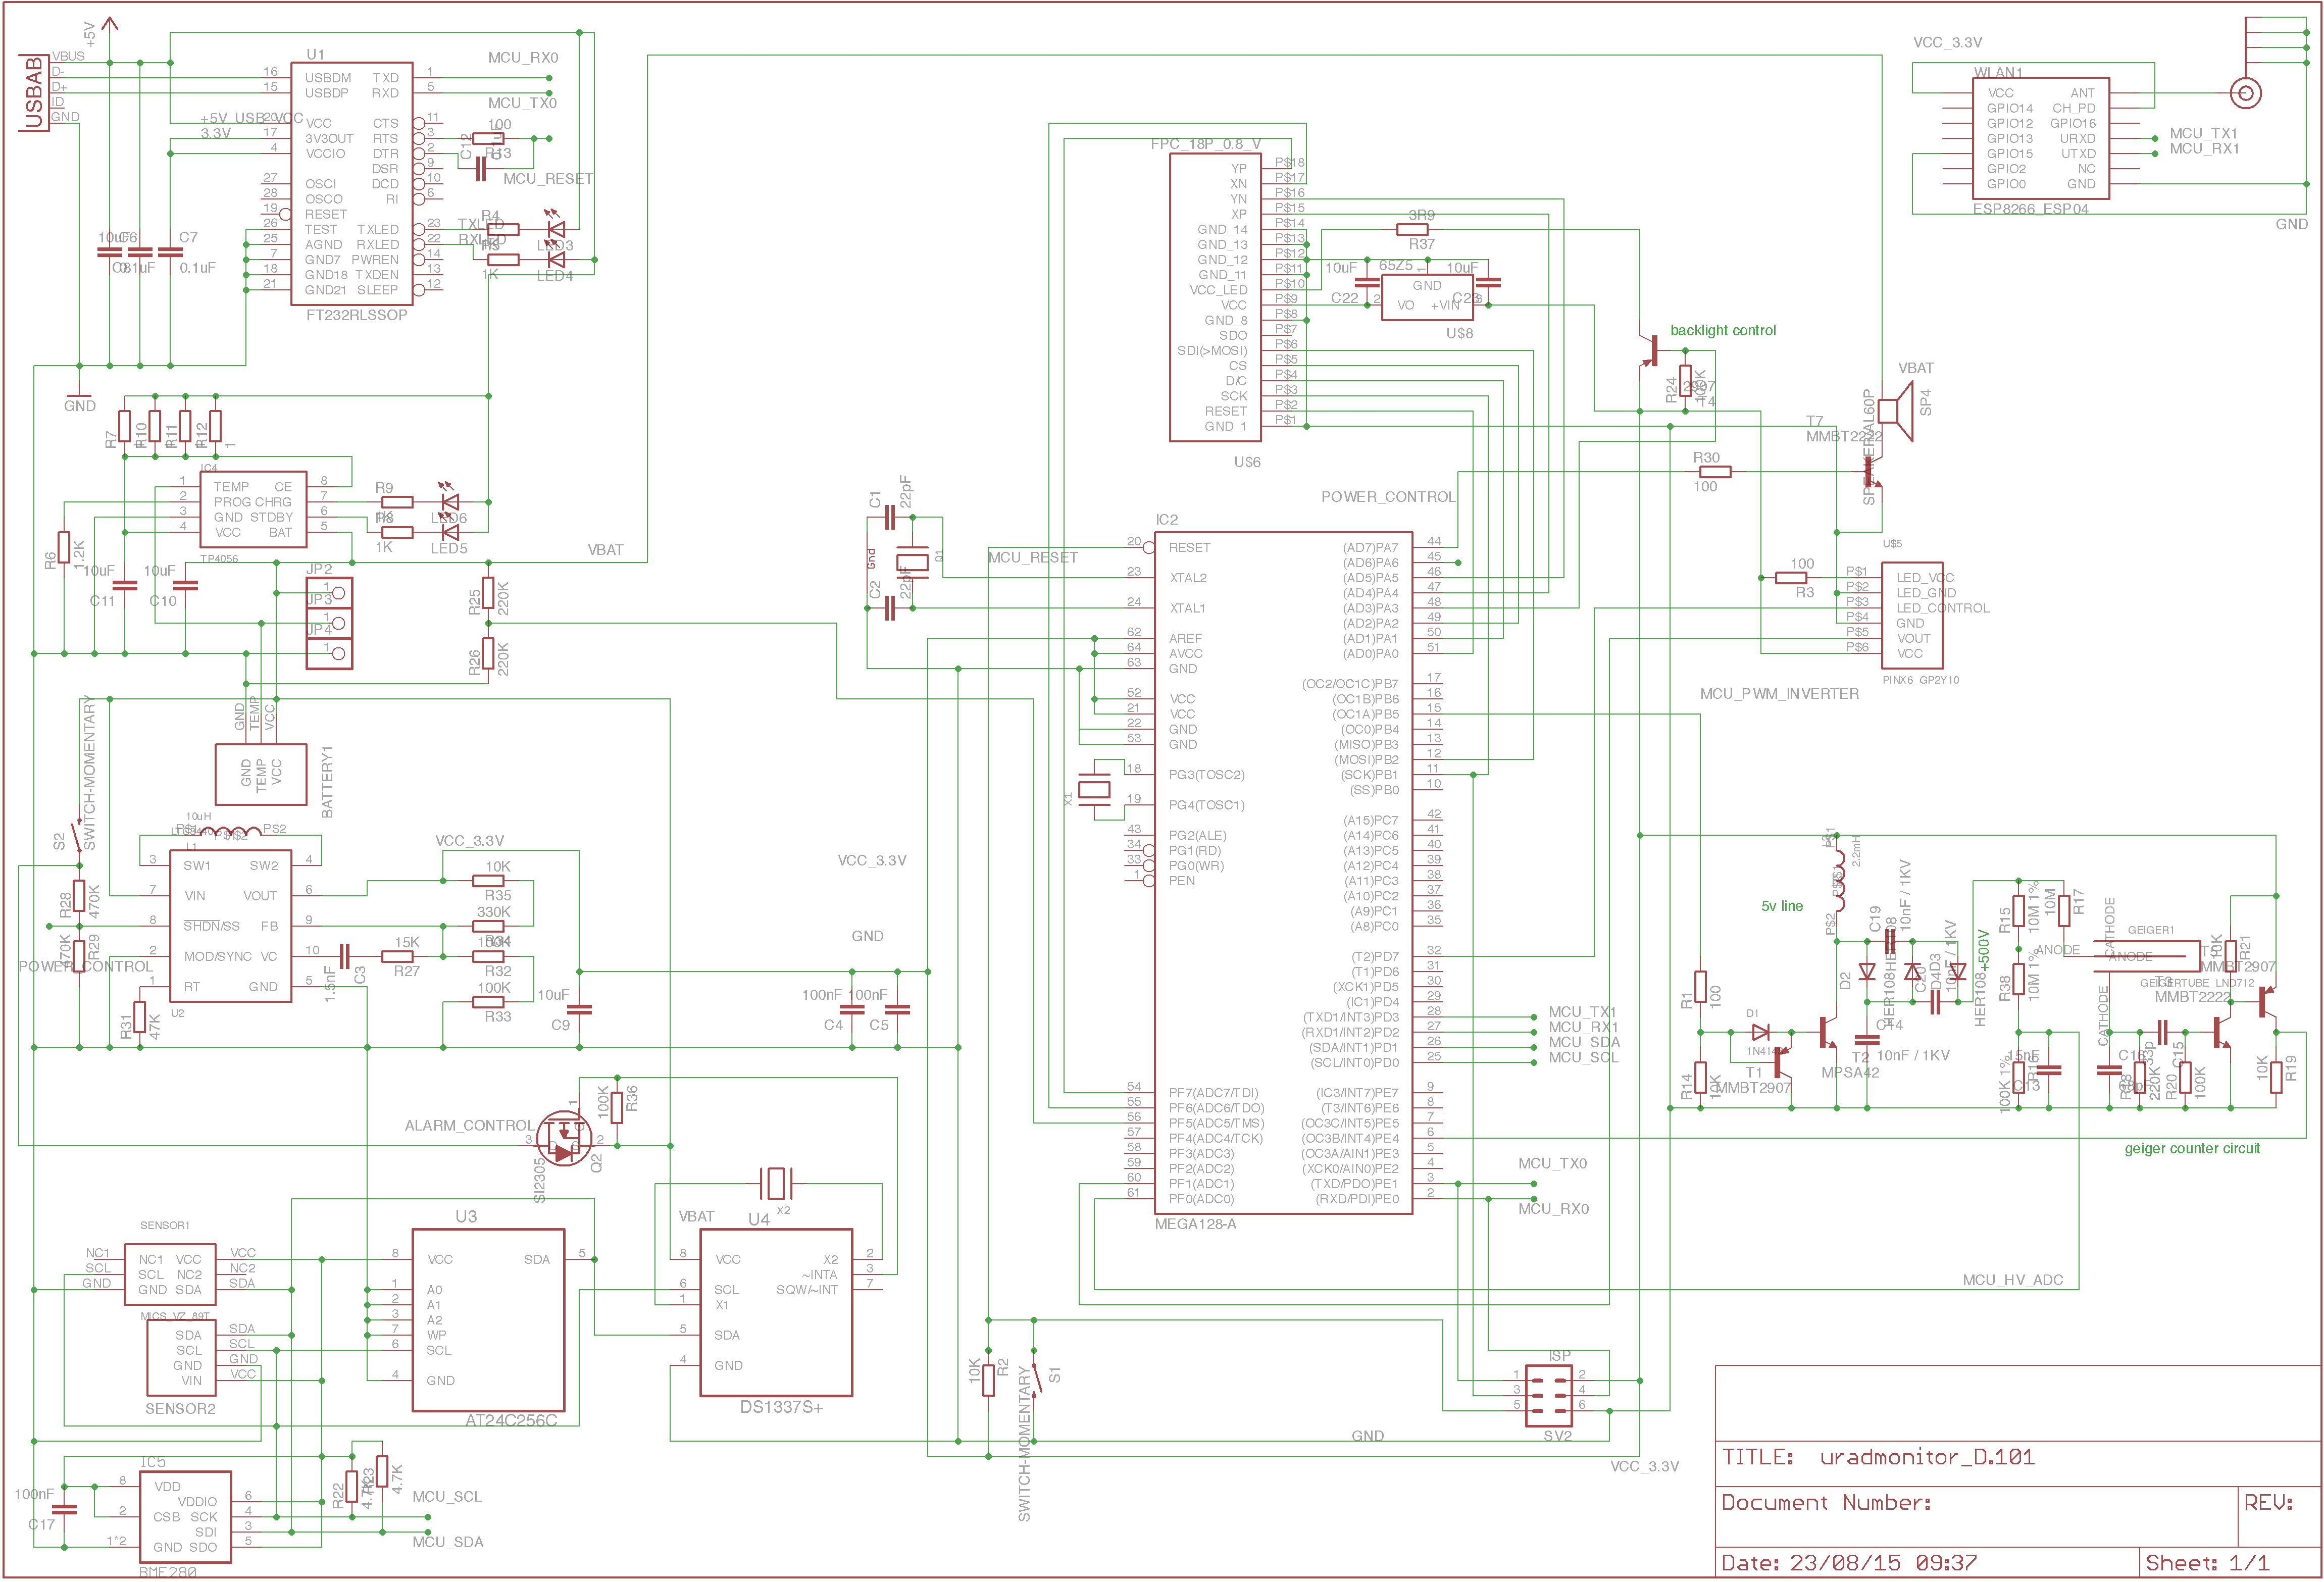
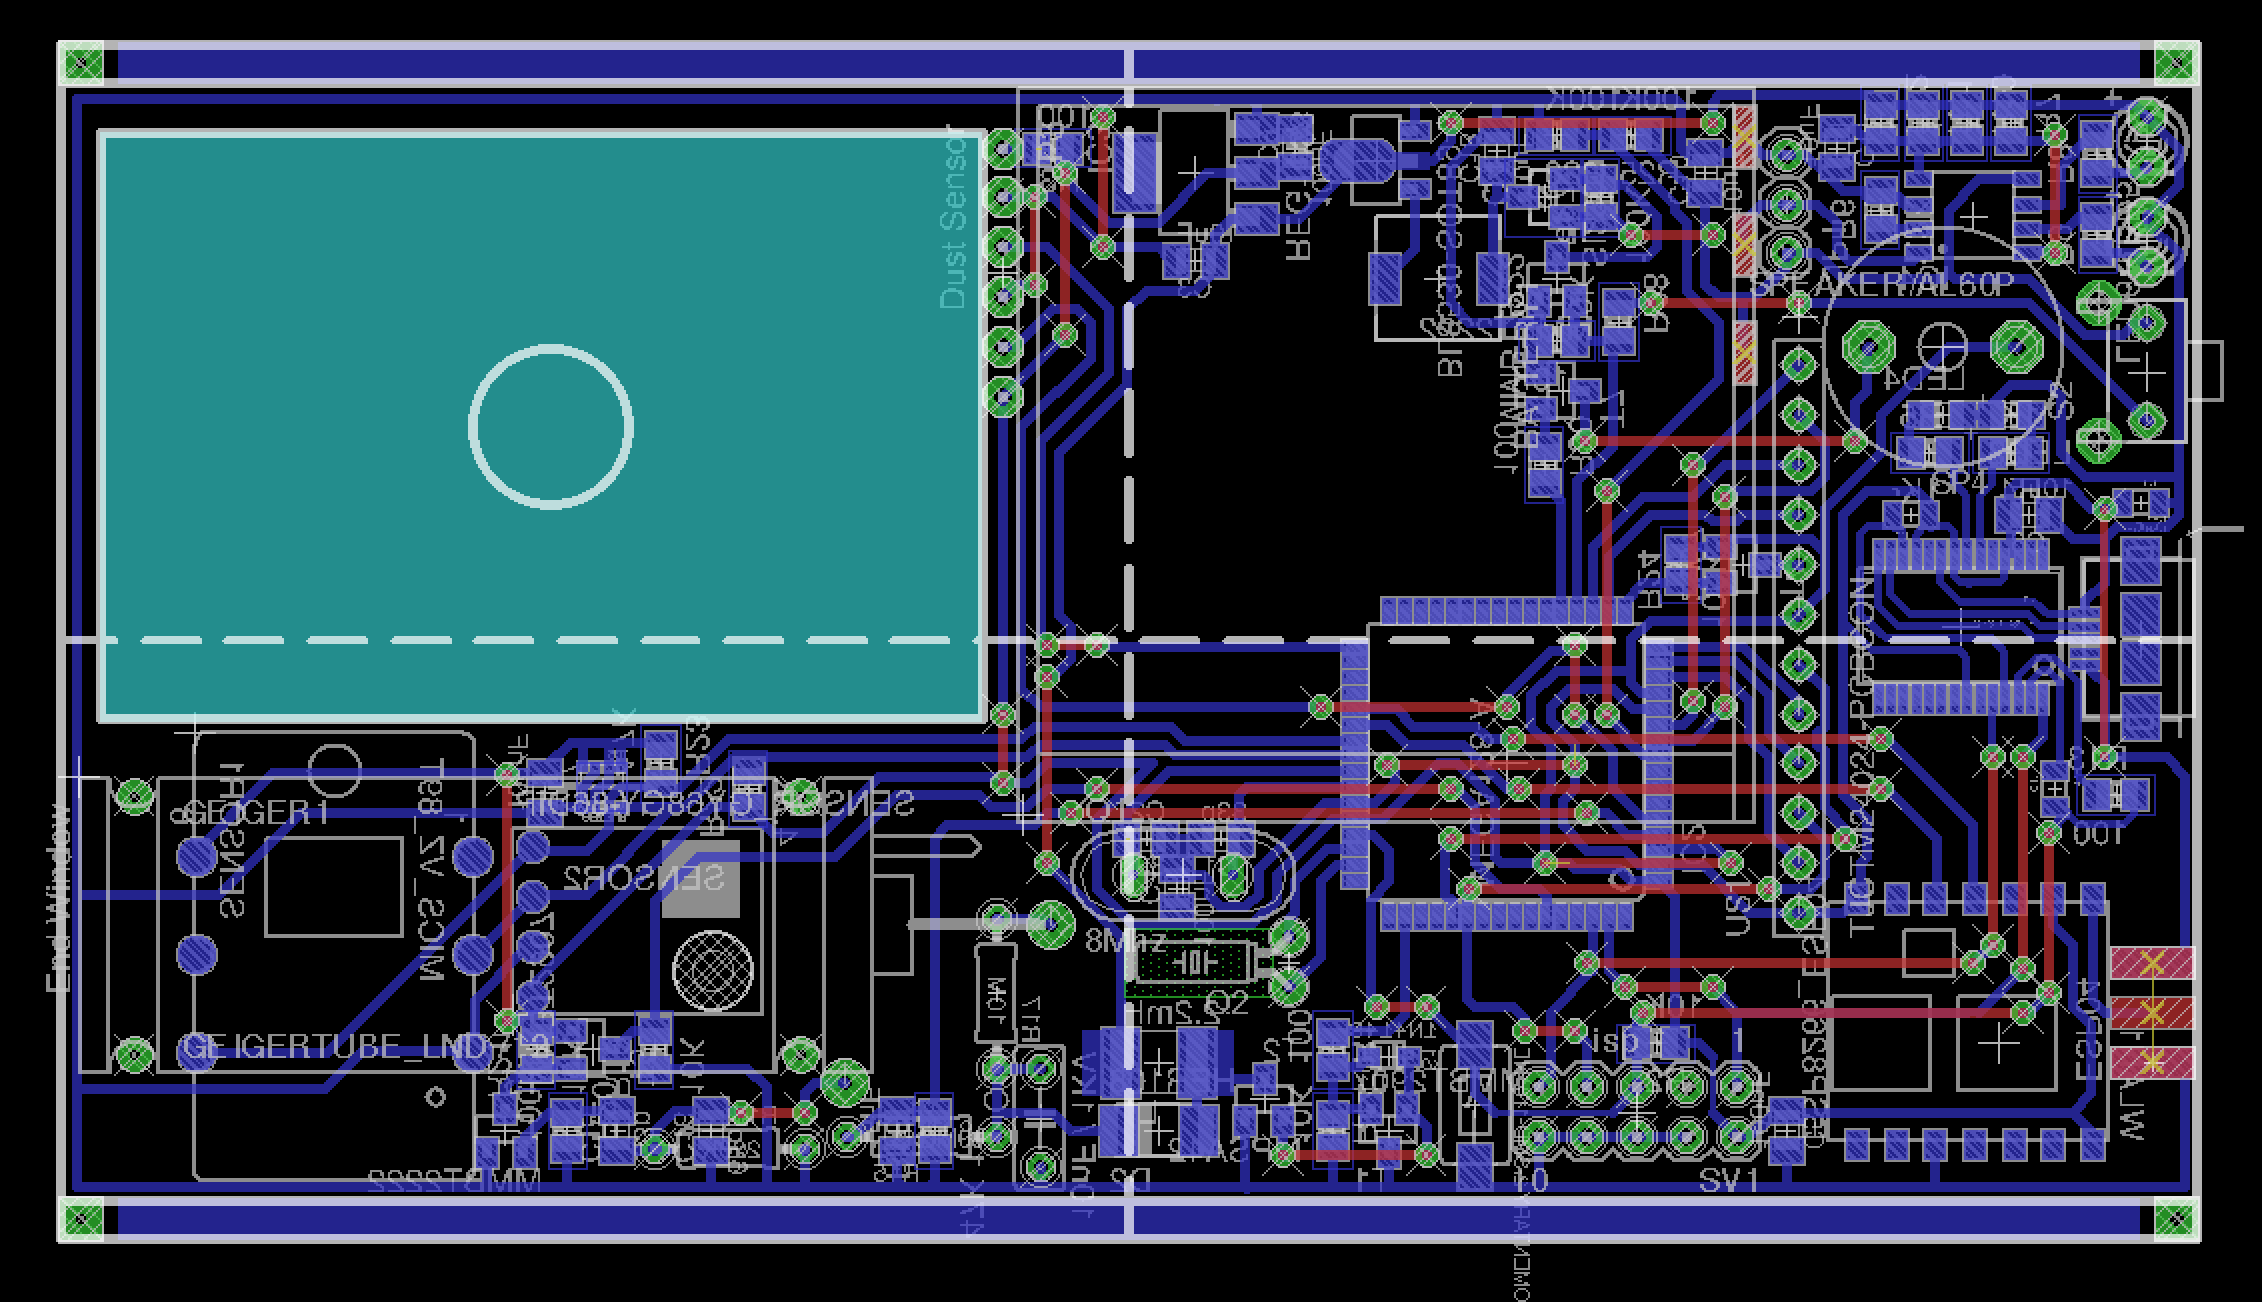
The changes will be added to the specs as soon as the first new units are assembled and tested. For now I need to order the PCBs and the few missing sensors and components. The new circuit diagram shows the components involved:
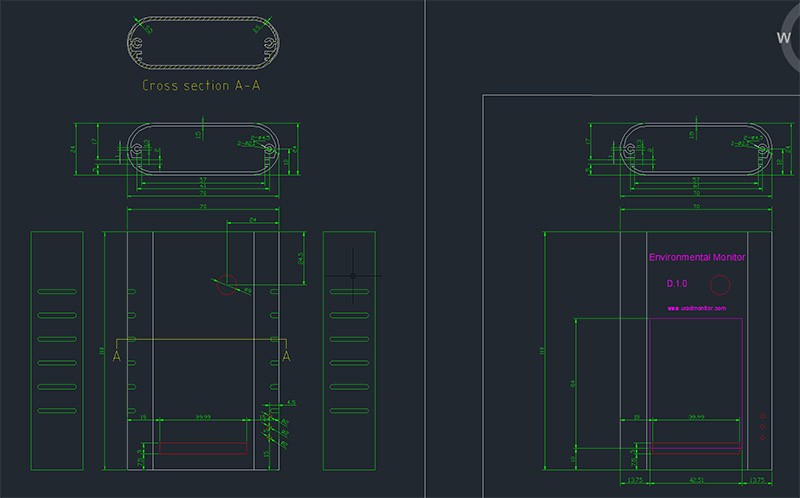
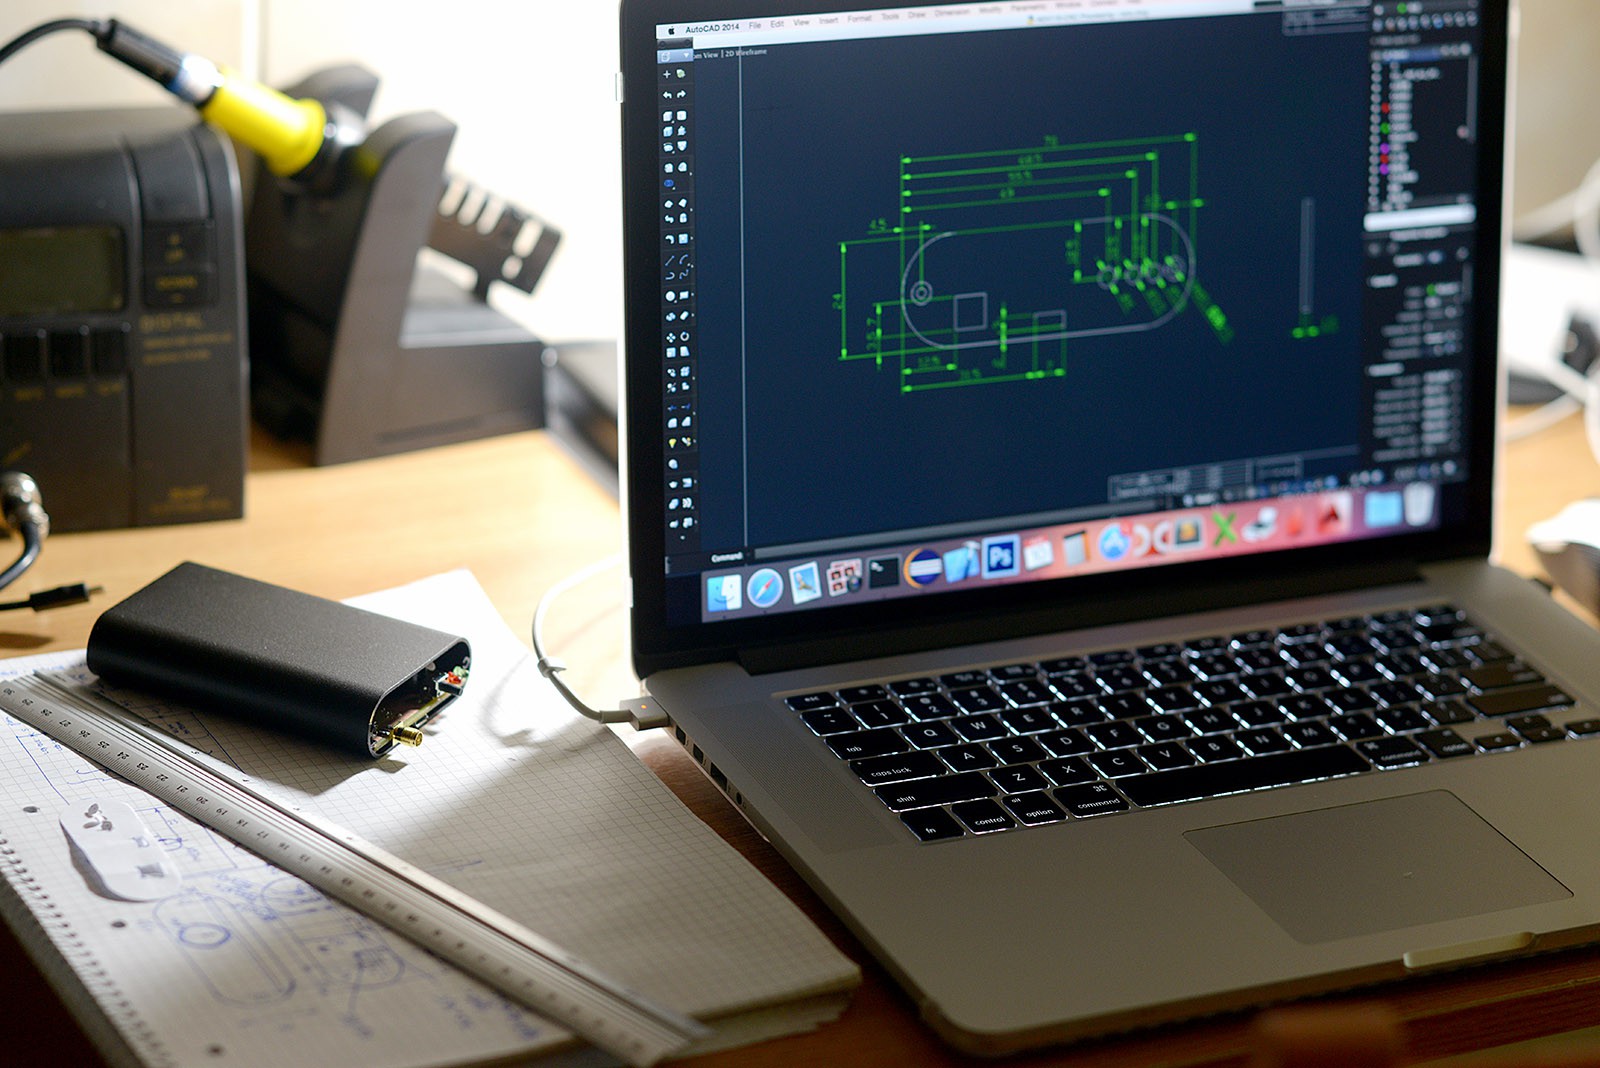
Aluminium Enclosure Improvements![]()
With the new LCD connector the enclosure changes a little from the Beta variant. I have the CAD drawings in place, detailing every silkprint label and hole, but what's interesting is that I added side handgrip cuts, for a neat design and for better adherence.
![]()
![]()
These will be machine processed. I spent quite some time to find the best provider in China. Discussions and results were mixed, I got everything from poor English speakers to excellent communication, and so were the prices where for 10 sample aluminium enclosures prices varied significantly from an offer to the other: incredibly but even with two orders of magnitude, that is ... 100x price difference between some orders. The explanation is of course greed mixed with a misunderstood negotiation practice, but for those more reasonable it was also related to having the proper base aluminium profile or not. Having it means the processing only requires drilling, milling and silkprinting, while the other case also involves building a mold to actually build the enclosures from scratch. The latter though, can be cost-effective with large orders. All this is not something to do in a hurry.
-
Beta units shipped
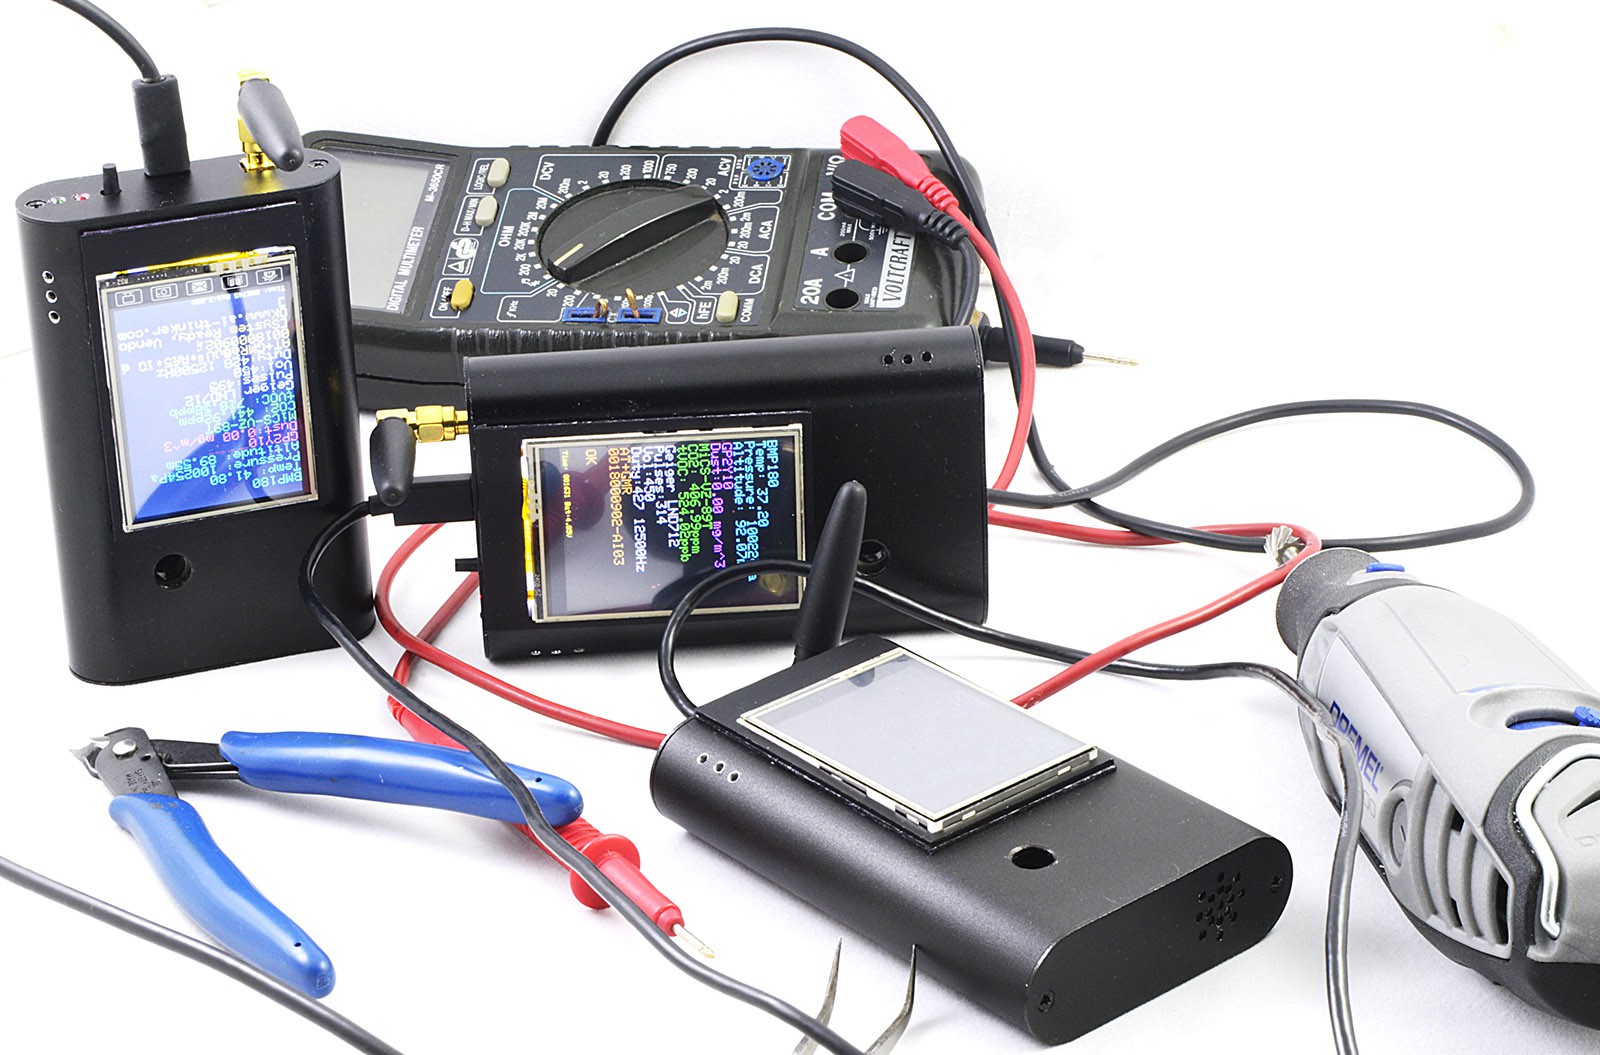
08/13/2015 at 21:04 • 0 commentsAfter a sinuous but exciting road, the Beta prototype came out nice, the entire device is amazingly small: I was able to design it to fit the 110x70mm aluminium enclosure I planned initially without renouncing to any of the sensors nor reducing the 1500mAh lithium battery. See it for yourself, here's the video presentation for the #bestproduct hackaday prize competition:
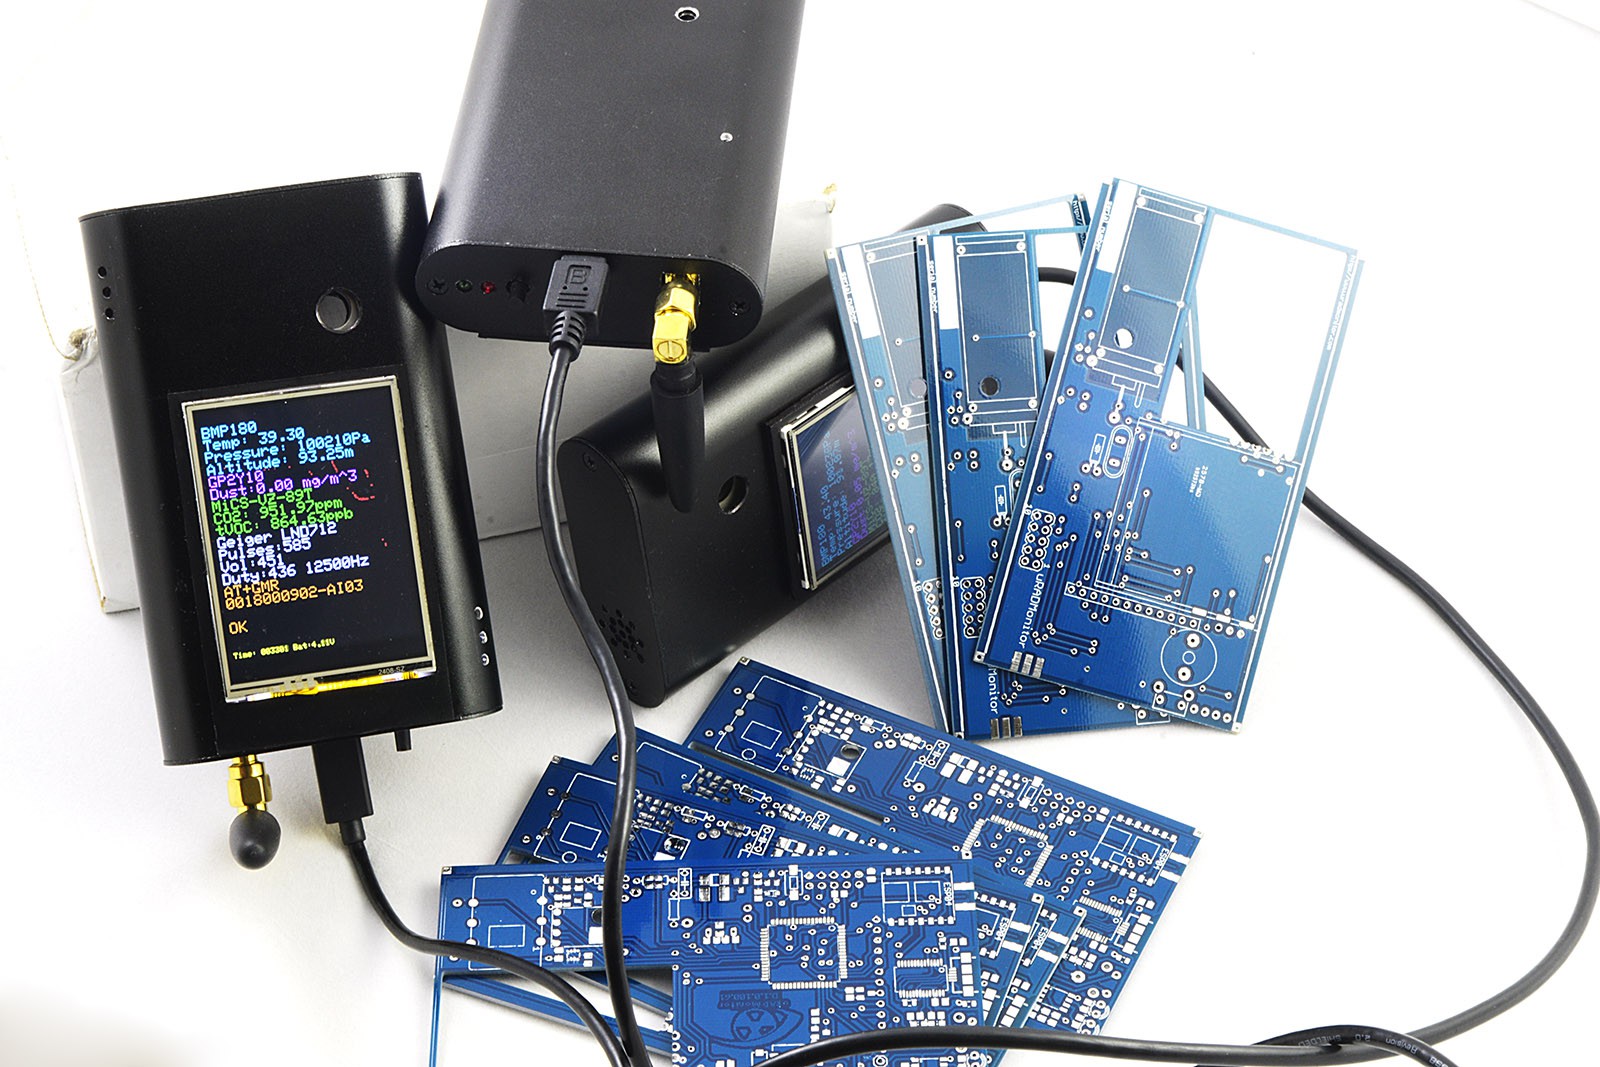
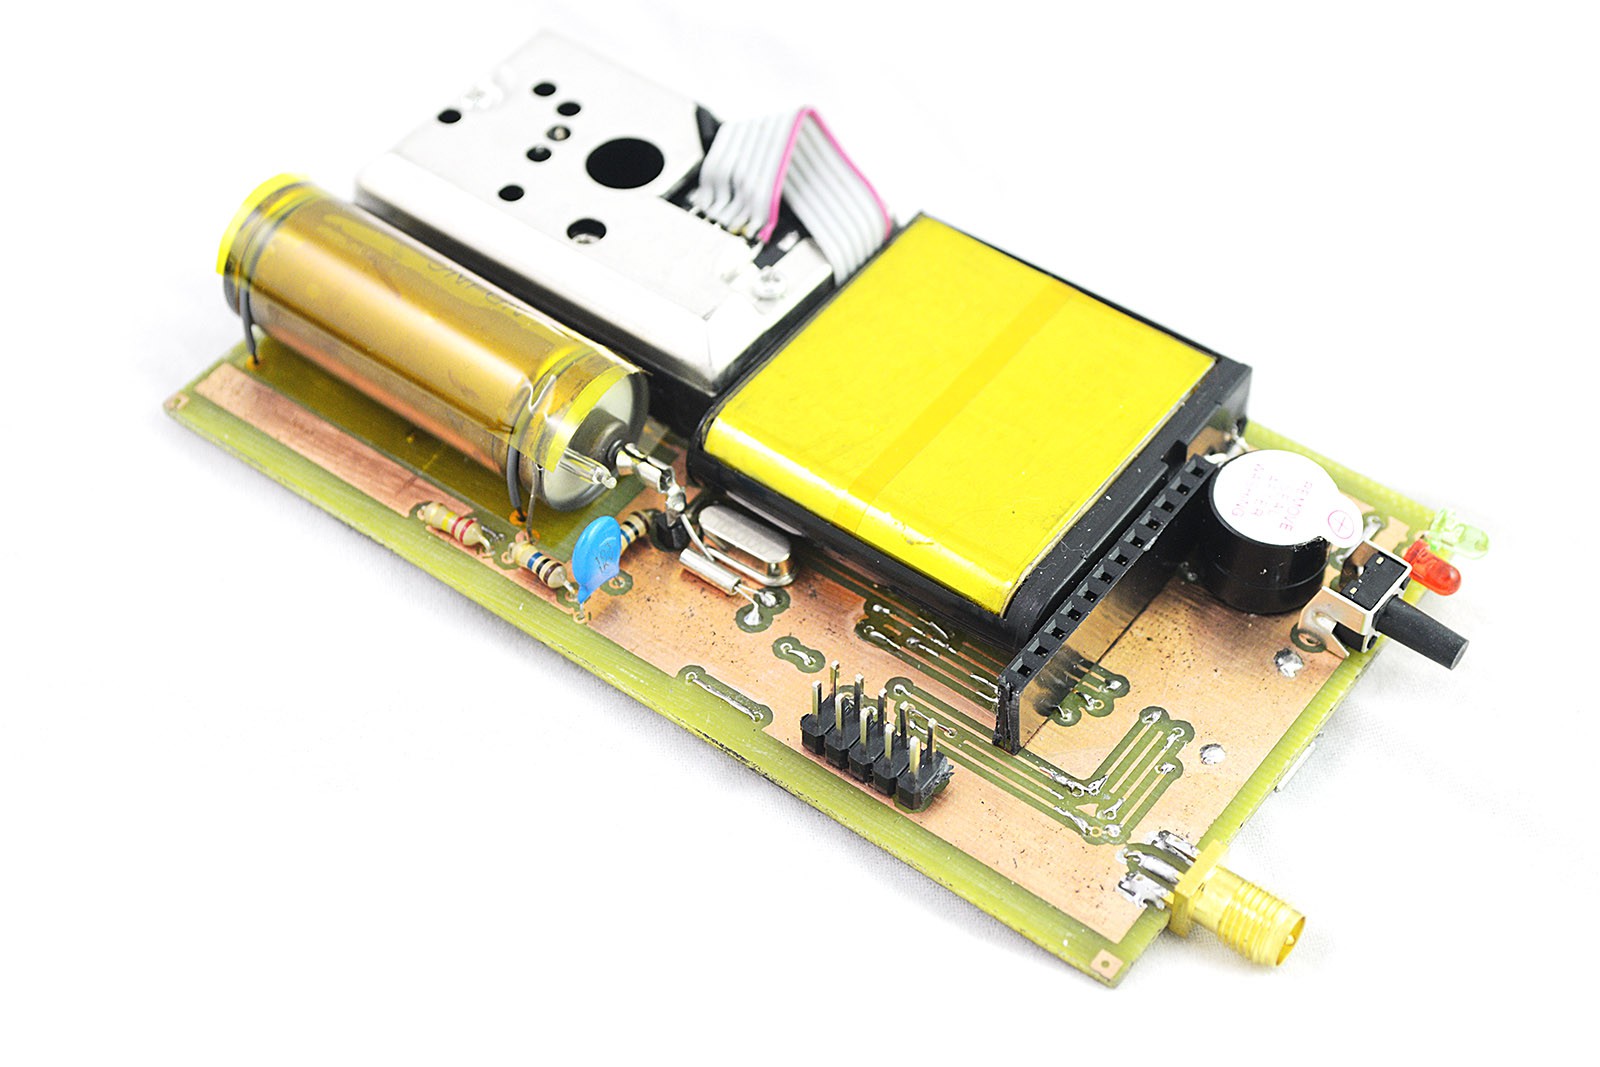
Producing the Beta hardwareThe day before I got an express package from China with the pro PCBs, but my 3 units were already fully assembled. Manually, that is etching the PCBs, drilling tens of holes, soldering tiny 0805 components with the soldering iron, using power tools to drill and mill the strong aluminium of the 3 enclosures. I had no time, nor additional MiCS-VZ-89 sensors for more units. But those PCBs look good:
![]()
There's the MiCZ-VZ-89 advanced air quality sensor measuring CO2 and VOCs in air, the neat LND712 Geiger tube for alpha, beta and gamma radiation including its high voltage regulated inverter, the GP2Y10 dust sensor and the BMP180 for temperature and pressure while the PCB allows soldering an additional BME280.
The Aluminium enclosures![]()
First thing to do was designing the final enclosure. The design files can already be used in a factory to produce machined enclosures, including nice silkprint to label the various connectors.
![]()
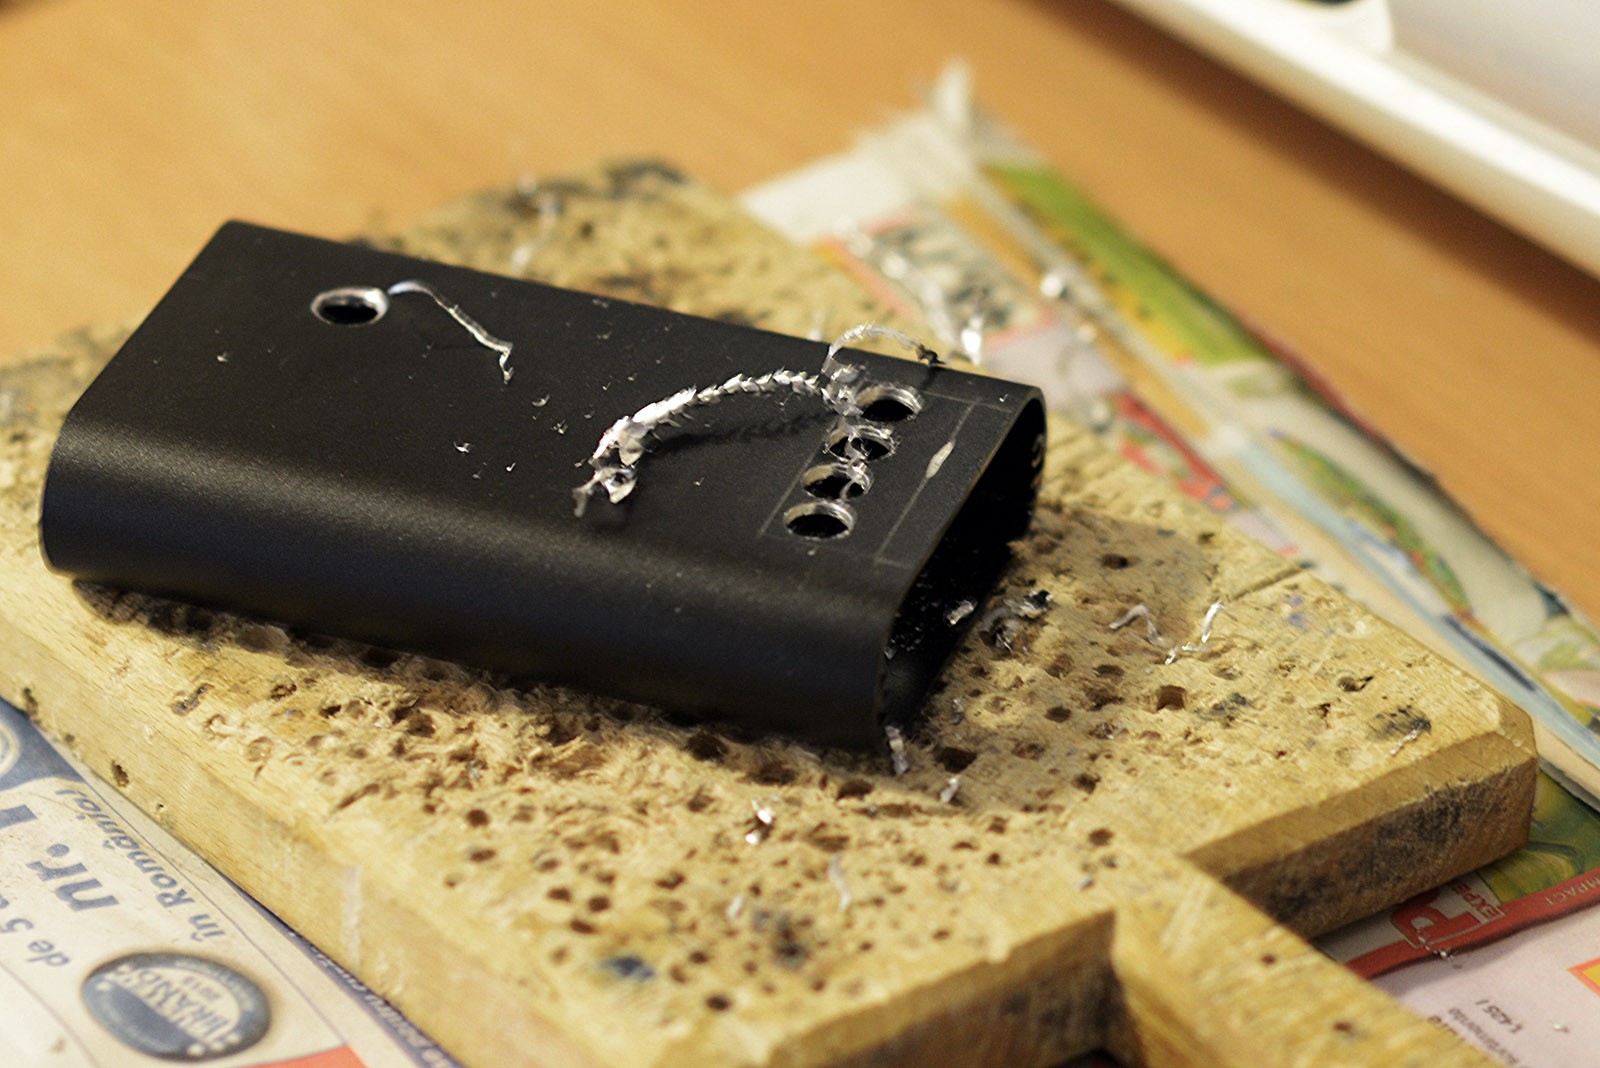
Cutting aluminium is easy if it's thin. I found out my cases won't take the fast spinning diamond disk, so my solution for milling was drilling as many holes as possible to remove the unneeded material, then use a Dremel with a nice milling head. A CNC router would have done wonders here, yet I was able to do it by hand just fine. For drilling holes, I saw that drills for wood give more precise results in aluminium due to their sharp tip better penetrating the material. For the LCD holders I initially wanted some 3D printed parts, but there was no time for that, so I opted for making them out of plastic sheets and painting them black afterwards
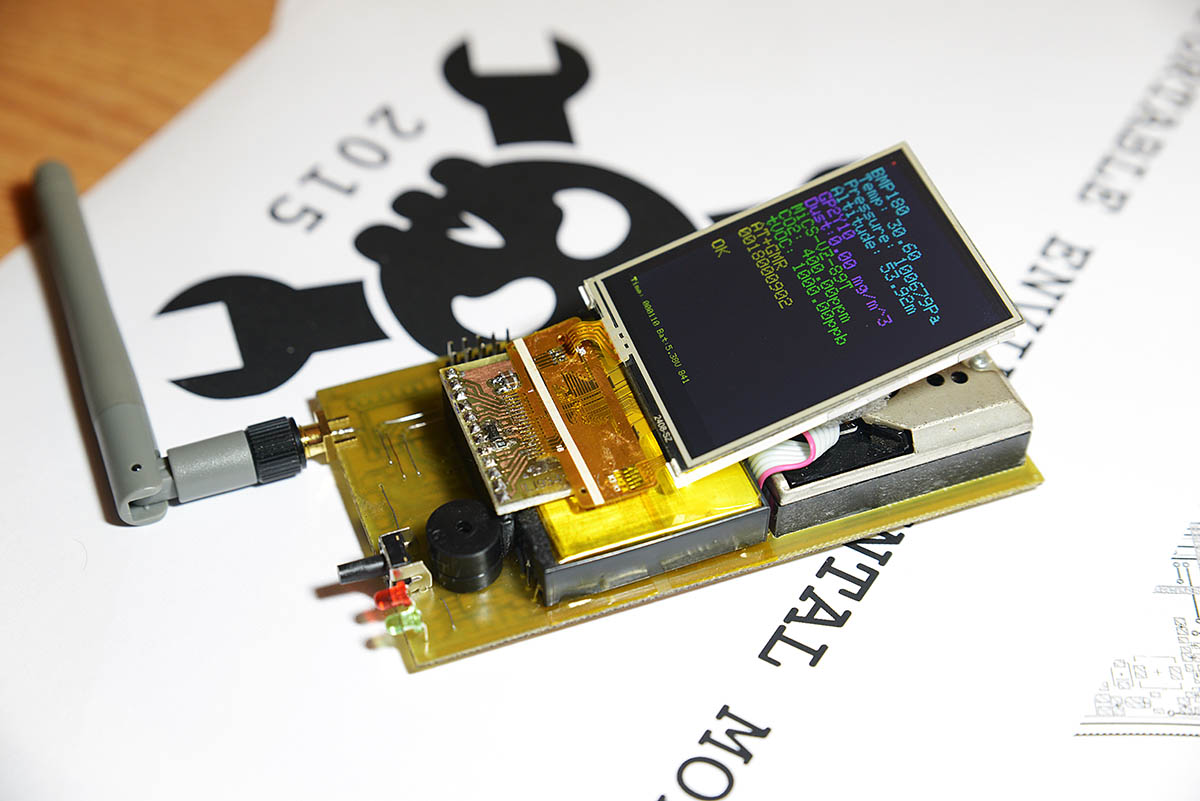
The hardware ready![]()
For a single man, this was an enormous effort, but after less then one month it gave an amazing product. Finally the hardware is ready in all its beauty:
![]()
As we speak the three prototypes are on their wait to the Hackaday Headquarts to participate in the Hackaday Prize 2015 #Bestproduct competition.
-
The first prototype
08/07/2015 at 00:45 • 0 commentsIt's been a crazy run, trying to make this happen. After less then one month I now have the first functional hardware iteration or the first prototype. The Portable Environmental Monitor has been brought to life! All that's left is finalising the enclosure (it will be a nice rugged aluminium enclosure, small enough to fit the palm of the hand, despite the many sensors packed inside) and the software (both the firmware and the server side for centralising data sent via the esp8266 module). Then there are the small improvements, part of every product's path.
![uradmonitor_d_first_prototype_1]()
![uradmonitor_d_first_prototype_2]()
![uradmonitor_d_first_prototype_3]()
There were a few issues like regulator getting a little too hot, unhappy to have a boost converter as a neighbour, or a wire that had to be cut, because I forgot to design a diode in place to stop the battery driven inverter from charging the battery. Well, these things happen, the fix was easy, and didn't even damage the PCB:
To comply with Stage 2 requirements of the Hackaday Prize competition, I had to shoot a 2 minutes video, and this was an excellent choice to present the prototype in its current form, and to iterate a few of its construction details: -
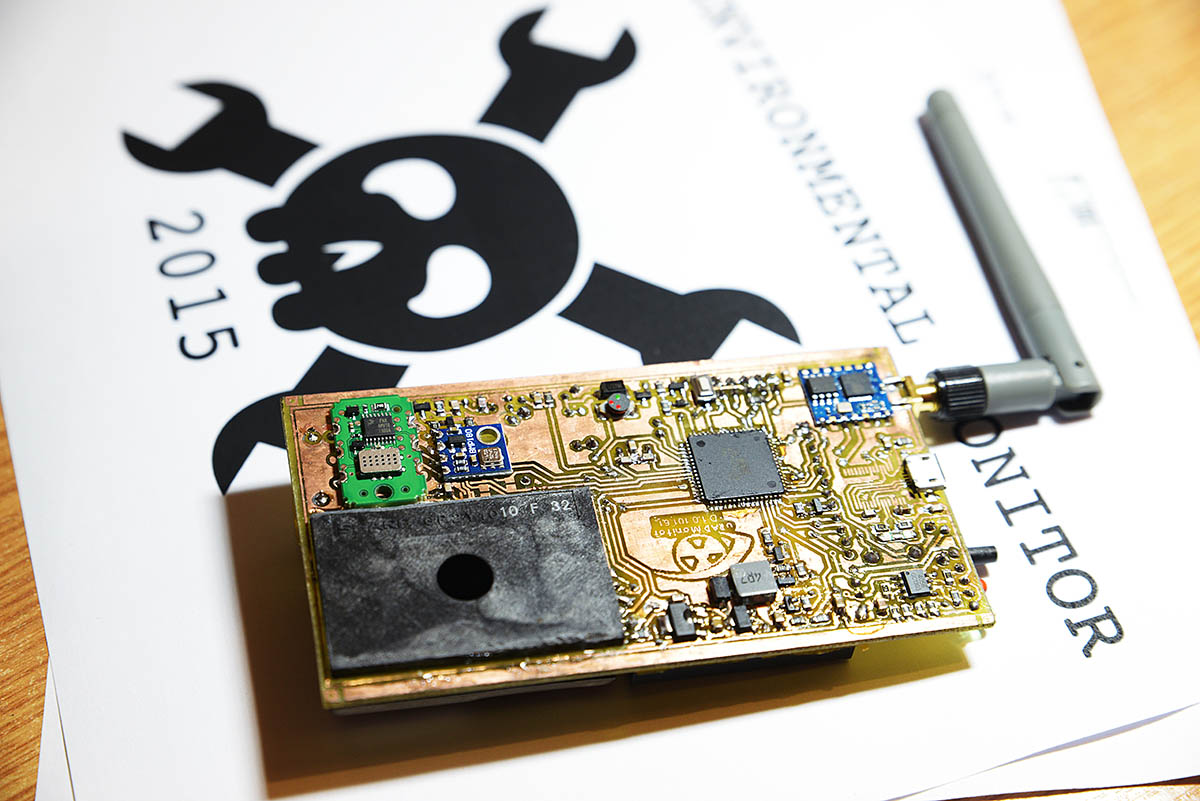
A true hacker makes his own PCBs
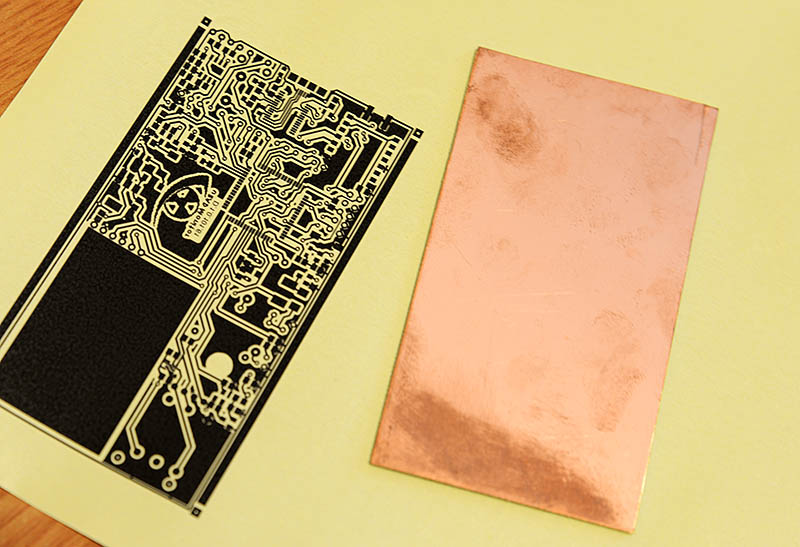
08/05/2015 at 23:35 • 0 commentsA true hacker makes his own PCBs. Dual layer. And in the kitchen. Why so? Because doing them as DIY and not paying lots of money to some greedy company is some kind of hack.
And if it wasn't for all the issues I had with the Portable Environmental monitor along the road, I could have used the nice OSHPark voucher I won on Hackaday (Thanks again guys!). But I've just finished the PCB design last night:
![uradmonitor_D_pcb_1.0.101]()
I know, it looks sweet! And the PCB must do as well. But no time to order them in US, ship them in Europe, solder all parts, test the software and ship the 3 prototypes to Hackaday headquarters before August 17.
Instead I checked locally with a few companies, but their price offer was and average of 300USD for 10 PCBs (with a 100% emergency tax added). That seems ridiculous so no thanks. I did however order a few in China, where 3 companies I know charged between $0.5 and $3 per PCB plus shipping, and they offer top quality. Now that's a huge difference. But all in one, time's too short to wait for shipping. And as I do have a bottle of Ferric Chloride in the kitchen, here's how the first uRADMonitor-D PCB was made:
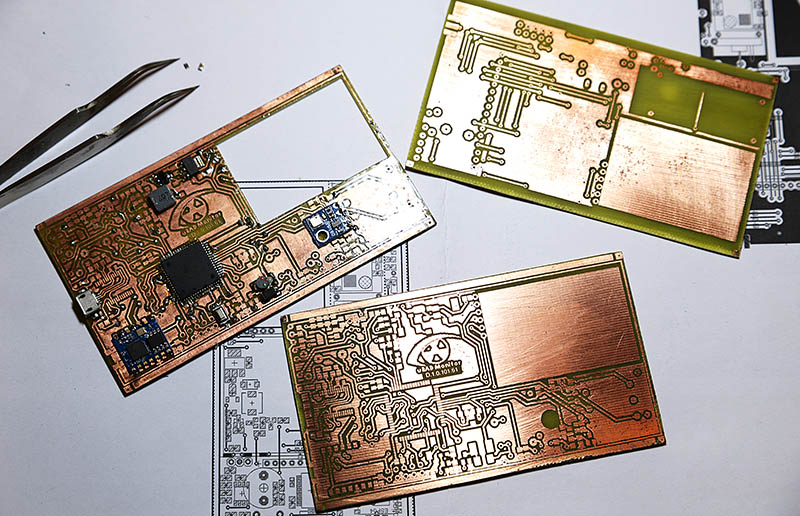
This first one was a single layer, doing the top layer with tiny wires (possible as all wires are either horizontal or vertical). Those under the microcontroller were soldered with just a very tiny cap, that was reduced even further with a fine file. Seeing how good it goes, I decided the next two will be dual layer. And so they were, with the layers perfectly matched for even those tiny holes.![uradmonitor_d_toner_transfer]()
![uradmonitor_d_first_pcb]()
![uradmonitor_d_prototypes]()
Almost there! -
The resistive touchscreen
08/05/2015 at 22:33 • 0 commentsJuly was a tough month, and August is no different. Due to some components arriving late, I've only been able to start my work on the Hackaday.io project with considerable delay. So I had to catch up with everything and squeeze the entire development work for this complex project in a month's timeframe.
But the plan was solid and seemed doable ... unless Murphy's laws of chaos wouldn't start to kick in, adding more trouble to the already busy schedule.
The solution to all
First, it was the atmega128 voodoo issue I wrote about a while ago. For a few days I've been unable to use my two atmega128 development boards and all development efforts stalled, in a parallel useless new quest for understanding why a basic led toggle code would behave erratically. Apparently the problem was related to avrdude, and at least this brought a logical clear explanation to what was going on. But this got me into ARM STM32 microcontrollers as well, so at least I learned a few new things.
Then one of the three Mics-vz-89 decided to stop working and take the entire I2C bus down, so nothing worked until I removed the faulty sensor. I later learned about this issue from SGX support, but it was another day lost with apparently another voodoo-like issue. The replacement is still in transit, hopefully I'll get it soon.
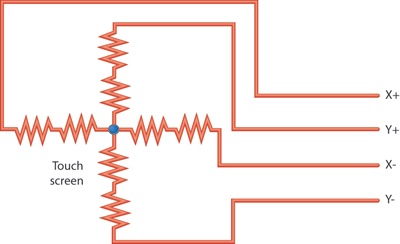
The story goes on. I had some issues with the ILI9341 displays, which resulted in a few getting damaged. I was left with a single one, and no quick way to order two more - which I needed for the 3 prototypes for the #bestproduct competition. Luckily a previous order arrived in time, with 4 brand new ILI9341 LCDs. But no touchscreens. I had two scavenged from the broken modules, but the touch controller was destroyed (xpt2046). So no way to get three working displays with touchscreens.For a few minutes I was clueless. I even considered changing the way my project worked, using some bluetooth modules to display data on a smartphone. Obviously that was a bad idea. My toolbox had a different LCD waiting for some good use. It had a touchscreen, that was a little different because of some buttons printed at the bottom. But the size, connector and apparently type matched. But no XPT2046 driver. Well... who needs that anyway? The XPT2046 serial communication would have used 5 precious pins, while I can access the resistive touchscreen directly via ADC, and use only 4 pins! It's obviously an excellent solution. From the 4 pins, namely the X+, Y-, X-, Y+, only 2 need to be ADC. For the algorithm I've used, those are X- and Y+. The other two can be connected to any GPIO.
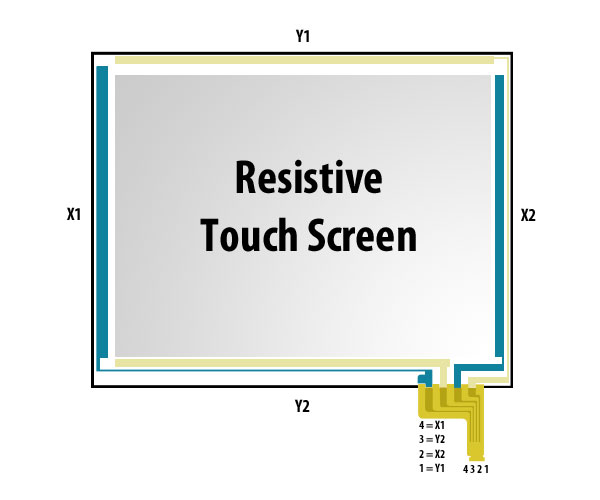
Some technical detailsResistive touchscreens rely on two electrically separated layers to compute coordinates. When we touch the screen, the two layers get into contact at the specific location we touch. As the layers are built like resistors, the point of connection results in particular resistance values that can be determined across the terminals. The resistance values are linear across the X and Y directions. Meaning that the resistance we read can be linearly associated to coordinates on screen, either on the X axis or on the Y, finally allowing us to compute the point where the screen was touched.
The code and the algorythm![resistive_touchscreen_diagram]()
![resistive_touchscreen_circuit]()
![touchscreen]()
(image source here)
Since the touchscreen is mounted on top of the display, it is usually good practice to calibrate it's output to match the resolution of the LCD. As an example, my ILI9341 are used in portrait mode and have a resolution of 240x320 pixels. Therefore I made my touchscreen code to return coordinates to match this surface.For the Hackaday.io project, I had to write a lot of code to handle the hardware layers and make the application development easier. Take for instance the ADC class or the general purpose DigitalPin handling all GPIO. The touchscreen code becomes nice and clear:
- /*
- * TouchScreen constructor
- * init the GPIO pins and set the orientation (default portrait)
- * XN and YP are ADC pins, YP and YN are general IO
- */
- TouchScreen(ADC10b *adc, DigitalPin *xp, DigitalPin *yn, DigitalPin *xn, DigitalPin *yp, Orientation orientation = PORTRAIT, uint16_t r = 0);
- ...
- uint16_t TouchScreen::readRawX(void) {
- xn_adc->config(DigitalPin::INPUT);
- *xn_adc = 0;
- xp_io->config(DigitalPin::INPUT);
- *xp_io = 0;
- yn_io->config(DigitalPin::OUTPUT);
- *yn_io = 0;
- yp_adc->config(DigitalPin::OUTPUT);
- *yp_adc = 1;
- return 1024 - m_adc->read(xn_adc->getPin()) - 1;
- }
- uint16_t TouchScreen::readRawY(void) {
- yn_io->config(DigitalPin::INPUT);
- *yn_io = 0;
- yp_adc->config(DigitalPin::INPUT);
- *yp_adc = 0;
- xn_adc->config(DigitalPin::OUTPUT);
- *xn_adc = 0;
- xp_io->config(DigitalPin::OUTPUT);
- *xp_io = 1;
- return 1024 - m_adc->read(yp_adc->getPin()) - 1;
- }
- uint16_t TouchScreen::readRawPressure(void) {
- // Set X+ to ground
- xp_io->config(DigitalPin::OUTPUT);
- *xp_io = 0;
- // Set Y- to VCC
- yn_io->config(DigitalPin::OUTPUT);
- *yn_io = 1;
- // Hi-Z X- and Y+
- xn_adc->config(DigitalPin::INPUT);
- *xn_adc = 0;
- yp_adc->config(DigitalPin::INPUT);
- *yp_adc = 0;
- int z1 = m_adc->read(xn_adc->getPin());
- int z2 = m_adc->read(yp_adc->getPin());
- return 1024 - (z2-z1) -1;
- }
And to scale the values to the LCD resolution , I went for the following:
- bool TouchScreen::read(uint16_t *x, uint16_t *y, uint16_t *pressure) {
- uint32_t calX1 = 0, calY1 = 15, calX2 = 890, calY2 = 845;
- uint16_t rawp = readRawPressure();
- if (rawp == 0) return false;
- // two consequent reads to double check coords and reduce errors
- uint16_t rawx = readRawX();
- if (readRawX() != rawx) return false;
- uint16_t rawy = readRawY();
- if (readRawY() != rawy) return false;
- if (rawx < calX1 || rawx > calX2 || rawy < calY1 || rawy > calY2)
- return false;
- rawx = (rawx - calX1) * TOUCH_WIDTH / (calX2 - calX1);
- rawy = (rawy - calY1) * TOUCH_HEIGHT / (calY2 - calY1);
- if (m_orientation == PORTRAIT) {
- *x = rawy;
- *y = TOUCH_WIDTH - rawx;
- } else {
- *x = rawx;
- *y = rawy;
- }
- *pressure = rawp;
- return true;
- }
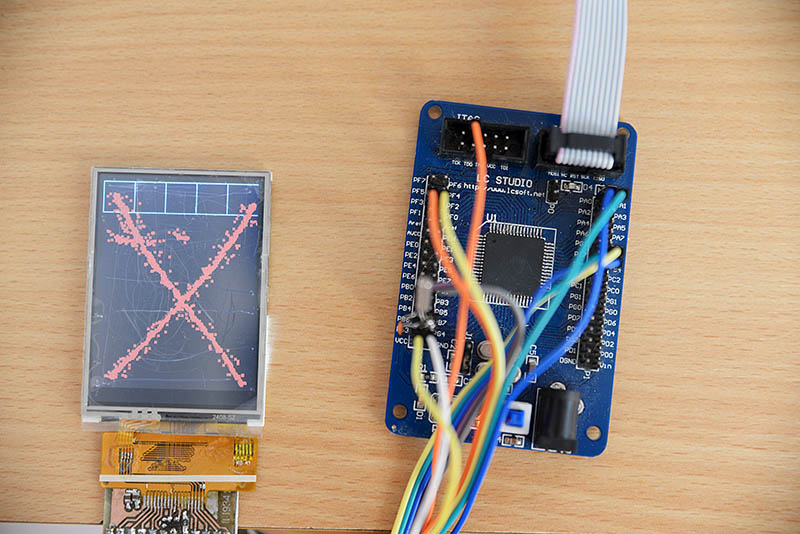
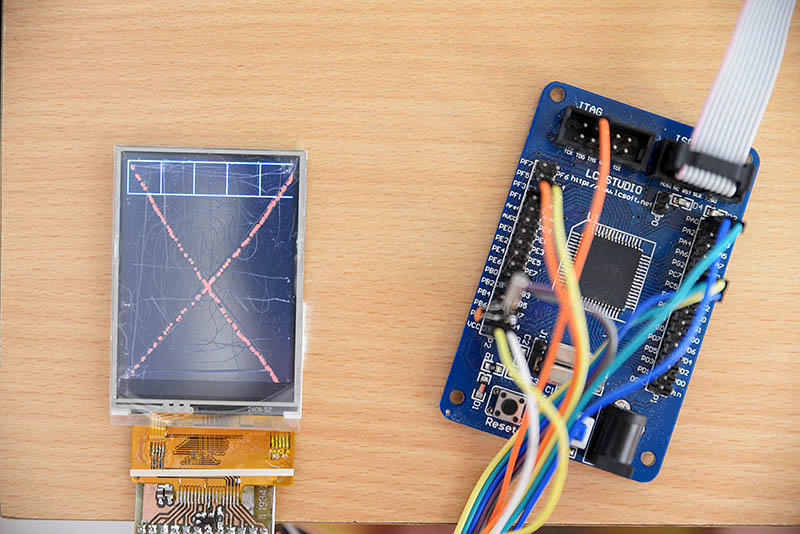
The cal** values must be determined for each touchscreen in part, as there's an offset resulting from the way the touchscreen is mounted on top of the LCD, making the clicks a bit off from the LCD content. Also you'll see that I read both x and y coordinates twice. The idea is to consider a coordinate as valid, only if two subsequent read operations result in the same numbers. This helps remove unwanted noise. As a comparison, here are two pics, in the first I took the (x,y) values as they were returned and drew them on the screen, while in the second picture I added this clever mechanism:
![resistive_touchscreen_library_errors]()
![resistive_touchscreen_library_validated]()
Now the buttons can be clicked accurately! Download the full code on my blog at: http://www.pocketmagic.net/resistive-touchscreen/ -
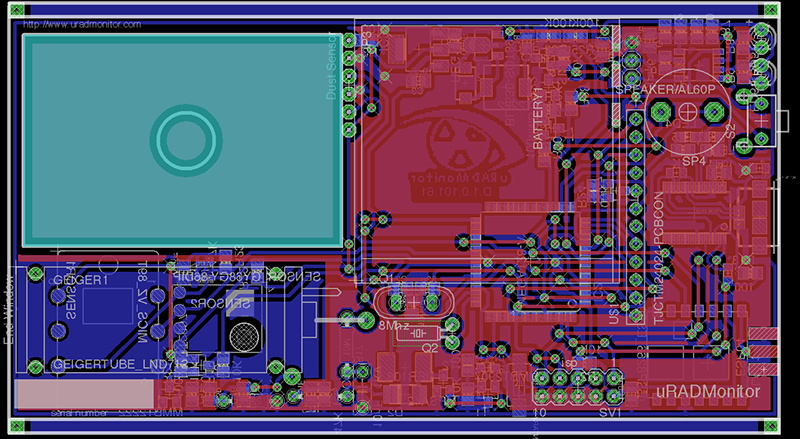
The PCB is ready
08/05/2015 at 01:44 • 0 commentsJust a very quick update due to the very late hour (clock shows 4:42am). The PCB design is finally ready, after weeks of testing each sensor individually, and writing tens of classes and thousands of lines of code. The PCB now puts all that effort together.
![]()
Before going to sleep I'll make sure the Gerber files get to a factory in China, to manufacture a few boards and have them shipped back to Romania on Friday the latest, so I have time over the weekend to solder them.
Tight timeframe for the #BestProduct deadline!
-
MiCS-VZ-89T a low power air quality sensor
07/31/2015 at 18:39 • 5 commentsPutting everything together also requires checking everything separately first. So I did with the MiCS-VZ-89T sensor, and here is the story, also presented on my blog: MiCS-VZ-89 Air Quality Sensor
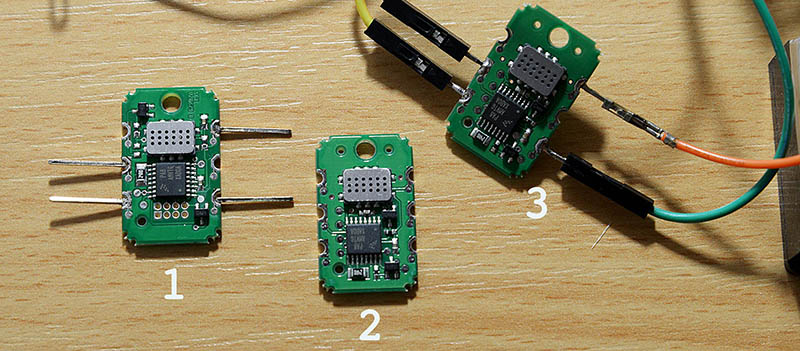
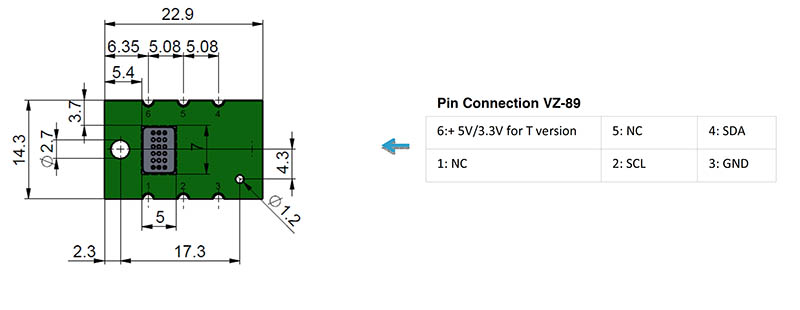
A low power sensor that can measure at the same time both carbon dioxide (CO2) and Volatile Organic Compounds (tVOC) is probably too good to be true. Yet the MiCS-VZ-89 does this, among some other appealing features like 3.3V supply (in the T variant), I2C communication, calibration-free high sensitivity and a small size factor. Its price is also a plus.
I got the chance to give it a closer look while designing the Portable Environmental Monitor project for this year's Hackaday Prize .![mics_vz_89t]()
![mics_vz_89t_pinout]()
My circuit's I2C line was already serving a BMP180 temperature and barometric pressure sensor, but the MiCS_VZ_89T got along just fine. Using the datasheet, I was able to find the I2C Address (set to 0x70), its commands and parameters. The precious air quality data is returned as a 6 bytes array:3.2. 0b00001001: Get VZ89 status:
This command is used to read the VZ89 status coded with 6 bytes:
D1 (8bits) represent the CO2-equivalent signal value [13..242].
D2 (8bits) represent the VOC-short signal value [13..242].
D3 (8bits) represent the VOC-long signal value [13..242].
D4 (8bits) represent the 1st byte of raw sensor resistor value (LSB).
D5 (8bits) represent the 2nd byte of raw sensor resistor value.
D6 (8bits) represent the 3rd byte of raw sensor resistor value (MSB).Full details in this datasheet: MICS-VZ-89-I2C-specs-rev-A .
The code implementation is as follows:- #define VZ89_ADDR (0x70<<1) //0x70 default I2C address
- //registers
- #define VZ89_CMD_SETPPMCO2 0x8 // This command is used to send a ppmCO2 value from an analyser to the VZ89 in order to recalibrate its outputs.
- #define VZ89_CMD_GETSTATUS 0x9 // This command is used to read the VZ89 status coded with 6 bytes:
- ..
- // i2c read
- void VZ89::readmem(uint8_t reg, uint8_t buff[], uint8_t bytes) {
- uint8_t i =0;
- i2c_start_wait(VZ89_ADDR | I2C_WRITE);
- i2c_write(reg);
- i2c_rep_start(VZ89_ADDR | I2C_READ);
- for(i=0; i<bytes; i++) {
- if(i==bytes-1)
- buff[i] = i2c_readNak();
- else
- buff[i] = i2c_readAck();
- }
- i2c_stop();
- }
- void VZ89::readRaw(uint8_t rawData[6]) {
- static uint8_t buff[6];
- memset(buff, 0, sizeof(buff));
- //read raw temperature
- readmem(VZ89_CMD_GETSTATUS, rawData, 6);
- }
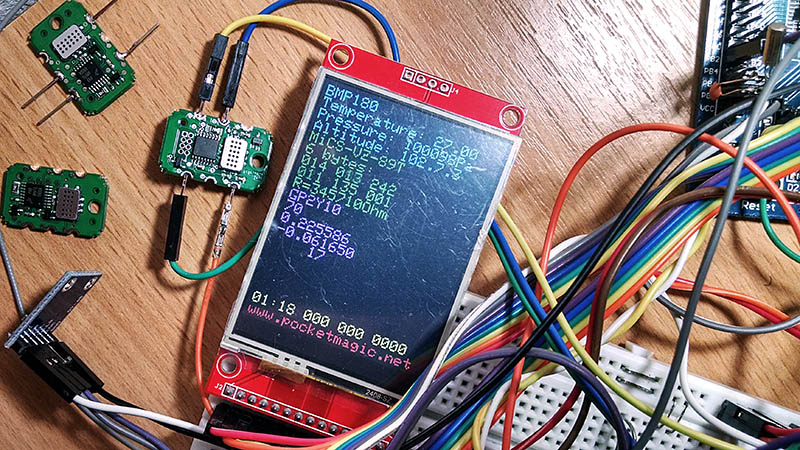
Where read raw returns the 6 bytes carrying what we need. A quick test gave me the three bytes starting at 13 right away, and spraying a little butane from a lighter showed the numbers change.
![mics_vz_89t_firstrun]()
All good. Except I didn't have a way to interpret them into actual gas concentrations. I contacted the manufacturer, and they replied (in less than 24hours), indicating where I can find the information. The interpretation of the I2C data can be seen here: Preliminary Datasheet MiCS-VZ-86 and VZ-89 rev 6 (page 3).
The instructions were translated into code as follows:- void VZ89::readRaw(uint8_t rawData[6]) {
- static uint8_t buff[6];
- memset(buff, 0, sizeof(buff));
- //read raw temperature
- readmem(VZ89_CMD_GETSTATUS, rawData, 6);
- }
- /*
- During “Functional Test Mode” only “Raw sensor” and “VOC_short” data are available. “VOC_short” is
- an image of sensor reactivity and can then be used for functional test.
- Out of this initial period, the device will have the I2C data CO2 equivalent [ppm] and tVOC equivalent
- referred to the isobutylene sensitivity unit [ppb].
- D1:Data_byte_1: CO2_equ: [13…242] -> CO2_equ [ppm] = (D1 -13) * (1600/229) + 400
- D2: Data_byte_2: VOC_short [13…242]
- D3: Data_byte_3: tVOC: [13…242] -> tVOC [ppb] = (D3 -13) * (1000/229)
- D4: Data_byte_4: Raw sensor first byte (LSB)
- D5: Data_byte_5: Raw sensor second byte
- D6: Data_byte_6: Raw sensor third byte (MSB) -> Resistor value [W] = 10*(D4 + (256*D5) + (65536*D6))
- return CO2 equivalent [ppm] and tVOC equivalent referred to the isobutylene sensitivity unit [ppb].
- *
- */
- bool VZ89::read(float *co2, uint8_t *reactivity, float *tvoc) {
- uint8_t data[6];
- readRaw(data);
- if (data[0] < 13 || data[1] < 13 || data[2] < 13) return false;
- // convert data to meaningful values
- *co2 = (data[0] - 13) * (1600.0 / 229) + 400; // ppm: 400 .. 2000
- *reactivity = data[1];
- *tvoc = (data[2] - 13) * (1000.0/229); // ppb: 0 .. 1000
- //uint32_t resistor = 10 * (data[3] +256 * data[4] + 65536 * data[5]);
- return true;
- }
And the result produced the CO2 concentration as ppm, respectively the tVOC as ppb:
Get the code![mics_vz_89t_results]()
Mics-vz-89t code is released as open source. Get it here or on Github.
Portable environmental monitor
A handheld, battery powered, sensor array unit for environmental monitoring focused mostly on air quality using a global infrastructure.


 We’re honoured to bear this recognition of our efforts, and are looking forward to continue building on what we have started. uRADMonitor is committed to provide a homogenous global solution for environmental monitoring, using distributed hardware. The