I've been collecting temperature data for some time now using DS18B20+ temperature sensors connected to some ESP8266 boards that upload data to a Raspberry Pi. I've tweaked it to be fairly reliable.
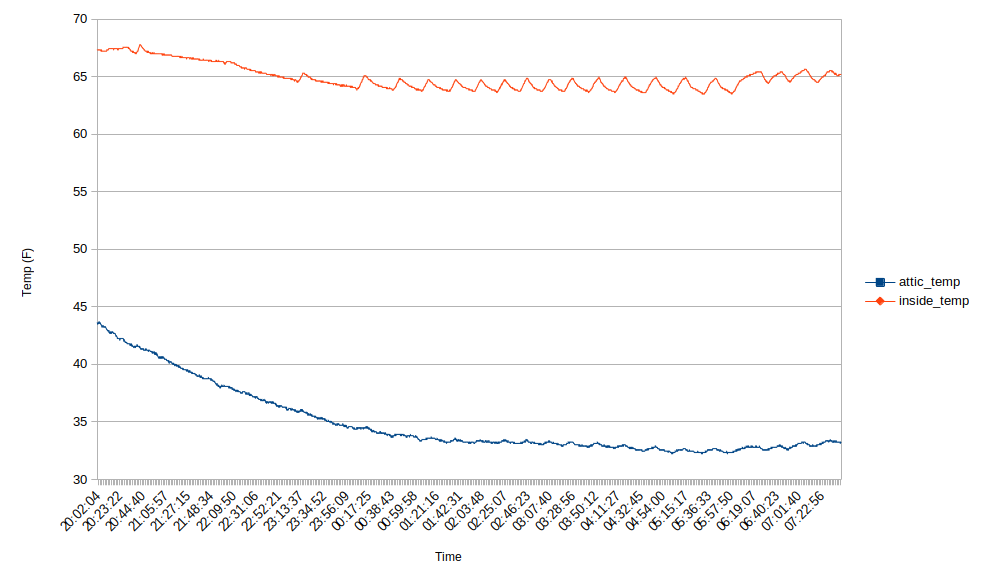
I decided this morning to make a line chart from some recent data. I chose to plot the data from the sensor in my attic and a sensor from inside. For the inside temperature sensor, you can see it oscillating for a good portion; that's from my heat pump cycling. Interestingly enough, you can see matching oscillations for the attic temperature sensor, but far less pronounced. I suppose that's not surprising as some heat from the heated space will of course make it to the attic.
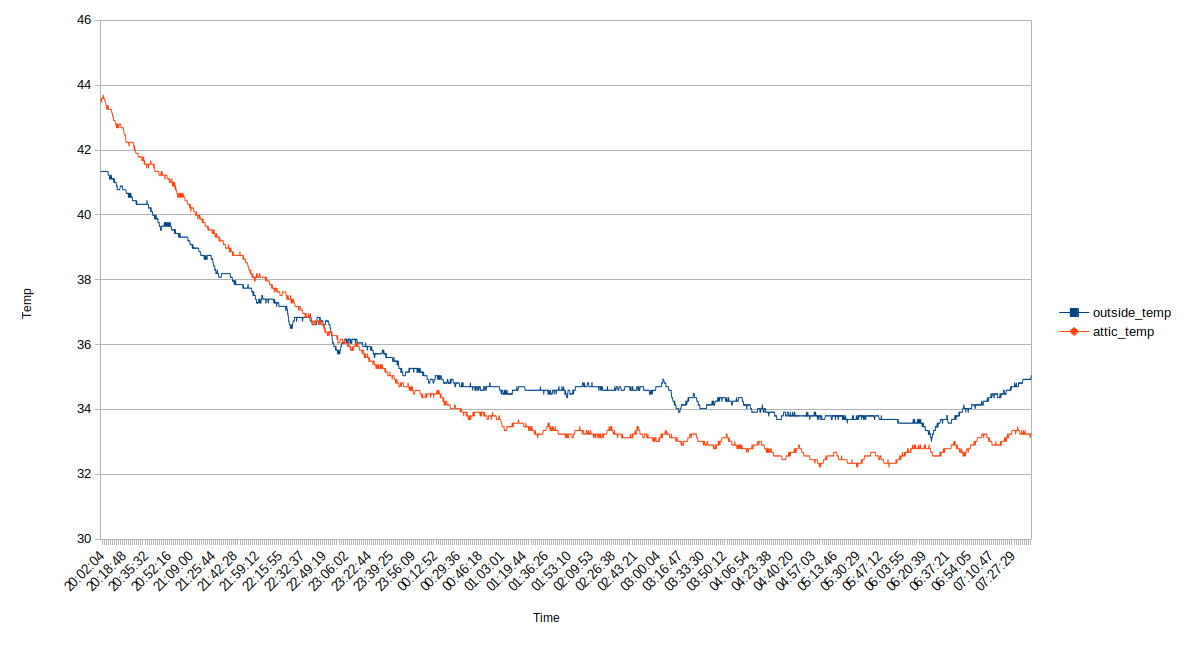
I also decided to plot the temperature sensor data from the attic sensor and an outside sensor in another chart. An important note: The sensors in this case are connected to separate ESP8266 boards, so the readings weren't taken at the exact same time, but they're pretty close, so I fudged things a little bit (I used the reading times used to make the x axis from the attic temp sensor.)
You can see the oscillations from the heat pump cycling a bit better thanks to the more granular y axis scale compared with the first chart. Interestingly, it looks like the outdoor temperature might be in an area where some heat from inside the house is escaping as there appears to be a few oscillations that look like it may be from the heat pump cycling. I may need to place it further away, good to have found this out.
I used LibreOffice Calc for the above charts (was a little bit of a learning curve to tweak things such as line and data point dot thicknesses to make it as readable as possible.) It would be interesting to have my Raspberry Pi generate graphs from the data with one of those generated graphs being generated from a trailing x amount of time. It would make things more convenient vs. having to manually do it. Time to do some searching on how to do that.
Discussions
Become a Hackaday.io Member
Create an account to leave a comment. Already have an account? Log In.