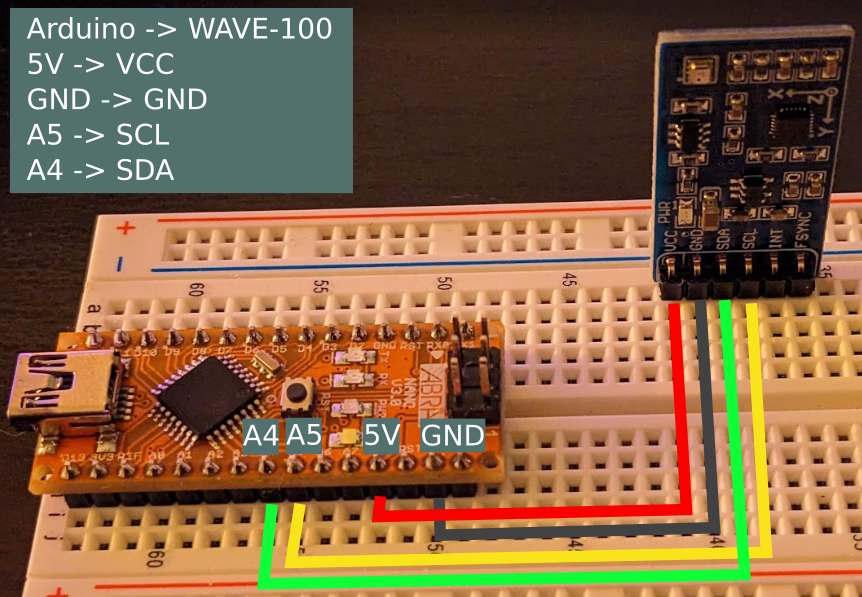
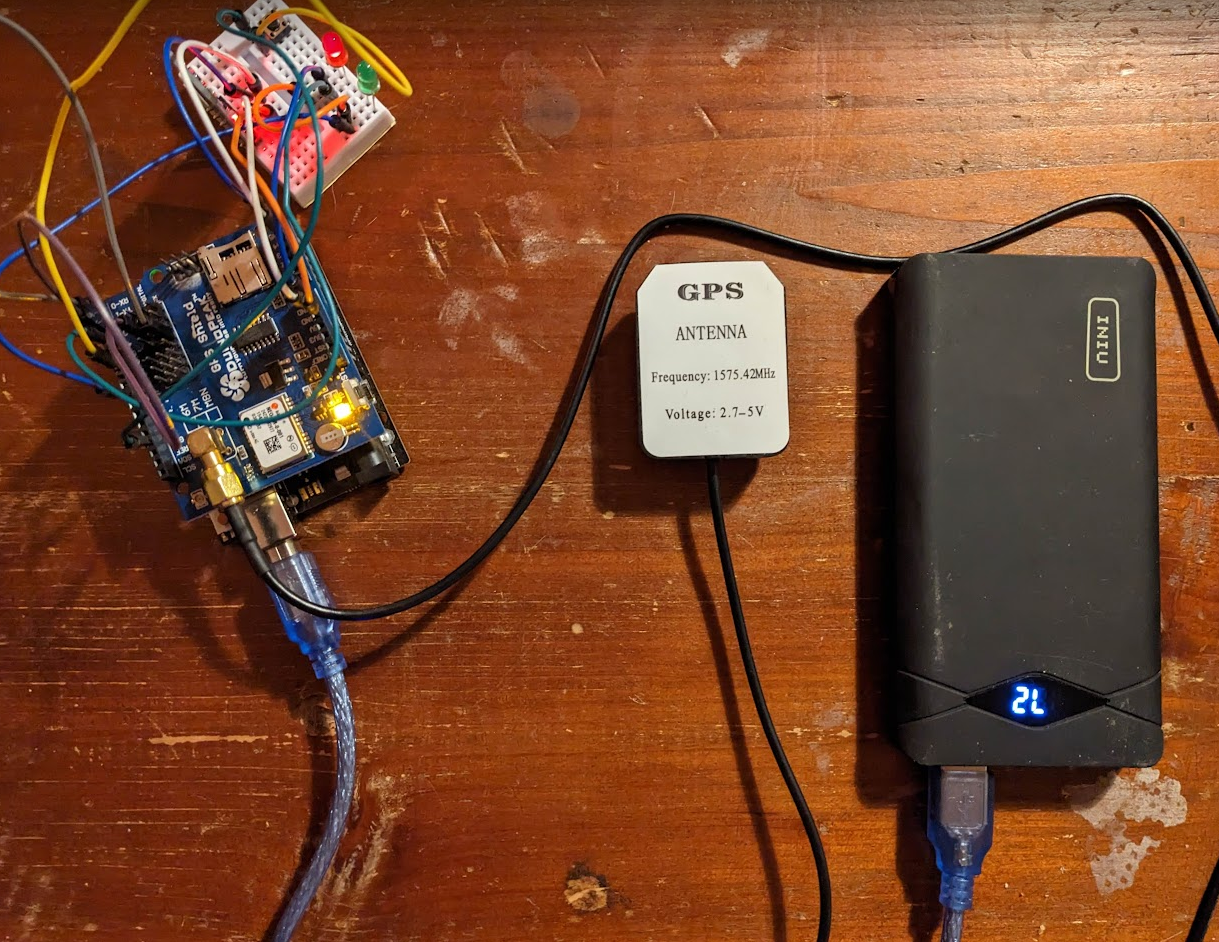
• V3

    karl St-Arnaud11/02/2023 at 02:03 0 comments

    In the last quarter, I set myself the following objectives:

    1. Improve device setup:
    2. Improve data post-process and robustness:
    3. Dash cam comparison

    I worked a lot of (1) and (3) but didn't have that much time for (2)

    Improve device setup

    I built an enclosure for the device. It is now easier to transport with me all the wore that are now contained inside one box.


    I also printed a small adapter which allow me to attach the IMU device to the computer holder on my bike. 

    I didn't have the chance yet to get proper measurements on my bike as this was shaking too much and got miss-connection. Now that I glue the wire I hope to get better results the next time I am going out with the device.

    Dash cam comparison

    (See video attachment)

    The Hero 9 black has an embedded IMU and GPS device that I use to measure the vibration data. Here how I proceeded to get the following video

    How

    1. Extract the telemetry data of the GoPro
      1. I must say I thought this would be easier but thanks to the following library I was able to extract the telemetry data without cost.
    2. I use the library I presented in the V2 log to process the data the acceleration data of the GoPro
      1. Note: since the GoPro wasn't oriented on a particular axis, I simply used the norm of the acceleration data to measure the vibration component.
    3. I used ffmpeg to extract image frames of the video
    4. I used PIL, plotly to overlay the metric on every frame
    5. Recombine the video using ffpeg

    Review

    • I am quite satisfied with the overlay of the metric and quality of the road on the video. I think the metric represents quite well in general the quality of the road. 
    • I was quite surprised with the inaccuracy of the GPS components. To some extent, I thought I had made an error in the coordinate reference system at first, but I validated and both the GoPro and Plotly should be using wgs84. Maybe there is something else I forgot, very open to suggestions here.

  • V2

    karl St-Arnaud04/06/2023 at 01:53 0 comments

    Update

    Here are the main updates since my last project log

    • A new version of the measurement device (V2)
    • Process python library
    • GitHub page with complete details about the project (only for v2): I added the link to the project page. Complementary information is available on the README page.

    Goal

    There were two goals in this update

    • Share the current status of the project on GitHub 
    • Being able to take reliable measurements in my car easily with a single unit device (instead of having a laptop + cellphone).

    Measuring device v2

    Measuring device v2
    Figure 1: Electronic diagram of measuring device v2

    The main changes are enumerated below: 

    • Combine IMU and GPS data capture IMU sampling > 100hz
      • GPS sampling at 1 Hz
    • Standalone saving on an SD card (No computer required anymore)
    • Device powered by USB external battery
    • Button to stop and start a capture with LED indicator (saving & error status)

    FPS

    The FPS of both sensor GPS and IMU was improved compared with V1

    GPS is now capturing at 1 fps. The previous version used to stop when the car was stopped (as per the application that was used in V1)

    IMU fps is not stable but it is 99% higher than 100Hz.

    Process

    In V1 the process of the data was simply done in a Jupyter notebook. This is easy to use for developing new features and testing hypotheses, but not as useful when coming the time to process a larger volume of data.

    For V2, I developed a small library to automatically process my data. I am not 100% sure yet about the full architecture of the library. I spent quite some time thinking about what should be the main class. After some time, I decided to put my current idea on VScode and agree on improving as I gather more data and get a better view of what should be the main class and function. The figure below depicts the current architecture of the library.

    Figure 2: Post-process library architecture

    There are mainly four classes that are used by the entry point `roadqa_process` to generate a map:

    • GPS: Data class for GPS data point
    • IMU: Data class for IMU data point
    • GpsImu: Aggregate a list of IMU and GPS data points and process them minimally and align them on the same time axis
    • RoadQAMap: Process the vibration metric and display it on a map

    The logic behind the process of v2 is the same as V1. There are essentially three factors to control the process:

    1. Sensibility: Control how sensible the post-process is too small vibration
    2. Threshold: Control the minimum perceptible vibration
    3. Contrast: Control the contrast between low and large vibration

    Process improvement 

    I didn't have that much time to improve the process as I intended to, but I have a few ideas to improve the process:

    1. Modulate the vibration metric with the speed of the car. For example, the vertical acceleration will oscillate more if the car hit a pothole at higher speed.
    2.  For now, most of the analysis is done in the spatial domain. I had the idea of using a spectrogram (Frequency domain). I generated the spectrogram data for the sample data but didn't figure out a way yet to extract relevant information.

    Result

    To validate the functionality of V2, I did a similar capture and analysis as in V1. I drove along a path and noted the outstanding good (2) and bad (1, 3) sections of the road. The figure below depicts the vibration metric along the path with some photos extracted from the latest google street view that show the condition of the road side by side with the vibration metric.

    Road vibration map
    Figure 3: Road quality map comparison

    Next step

    • Improve device setup: Right now there is several wire and no box to contain the full device. I want to print a 3D box for the full device to make it easier to transport.
    • Improve data post-process and robustness: I want to capture data along a specific path to see the variability of the data and optimize the post-process.
    • Dash cam comparison: The state of the routes is changing quite fast and I would like to get a better comparison of road quality using a dash cam for the next analysis....
    Read more »

  • First version

    karl St-Arnaud02/17/2023 at 05:06 0 comments

    Context

    When I start a project, I like to do a first quick iteration to estimate if my idea have potential to succeed. The goal of this first iteration is not to go too deep in the detail of the implementation, but more to estimate the potential and feasibility of the project. For this first version, I designed a first proof of concept and tested it with a road test.

    Methodology

    Material

    • Arduino nano
    • 10 DOF IMU (WAVE-100)
    • Custom build mount (see hardware mount section below)
    • Cellphone for GPS data tracking (using geo tracker application)

    Note: I went with a cheap IMU here to reproduce what is mostly available in common massively available device. I know there much better device out there specialize in vibration measurement.

    Electronic / software

    The WAVE-100 is communicating with  the arduino Nano using I2C protocol. The connection diagram is presented below:

    I used one of the examples of an open-source library to log the data out of the IMU sensor using Arduino. Then I use putty  to log the serial data from port /dev/ttyUSB0 into a text file. Each set of IMU data is timestamped with millisecond accuracy. For now the IMU data are log at 10Hz (quite low).

    Hardware mount

    To be able to get reliable measurements of the accelerator inside the car, the sensor must be fixed still inside the vehicle. I designed a mount that could fit in the cup holder using Freecad and print it with my creality ender v2. The mount is designed such that the y axis of the accelerator sensor is pointing down..

    Data processing

    Time alignment

    One of the first step was to align the IMU and GPS on the same time axis. The GPS timestamps are provided by the GPS itself. The IMU data are simply a clock increment to millisecond precision from the start of recording of IMU data. For this first proof of concept, I simply found the offset between the GPS and IMU manually based on the principle that GPS and IMU data are not changing when the vehicle is at a stop.

    Vibration metric

    These are the steps of the post process that were applied to the raw acceleration data to retrieve a metric to estimate road quality.

    1. Differential of y axis acceleration
    2. Scale the result to the power of n>1
      1. This will increase the contrast between low and high vibration
      2. Then we can applied a threshold to scale down all the lower vibration
        1. There are a lot of vibration inside a car and we only want to isolate the vibration that stand out from the others.
    3. Scale back up the result to a power of m<1

    Result

    The map below is showing the processed acceleration data overlay on top of the GPS data. Green colour showing part of the road where the road quality metric was good and red the part were it was particularly bad.

    During the ride, I identified two main areas where the road was particularly bad (1, 2) and one area where the road was good (3). As depicted in the above figure, the metric was able to identify those with the right metric value.

    Next step

    • I will share the CAD, process file and raw data on Github (ETA: 15 March 2023)
    • Improve process of data
    • My next iteration of the electronic module is ready (I am planning testing on the road in March)
      • Better acquisition rate > 200Hz
      • Standalone electronic module
      • GPS integrated