 electronicsworkshops
Introduction
An Arduino-based weather station using a DHT11 sensor and a 16×2 LCD is a compact and accessible project for measuring and displaying real-time temperature and humidity data. The DHT11 sensor collects environmental information, while the LCD display visually presents it in a user-friendly format. This project serves as a hands-on introduction to Arduino programming and sensor integration, making it an ideal choice for beginners interested in DIY electronics and weather monitoring.
FULL PROJECT LINK :
https://electronicsworkshops.com/2023/09/12/arduino-based-weather-station/
Bill Of Materials
| SN | COMPONENTS NAME | DESCRIPTION | QUANTITY | |
|---|---|---|---|---|
| 1 | Arduino Board | Arduino nano | 1 | https://amzn.to/45O52oT |
| 2 | LCD Display | 16x2 LCD Display | 1 | https://amzn.to/3UhShNH |
| 3 | Potentiometer | 10K | 1 | https://amzn.to/3NMyzag |
| 4 | Temperature Sensor | DHT11 | 1 | https://amzn.to/45O5bsr |
| 7 | Connecting wires | jumper wire | some | https://amzn.to/3fMoSw7 |
| 8 | Breadboard | Normal | 1 | https://amzn.to/3FUQlXe |
Connections
DHT11 to Arduino:
- Connect the DHT11 sensor’s VCC to Arduino’s 5V.
- Connect the DHT11 sensor’s GND to Arduino’s GND.
- Connect the DHT11 sensor’s DATA pin to any digital pin on Arduino (e.g., D2).
LCD to Arduino:
- Connect the LCD’s VCC to Arduino’s 5V.
- Connect the LCD’s GND to Arduino’s GND.
- Connect the Arduino D3 Pin to LCD’S DB6 Pin
- Connect the Arduino D4 Pin to LCD’S DB5 Pin
- Connect the Arduino D5 Pin to LCD’S DB4 Pin
- Connect the Arduino D6 Pin to LCD’S DB7 Pin
- Connect the Arduino D11 Pin to LCD’S E Pin
- Connect the Arduino D12 Pin to LCD’S RS Pin
- Connect the Arduino Contrast pin (usually labeled VO) to the wiper of the potentiometer.
- Connect one end of the potentiometer to 5V and the other end to GND.
Working Principle
The working principle of an Arduino-based weather station using a DHT11 sensor and a 16×2 LCD involves several steps:
- Sensor Data Collection: The DHT11 sensor is responsible for collecting environmental data, specifically temperature and humidity. It operates by using a thermistor to measure temperature and a humidity-sensitive capacitor to measure humidity. The sensor converts these analog measurements into digital data that can be read by the Arduino.
- Arduino Control: The Arduino serves as the brain of the weather station. It reads data from the DHT11 sensor through a digital pin and processes this data in its program (sketch).
- Data Processing: Inside the Arduino sketch, the collected temperature and humidity data are processed. You can apply any necessary calibration or formatting to the raw sensor readings.
- LCD Display: The processed data is then sent to the 16×2 LCD display. The LiquidCrystal library is typically used to control the display. The Arduino sends text and numerical values to the LCD, positioning them on the two rows of the screen. For example, it may display “Temperature: 25.5°C” on the first row and “Humidity: 50%” on the second row.
- Updating Display: To keep the information up to date, the Arduino continuously reads data from the DHT11 sensor at predefined intervals (e.g., every few seconds or minutes) and updates the content on the LCD accordingly.
- User Interaction: The LCD provides a visual interface for users to monitor the real-time temperature and humidity values without needing to access the Arduino’s code or a computer interface.
- Power Supply: The Arduino and its components are powered through a suitable power source, such as a USB connection, a battery pack, or an external power supply, to ensure continuous operation.

Schematic Diagram

PCB Diagram

3D Diagram


Manufacturing Files
Gerber file
Position File
Bill Of Materials File
Order Directly from PCB WAY
I have already uploaded all these required manufacturing files in PCBWAY website. You can easily go to the below...
Read more »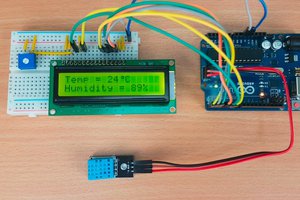
 kamalkedin123
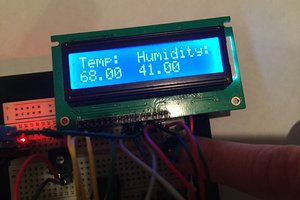
 Andy
Andy
 ElectronicABC
 AskSensors