 Michael Doody
-
Another minor seismic event
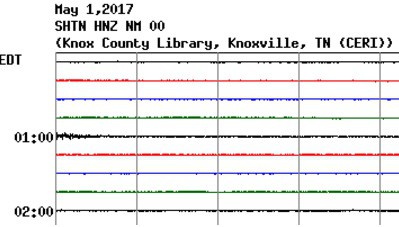
05/01/2017 at 20:58 • 0 commentsThis morning at 1:00 AM another very small distant event showed up on several of the East Tennessee machines - at the Knoxville, Bacon Ridge and Sewanee locations and on the Copper Ridge short period machine,
Here is that small tremor, cropped out from the Knoxville CERI/USGS record on the web-
![]()
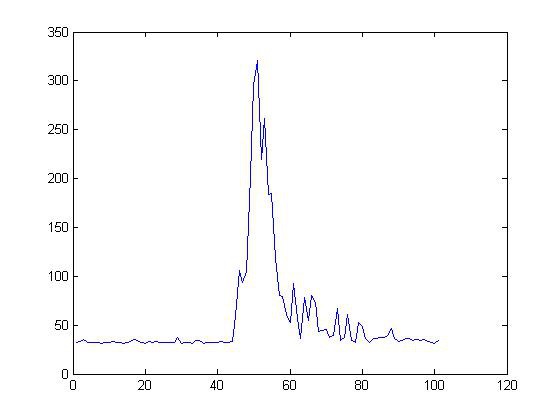
Here is the event as it showed up in the vector magnitude data of one of the garage slab machines -
![]()
Here is the vector magnitude data from the 100 seconds around that event-
![]()
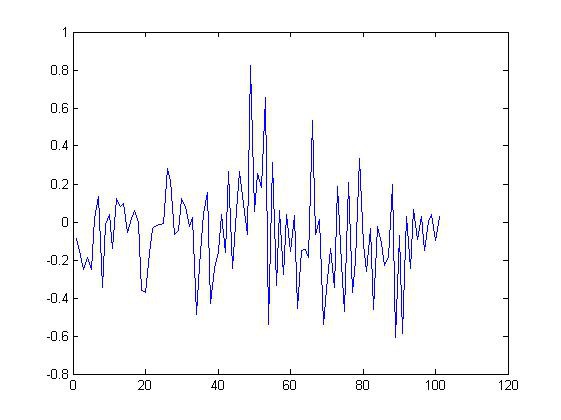
Here is the location data for that same time interval - expressed in radial distance (in radians) from the average compass location of the noise. As with most (but no all) of the distant events that have been recorded so far, the location seems to bounce around - possibly due to echoes and reflection from our regional mountain chain - the Smokey Mountains.
![]()
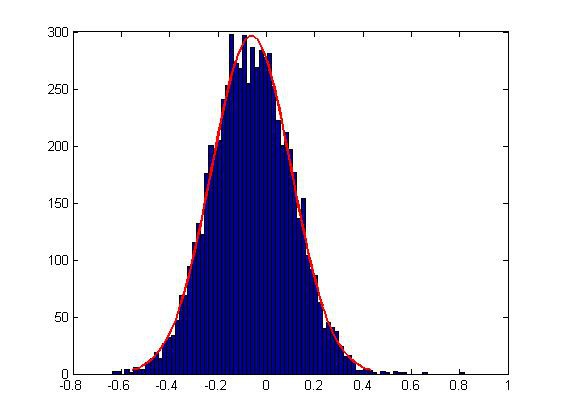
To give meaning to this graph, the next graph shows the distribution of the radial (compass) position of the noise for the 2 hours surrounding the event. The averaging is done in such a way that the distribution should peak at North, or 0 on this graph. The 0.8 value at the peak of the small tremor (see the graph above) is the highest value recorded in that 2 hour interval. Basically, the values greater than 0.4 radians and less than -0.4 radians are statistical outliers.
![]()
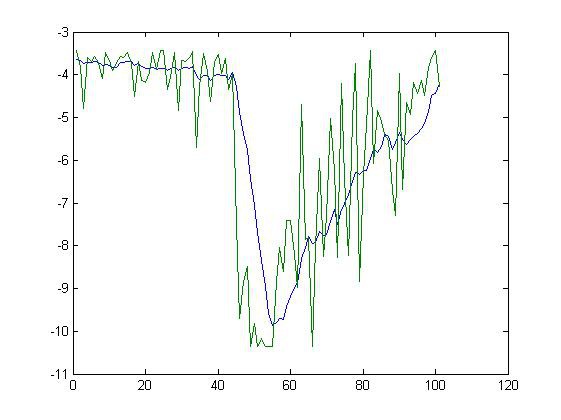
The next graph shows the combined probability statistic of the event (green) along with its 5 second running average (blue). Again, this is a logarithmic scale, so the probability values change by 6 orders of magnitude as the event progresses.
![]()
As with the event from several days ago, there was no major advance warning from the statistics data, possibly because of the distance of the event from our machine. There was an unusual brief 2 order of magnitude drop to around -5.8 in the graph about 10 seconds before the main event, however.
-
Data collection results
04/22/2017 at 18:20 • 4 commentsAt 2:32 AM EST on April 22, 2017 a typical tiny 30-40 second seismic event was detected at the Knoxville CERI/USGS seismometer. It was also recorded at the Copper Ridge, Tn CERI seismometer, so it is not a local event. The following images display the output from their device and our device in response to that remote event. This particular event is chosen to be shown because (1) it happened this morning and (2) it is a typical tiny event that shows off the capabilities of this device well.
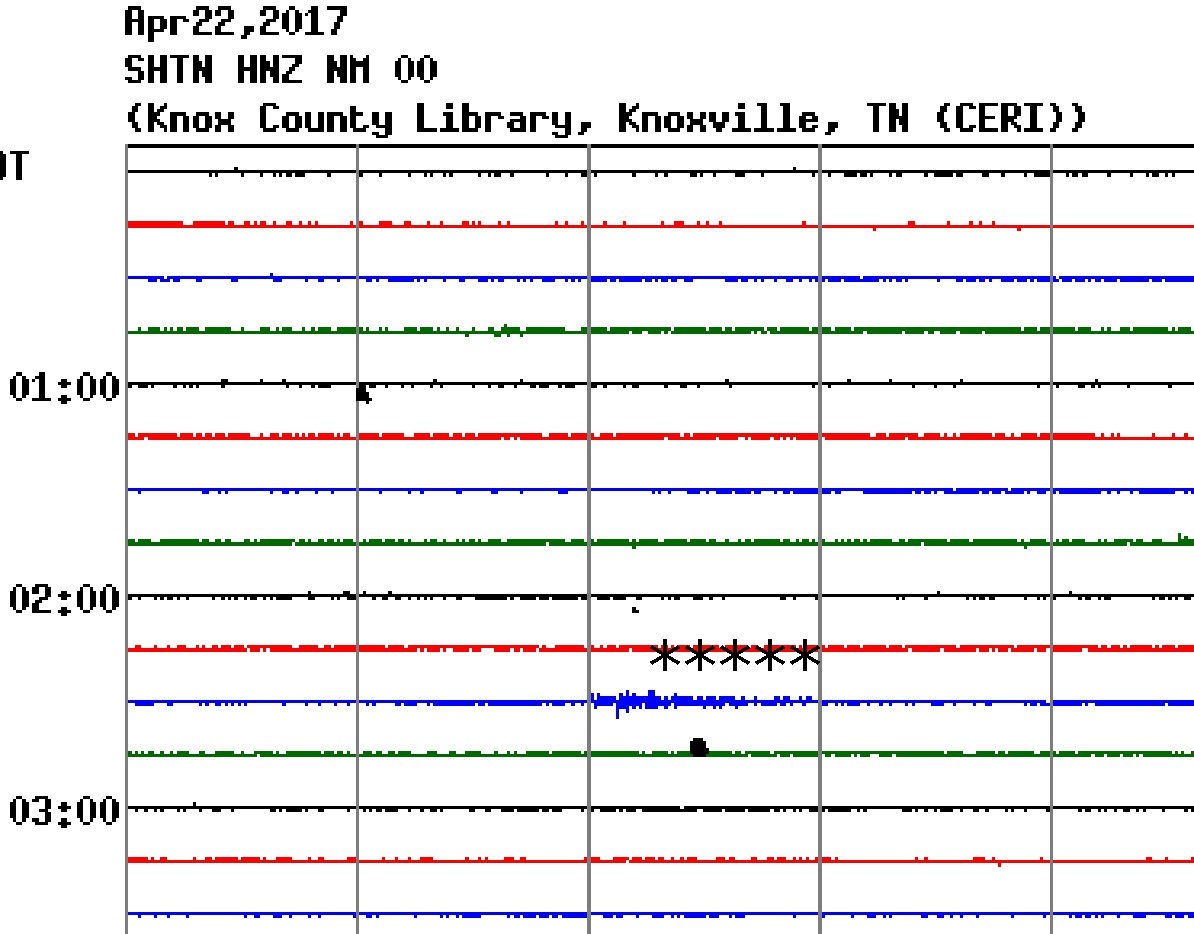
This is the CERI/USGS seismometer reading, downloaded from their website. The relevant event downloaded from their website is cropped out and marked with asterisks.
![]()
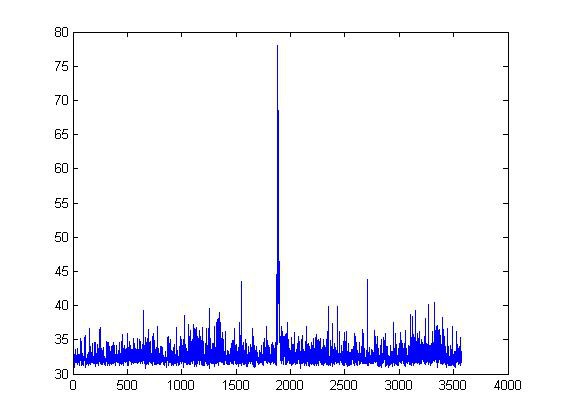
This is the vector magnitude graph for the 2 - 3 AM time period of our vector seismic device showing its response to the same event. The graph shows 1 second per time points, therefore 3600 readings per hour. The peak at 2:32 AM is approximately 1/10 of the device's full scale.
![]()
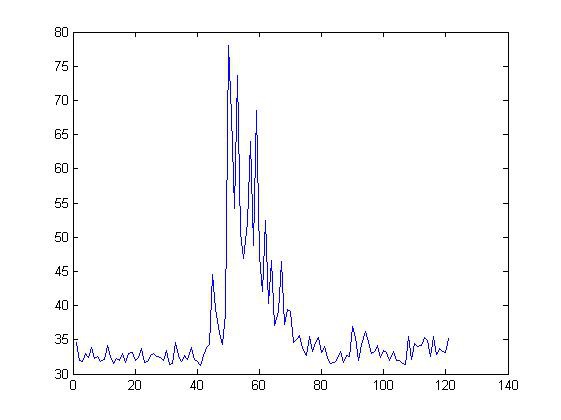
Here is the vector magnitude data from the event on a shorter time scale - x axis is seconds.
![]()
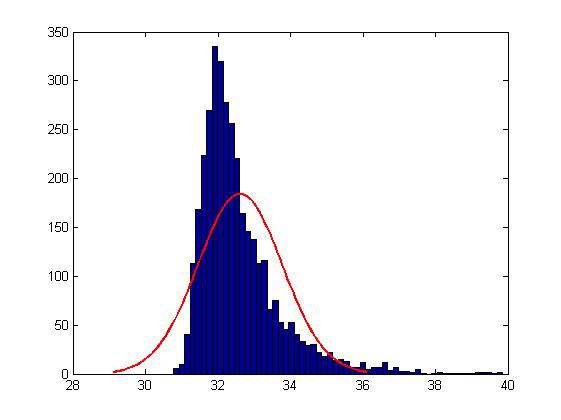
The next graph shows the distribution of the vector magnitude over that hour. The tiny and brief tremor would not significantly affect the overall distribution of the noise over an hour, but those time points were removed. The important point is that this data does not conform to an ideal gaussian probability (red curve.) This data is skewed to the right, as would be expected if a significant proportion of seismic noise is coming from local sources. It is exactly this hypothetical characteristic of seismic noise that this project was hoping to detect and exploit. The whole purpose of the femtoampere amplifier is to broaden the distribution, so subtle changes in the "right side" shoulder region can be discriminated easily. This is only one hour's worth of data - the incoming data is matched to a probability table that is based on the first 100,000 measurements after the program starts up. Then every new data point is assigned a probability value from that table as well.
![]()
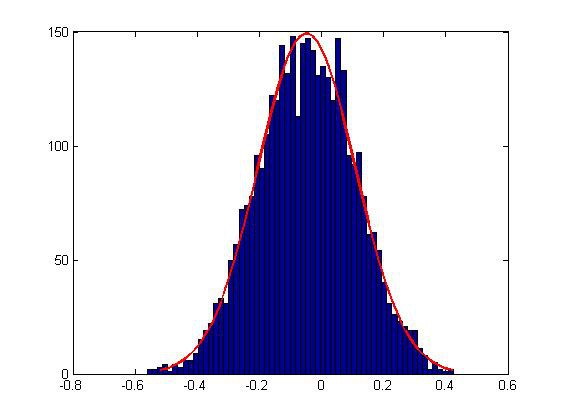
The next graph is the 2D geospatial distribution of the averaged location of the noise energy timepoints between 2 AM and 3 PM. -Pi radians would represent South), 0 radians would represent an average of North) +Pi radians would be South again. Each one second time point is the average of 50 calculated vectors. For pure noise with a well calibrated device, the peak of the gaussian curve should be at zero. Local noise from random sources would not be expected to shift the gaussian distribution of noise direction. For this time interval the actual measured average was -0.04818 radians. Again, each new location measurement is matched up to a probability table derived from 100,000 measurements and assigned a probability from that table.
![]()
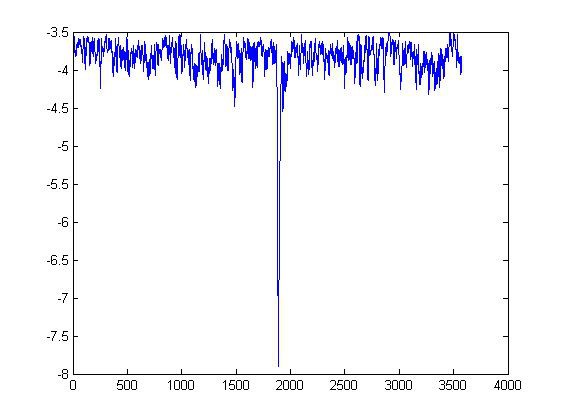
The next graph is the combined probability statistic for the 2 - 3 AM time period. The combined probability is basically the overall probability of having readings of that particular average magnitude coming from that particular average 3D radial direction. The two independent probabilities are multiplied in order to get the combined probability result. Note - there is essentially no correlation between the location and the magnitude when large numbers of noise level signals are analysed. It's clearly different for event related signals. This graph shows a 5 second running average of the data. Note that this is a logarithmic scale - the variation in the probability statistic is actually quite large.
![]()
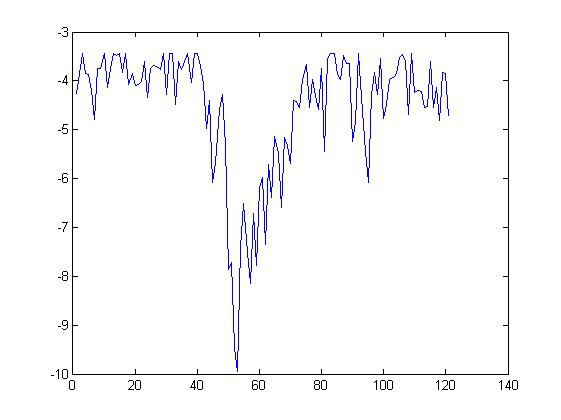
Here is the probability data on a shorter time scale - again, x axis is in seconds. The data is from the same time interval shown above for the vector magnitude data. This is the actual data, not a 5 second running average. Because this is a logarithmic scale, there is a million-fold change in this value within seconds of the appearance of the tremor event. The traditional USGS seismometer barely detected the event (see above).
![]()
There was no real discrepancy this morning between the onset of the combined probability event and the vibration magnitude event, because this was not a local event. An earlier seismic event some months ago was only 12 miles away form the device and it was predicted approximately 50 seconds in advance by a major deviation in the combined probability statistic. More experience with truly local events is clearly needed
Device for Seismic Noise Analysis
Could a digital device to analyze the statistics of the magnitude and 3-D origins of seismic noise predict some local earthquakes?
