Close
0%
0%

Device for Seismic Noise Analysis

Could a digital device to analyze the statistics of the magnitude and 3-D origins of seismic noise predict some local earthquakes?

Similar projects worth following
Building collapse is what actually kills people when major earthquakes hit impoverished urban areas with substandard housing. There are 7 earthquakes that have each killed over 100,000 people in the past century. 223,000 people died in Haiti a decade ago - now forgotten. A reliable warning on the order of tens of seconds or more would let people move to safer places, but such a system does not yet exist.

The earth is always in motion. This motion is "seismic noise." A new femtoampere amplifier IC now allows the precise measurement of the vector magnitude and 3 dimensional origin of this noise and determination of the statistics of these values in real time. The project reports a new, unique, ultra-sensitive and easily networked digital seismic device built with off the shelf components. It outputs seismic data in vector format and statistical data. Small local seismic signals that were previously lost in the seismic noise can be readily identified.

This completely open source project breaks down into four main parts.

1) Part 1 -Seismic sensor

From Wikipedia, the free encyclopedia -

"In geology and other related disciplines, seismic noise is a generic name for a relatively persistent vibration of the ground, due to a multitude of causes, that is a non-interpretable or unwanted component of signals recorded by seismometers."

The role of the hacker here might be to challenge that bit of conventional wisdom. Let's see where it goes if we put the magnifying glass on seismic noise instead of intentionally ignoring it.

The new idea behind this project was that if we really study the statistics of seismic noise and  get to know the usual spatial characteristics of noise in seismically active locations, we will be able to tell the difference between that noise and  telltale rock movements - "snaps, crackles and pops" - that might happen locally right before a geological fault line lets loose.

Basically, I am reporting a new kind of design for an ultra, ultra sensitive seismic device for the purpose of responding to the low frequency ( <1.5 Hz ) baseline noise movements of the earth's crust. It outputs information on the vector magnitude, apparent 3D origin (i.e. depth, direction and axis) and actual statistics of each data point. The statistics determine the  probability of having a measurement of that particular strength, direction and depth. The current version of the device (August 2020) records all of this information 4 times per second.

Seismic noise is present everywhere on earth. Some of it is local and some of it arrives from far away. Ocean waves are a one cause of distant noise. Much of it is unexplained.

A little bit of background on the design of this device-

Most useful sensitive seismometers utilize a mechanical moving element with a fixed resonant frequency. Because noise by definition is a composite of a wide range of frequencies, for our purposes this device must not have any significant frequency biases. It must be relatively neutral to all the frequencies in its band. Mechanical designs therefore can't be used for this purpose. Piezoelectic seismic accelerometers are practically frequency independent for seismic purposes and these "geophones" are commercially available, but they are usually very insensitive and they are best used for strong man-made signals in geological exploration. However, piezoelectric pressure sensors still have the theoretical potential for extremely high sensitivity. They have no moving parts or resonant frequencies in the seismic range, they have minimal frequency biases and are widely avaialble in the form of extremely inexpensive but high quality microphone elements. Because of the need for frequency independent noise floor analysis, I needed to design an ultrasensitive inertial piezo instument that pushes its seismic sensitivity to the very limit of what is possible. The other goal is to extract 3D directional information - in other words, to be able to ask "where is the noise (mostly) coming from?" in addition to "How loud is it?" in real time. This has not been done before.

The design is fixed to a wooden base on rubber feet. A stainless steel or mineral sphere is supported by 3 hard insulating plastic beads resting directly on 3  piezoelectric buzzer elements. These elements are themselves symmetrically arranged 120 degrees apart and precisely tilted at a 45 degree angle around the center ball. The buzzer elements are mounted on adjustable supports, like magnetic doorstops available in hardware stores or inexpensive camera tripod heads. Each piezo element provides equal support to the central ball. Movement of the base in any vertical or horizontal direction accelerates the mass and changes the compression force of the ball against its sensors. One of the sensors is aligned to true north as a direction reference. The precise geometry of the device allows for the mathematical calculation of the...

Read more »

yellowstone noise slomo.mp4

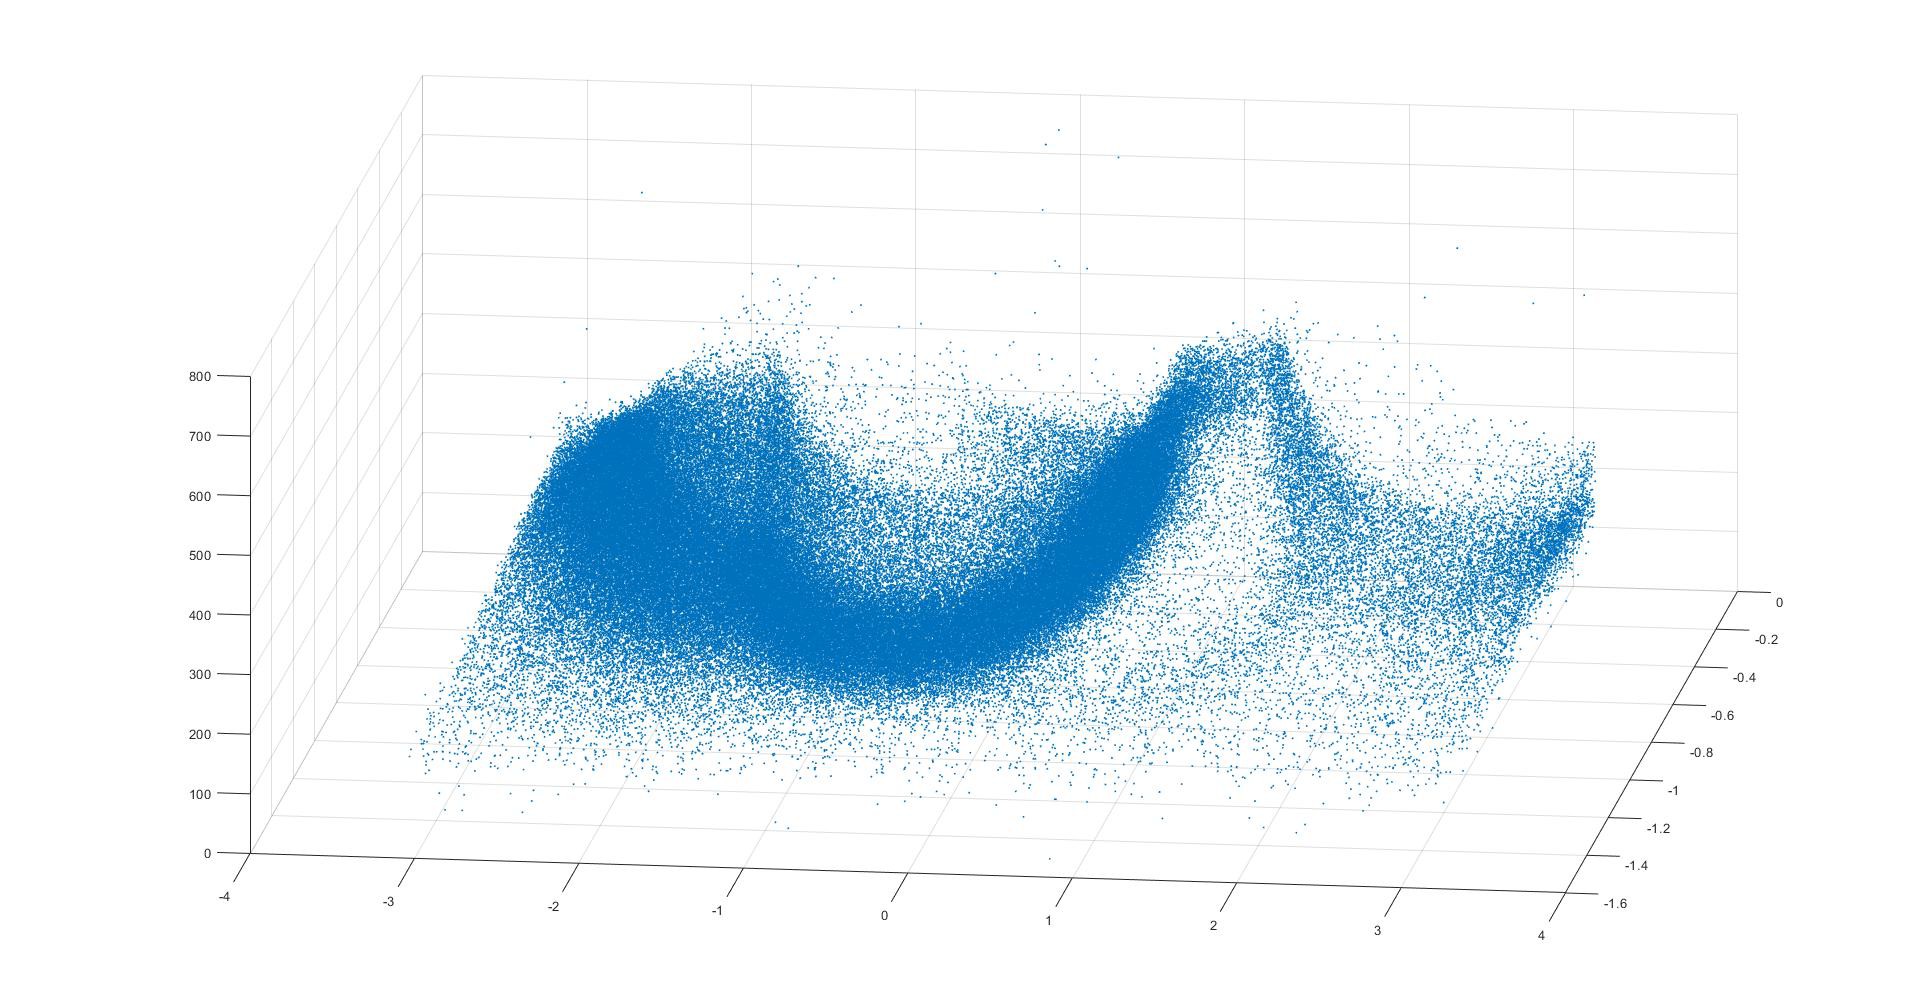
A 3D plot of thirteen hours of noise from the MAdison Valley near the West Yellowstone seismic area. This is a plot of compass location (-pi radians to pi radians, North = 0 radians) vs depth relative to the horizon (0 radians to -pi radians/2) vs the noise's 3D vector magnitude

MPEG-4 Video - 6.46 MB - 03/15/2020 at 15:39

Download

IMG_2575 (1).JPG

A photograph of the basic schematic for one channel of the TI op amp based charge amplifier. I can't add any more photographs to the build instructions section for some reason!

JPEG Image - 381.72 kB - 09/18/2017 at 22:43

Preview

newground.pcb

The Pad2Pad.com design file that contains all needed instructions for manufacture of the PCB. It also contains its own version of the BOM.

pcb - 147.48 kB - 04/28/2017 at 19:30

Download

BOM.ods

Bill of materials

application/vnd.oasis.opendocument.spreadsheet - 13.39 kB - 04/28/2017 at 03:13

Download

  • 1 × Wooden base - see instructions 2 inch thick 8 inch diameter hardwood bowl blank from woodworking store.
  • 1 × Center mass - 3 inch chromium steel ball. Available on Amazon and eBay. See instructions.
  • 3 × Piezo crystal microphone or buzzer elements - see instructions Available on Amazon and eBay.
  • 1 × Assembled 3 channel charge amplifier circuit board - see instructions Pad2Pad, per custom specs- schematic & bill of materials free on request
  • 3 × Texas Instruments LMC662 femtoampere op amplifier And passive surface mount componetns - from Digikey. See Pad2Pad BOM.

View all 9 components

  • Density Plot of Noise Axis vs. Magnitude

    Michael Doody11/05/2020 at 08:09 0 comments

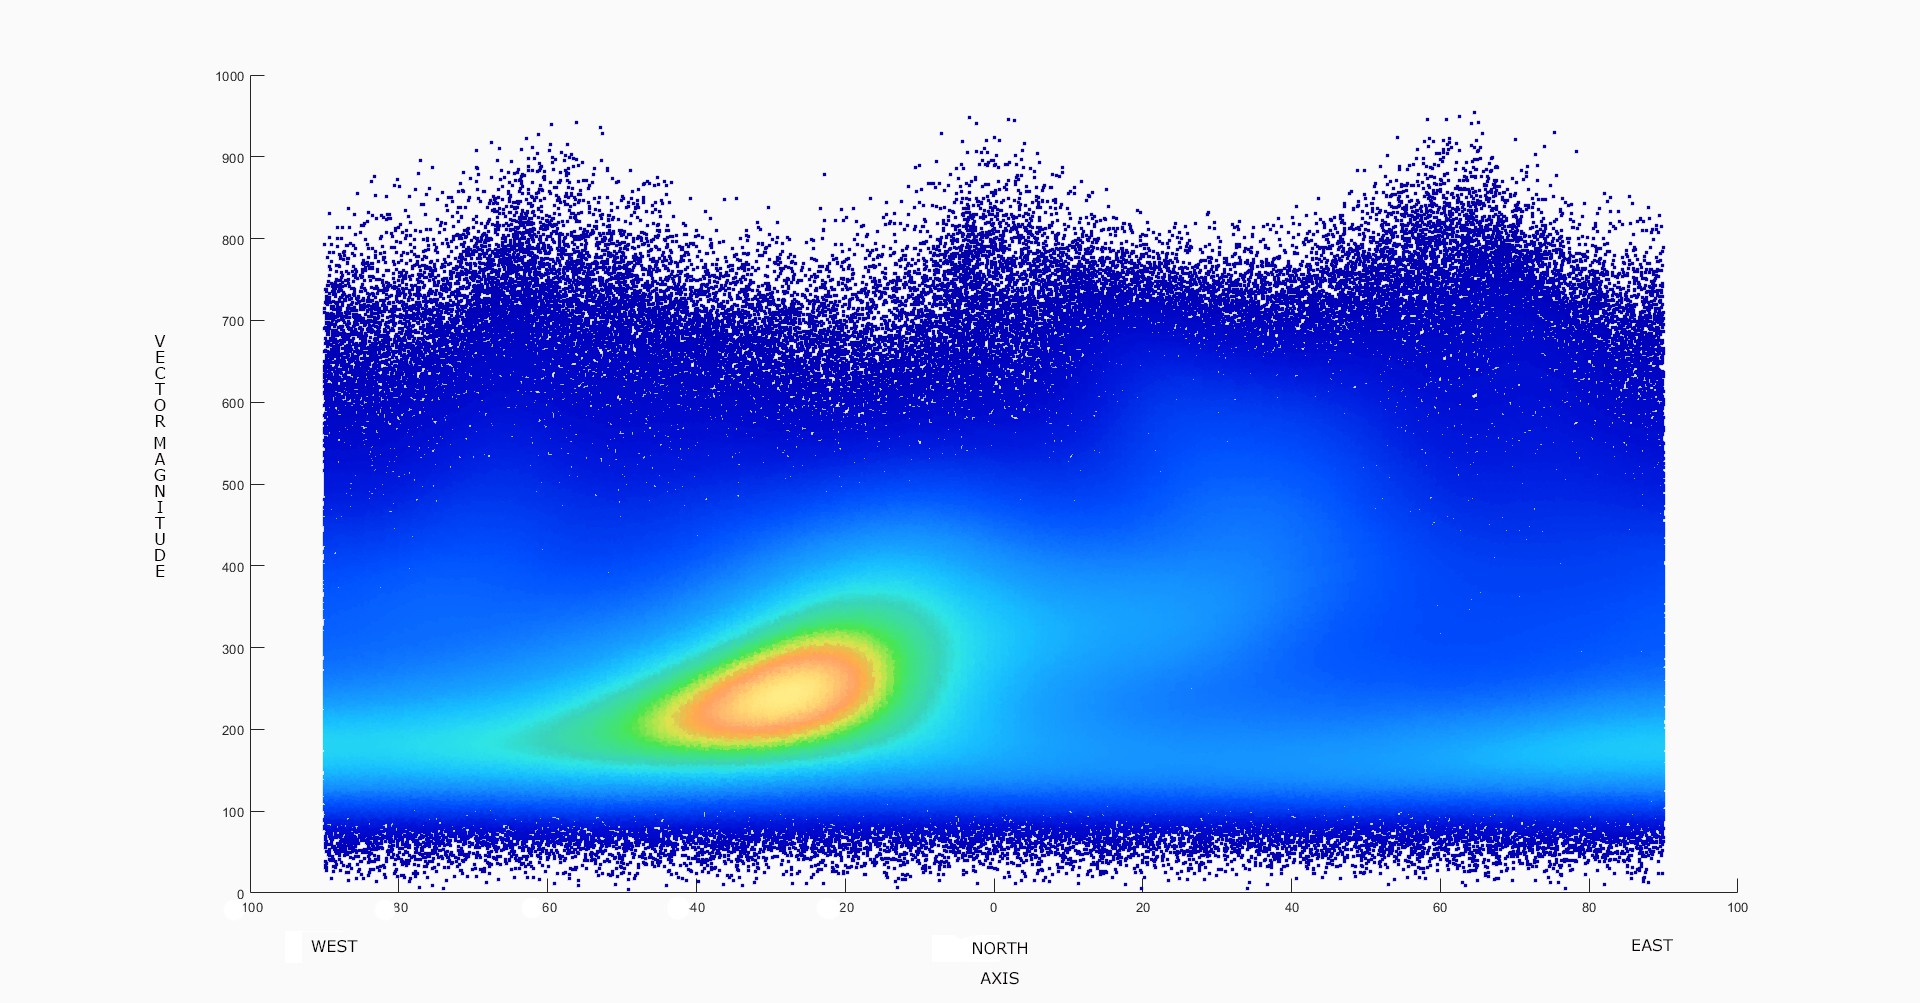
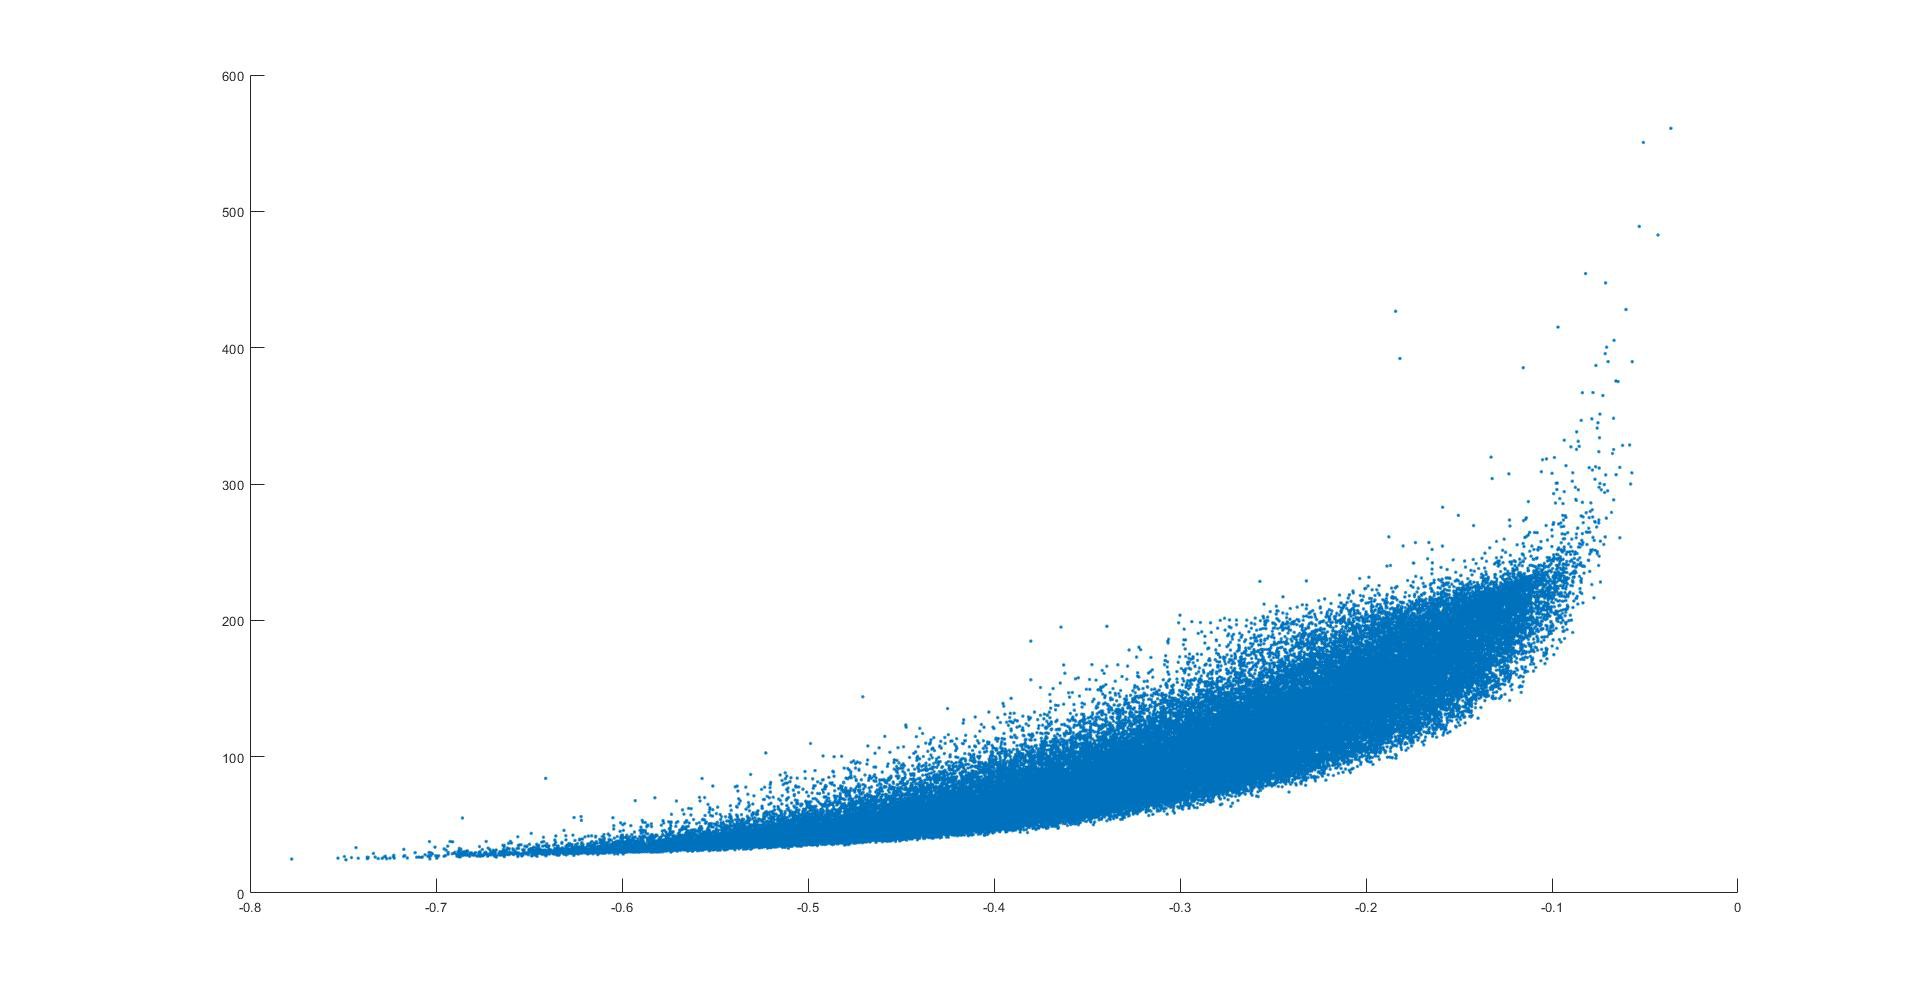
    A density plot can give a better representation of the statistical distribution of the data points with respect to the compass axis. In this plot we are looking at axis of the surrounding noise vs. the vector magnitude of the noise at each time point. The data from 2 1/2 days from 12/24/20 to  12/26/2020 (967,873 time point rows by 13 data type columns) at the Yellowstone machine is represented here. The densityScatter function of Matlab assigns colors and contours to the data based on the density of the data points in the plot.

     North/South is at zero degrees, East/West is at -90 and +90 degrees. The majority of the noise density (yellow and orange) is shown to be aligned in the general direction of the Yellowstone hot spot. 

    However, many of the higher magnitude points (axis  from 30 degrees West to 60 degrees East) seem to be oriented toward the "Dillon" magma plume. Based on the work of others, this plume is believed to dive down through the crust on the East of our machine in a Northwesterly direction, from Yellowstone toward Dillon, Montana. 

    The possibility that the device is also detecting a component of low frequency noise from the turbulence of the Madison River itself  has not been ruled out.  The river runs roughly North/South and is located to the East of the machine. The river has been described as a "50 mile riffle" through the Madison Valley.

  • Major project upgrade and analysis of 950,579 Yellowstone data points

    Michael Doody08/15/2020 at 14:30 0 comments

    The software for the Yellowstone machine has been remotely upgraded in a major revision. Data points are now also expressed in terms of their vector compass axis in addition  to their compass direction origin. Time is now obtained periodically from an internet time server, as opposed to a local clock module for each data point.  The use of a internet time server now allows for much better correlation with the multitude of other research seismometers in the Yellowstone region. 

    The device has also been even further protected against external power fluctuations by basing all analog sensor measurements on an internal voltage reference derived from the  amplifier board itself.

    The probability matrices are now based on 500,000 measurements and the initial sensor calibrations are based on the average of 48,000 measurements.

    Probability matrices now assign each event to 75 "bins" for each measurement of vector magnitude, compass direction and depth. The software improvements  now allow for an average of 4.1 data records  per second. 

    The results are amazing.

      The following data is from August 11, 12, 13 and 14 hours of August 14. There are 950,579 data points included in these graphs. There was no significant human activity nearby during this time period.

                                     CLICK ON ANY OF THE IMAGES BELOW TO ENLARGE

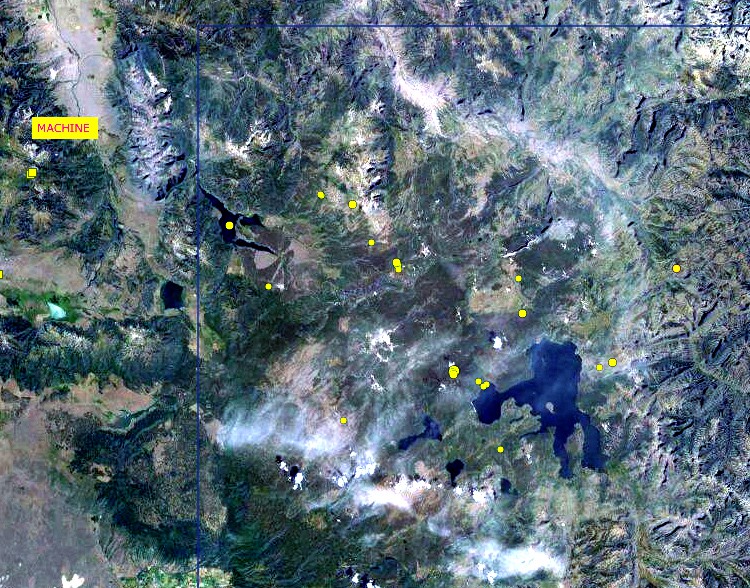
    This image from the University of Utah website gives the location of the device in relation to the local geography. The large lake in the bottom right is Yellowstone lake in the center of Yellowstone National Park. The yellow circles and squares are small earthquakes recorded over the 2 weeks prior to this post. The majority of the small earthquakes are SouthEast of the device.

    The two small earthquakes to the immediate SouthWest of the machine are less than 10 miles from it. These local earthquakes are analyzed in some of the images below. The initial event was preceded by major anomalous seismic noise activity. The aftershock 12 hours later was not as well predicted.  

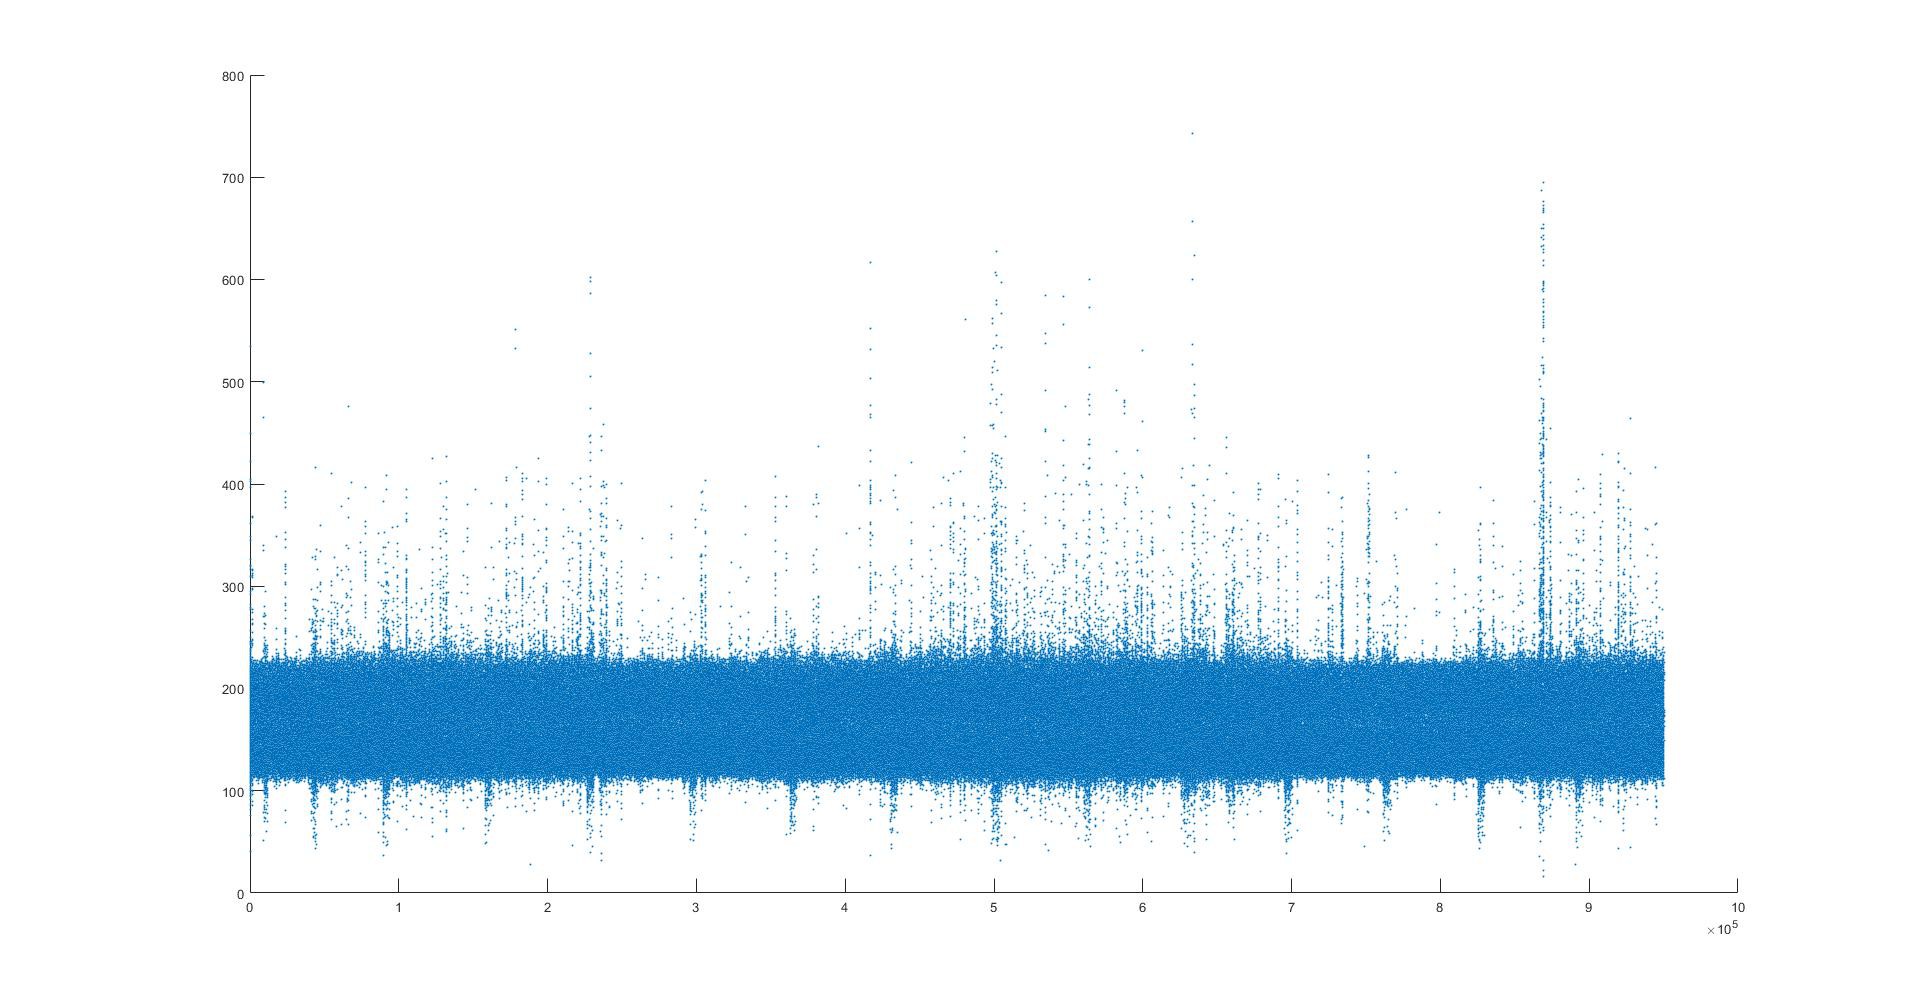
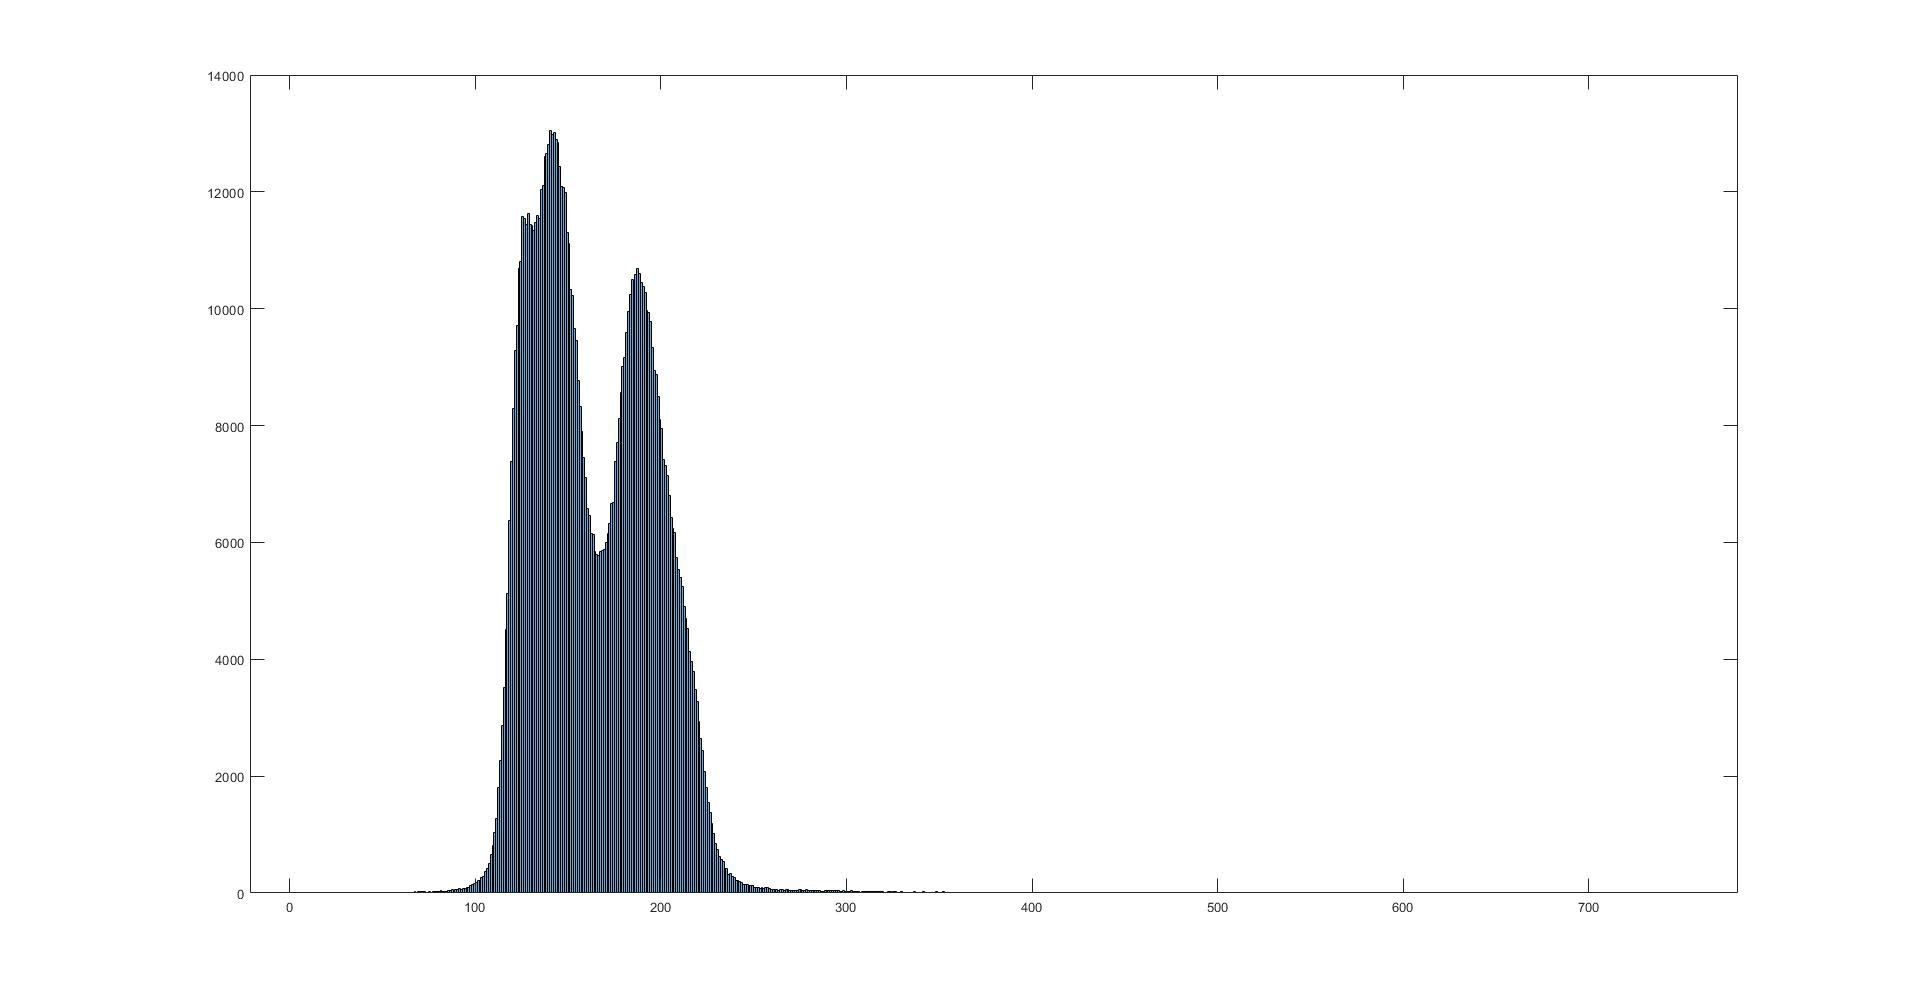
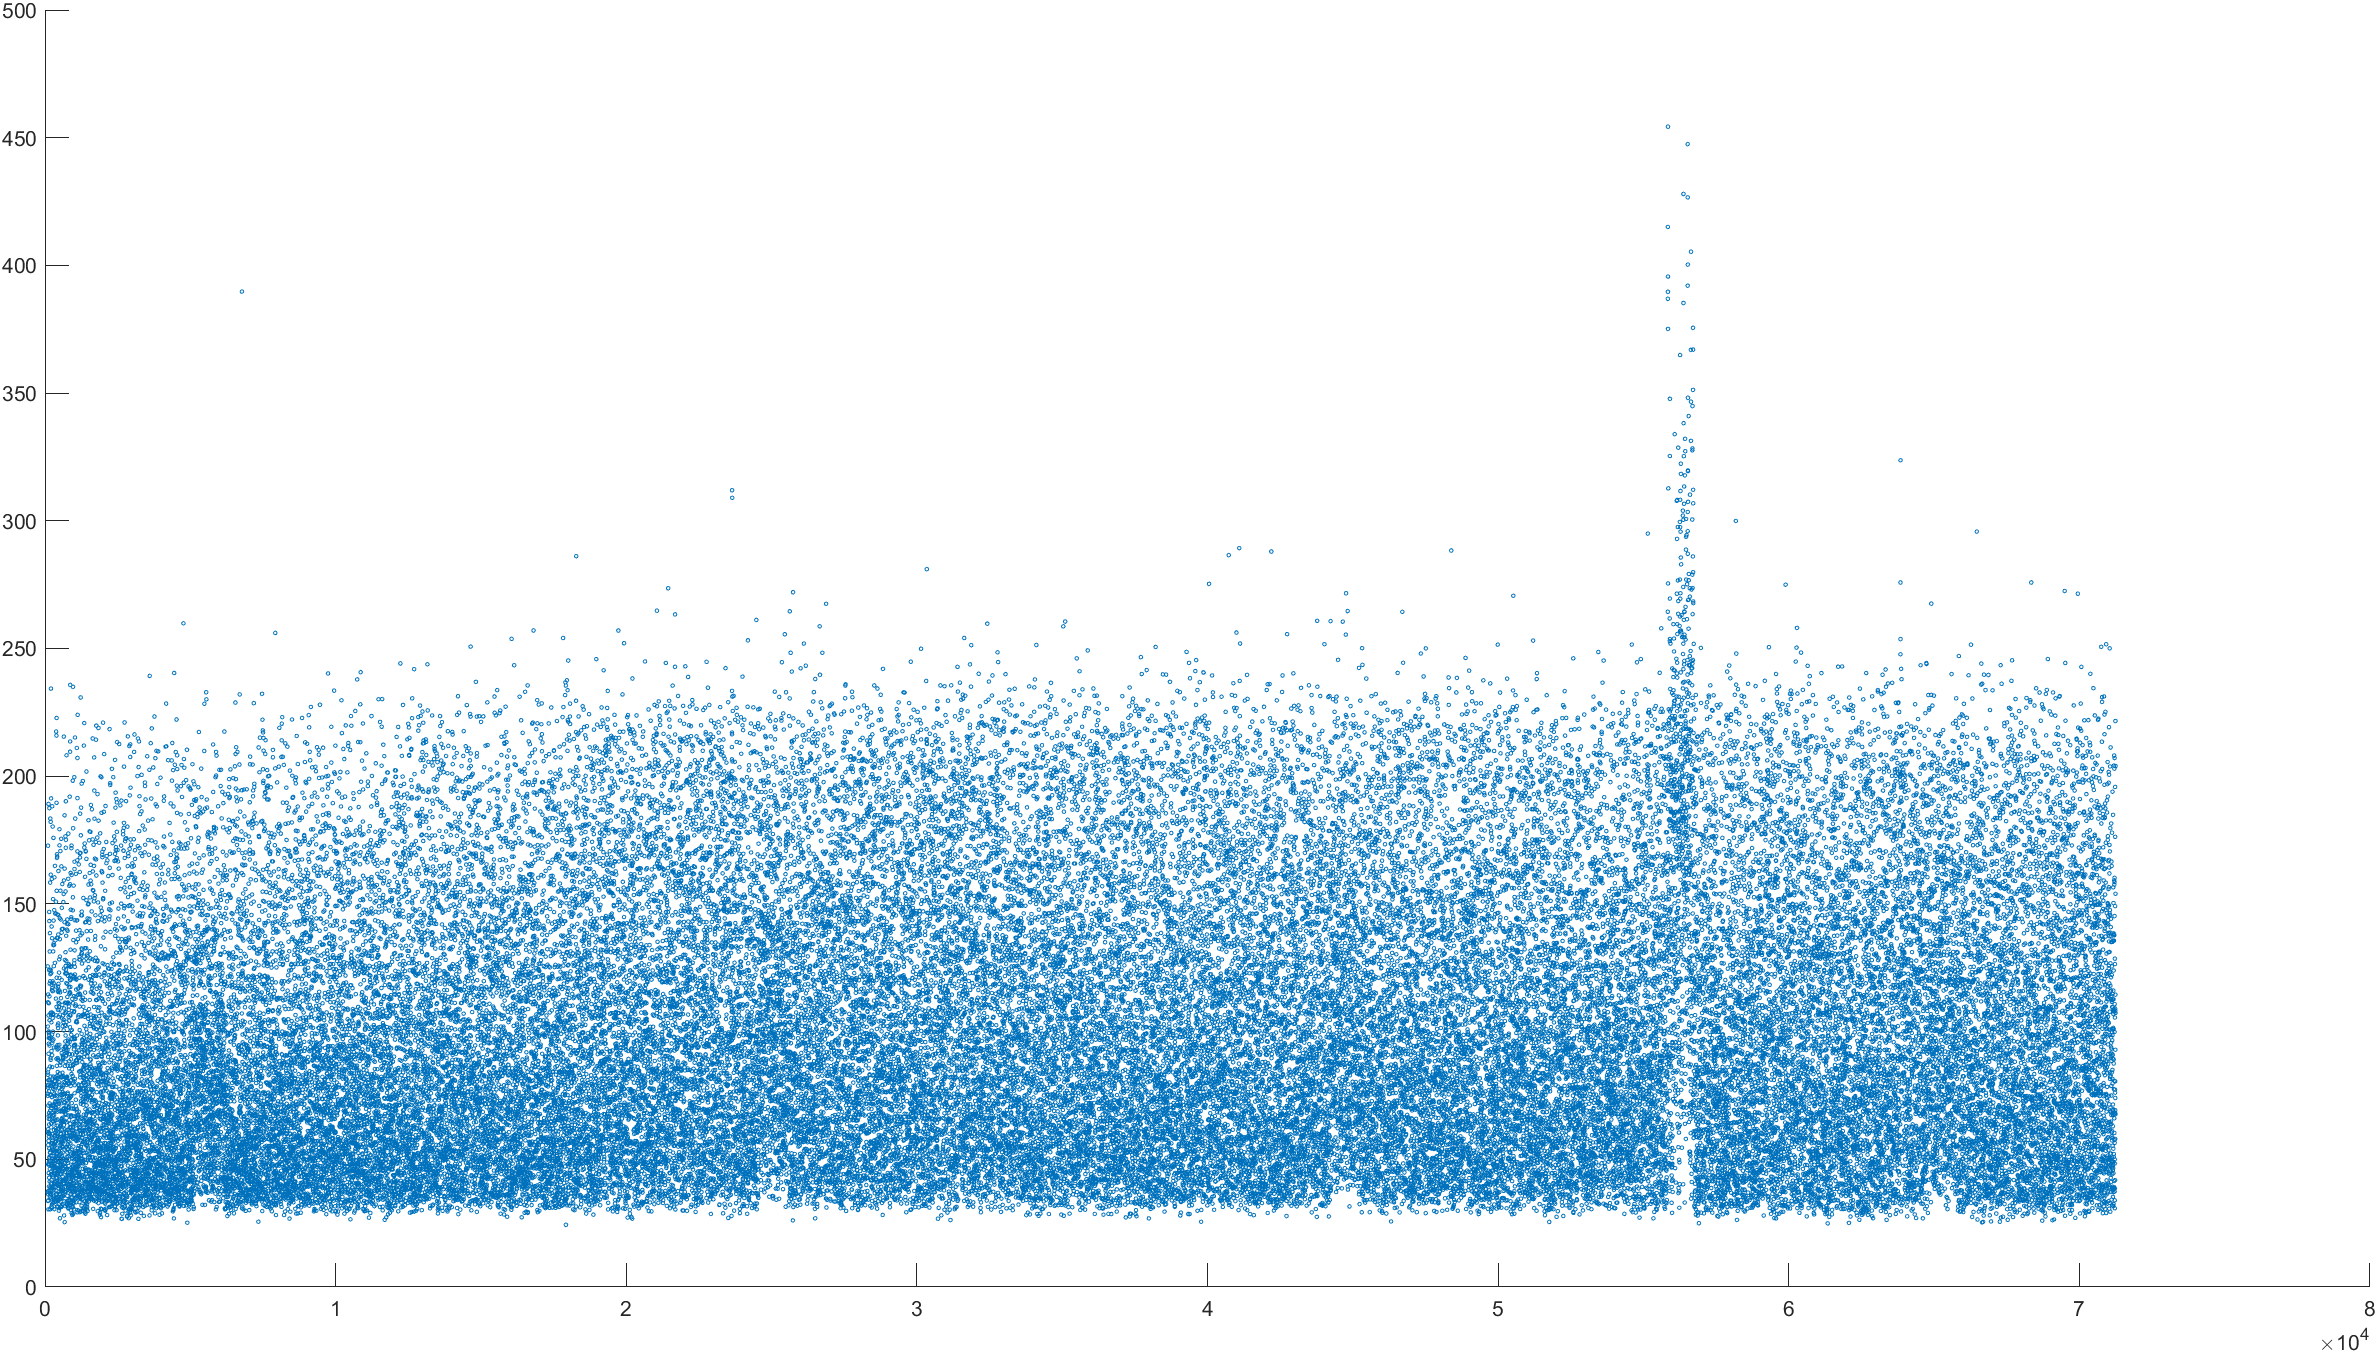
    The next image shows the dot plot of all of the vector magnitude data points for this time interval. 724 vector magnitude units is full scale for this device because the Yun uses a 10 bit A/D converter (1024 bits) and the amplifier output is centered at 512 bits. (No vector will be greater than the square root of 2 X 512 squared.) 

    Two local events are included in this data. They were reported to be  Richter magnitude 1.5 and 1.7 by the University of Utah seismic program. They were about 12 hours apart in nearly the same location (immediately below the "machine" label on the map above.) 

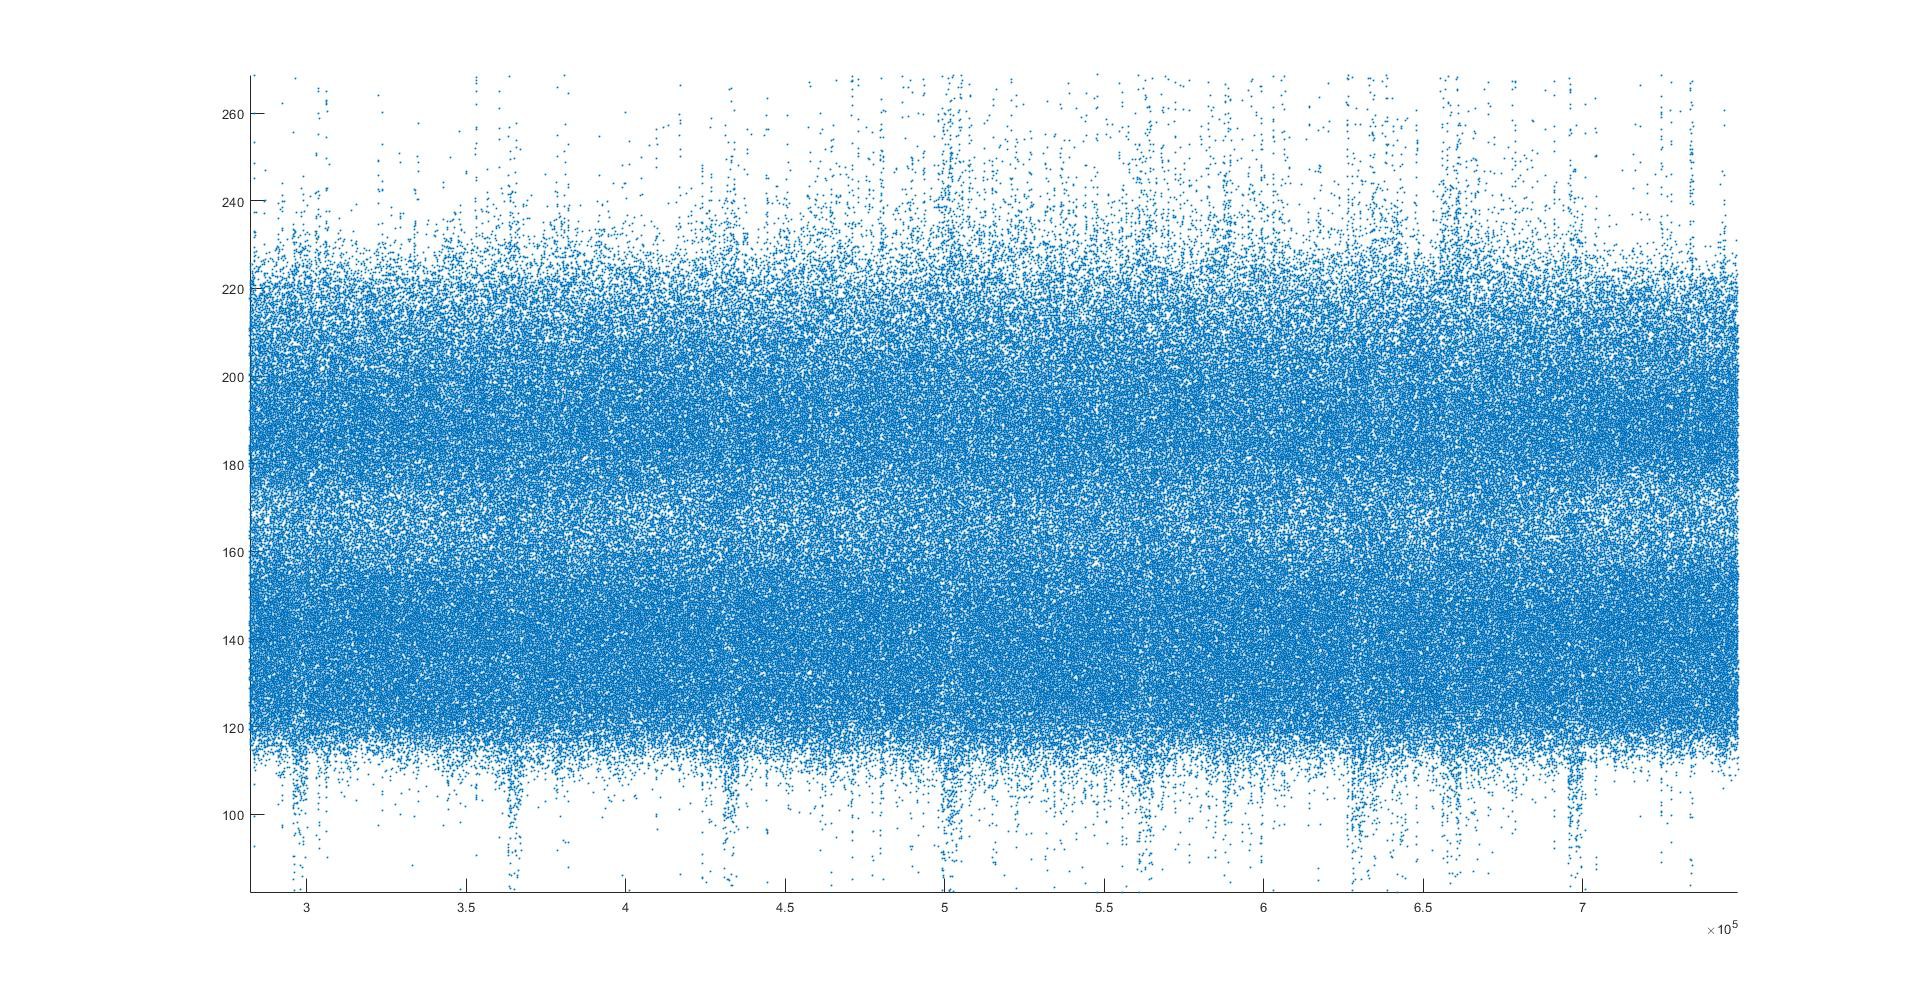
    This is a zoomed in area of a portion of the dot plot above, showing a bimodal structure within the local noise. The repetitive signal is likely to be from a nearby pump. Even closer looks at this noise with moving mean averaging shows that a large portion of the overall noise is episodic - it is the composite of many small events. The bimodality seems to be clearly related to the fact that there are 2 sources of the noise - a constant,  stronger noise from the Yellowstone area and the "global" noise from around the world.

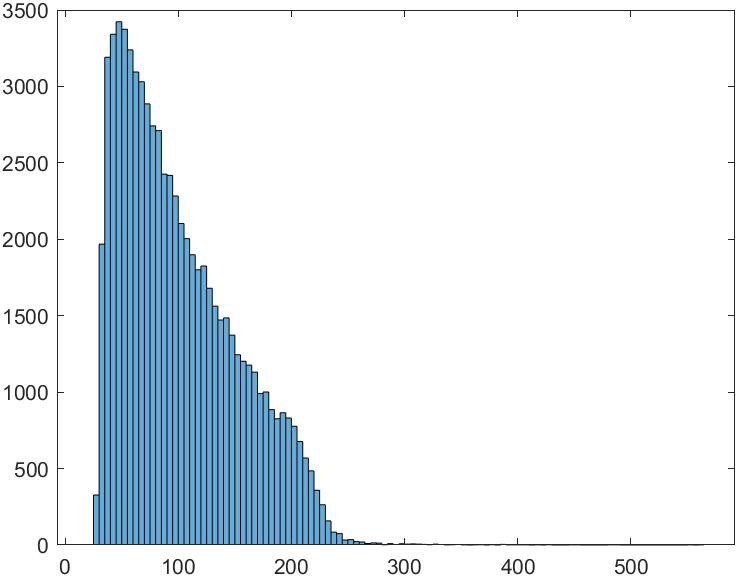
    The following image is a histogram clearly showing the bimodal distribution of the vector magnitude values. I believe that the bimodality is related to the fact that about 60% of the seismic noise seen by this machine is from around the globe and about 40% is from Yellowstone caldera related events.

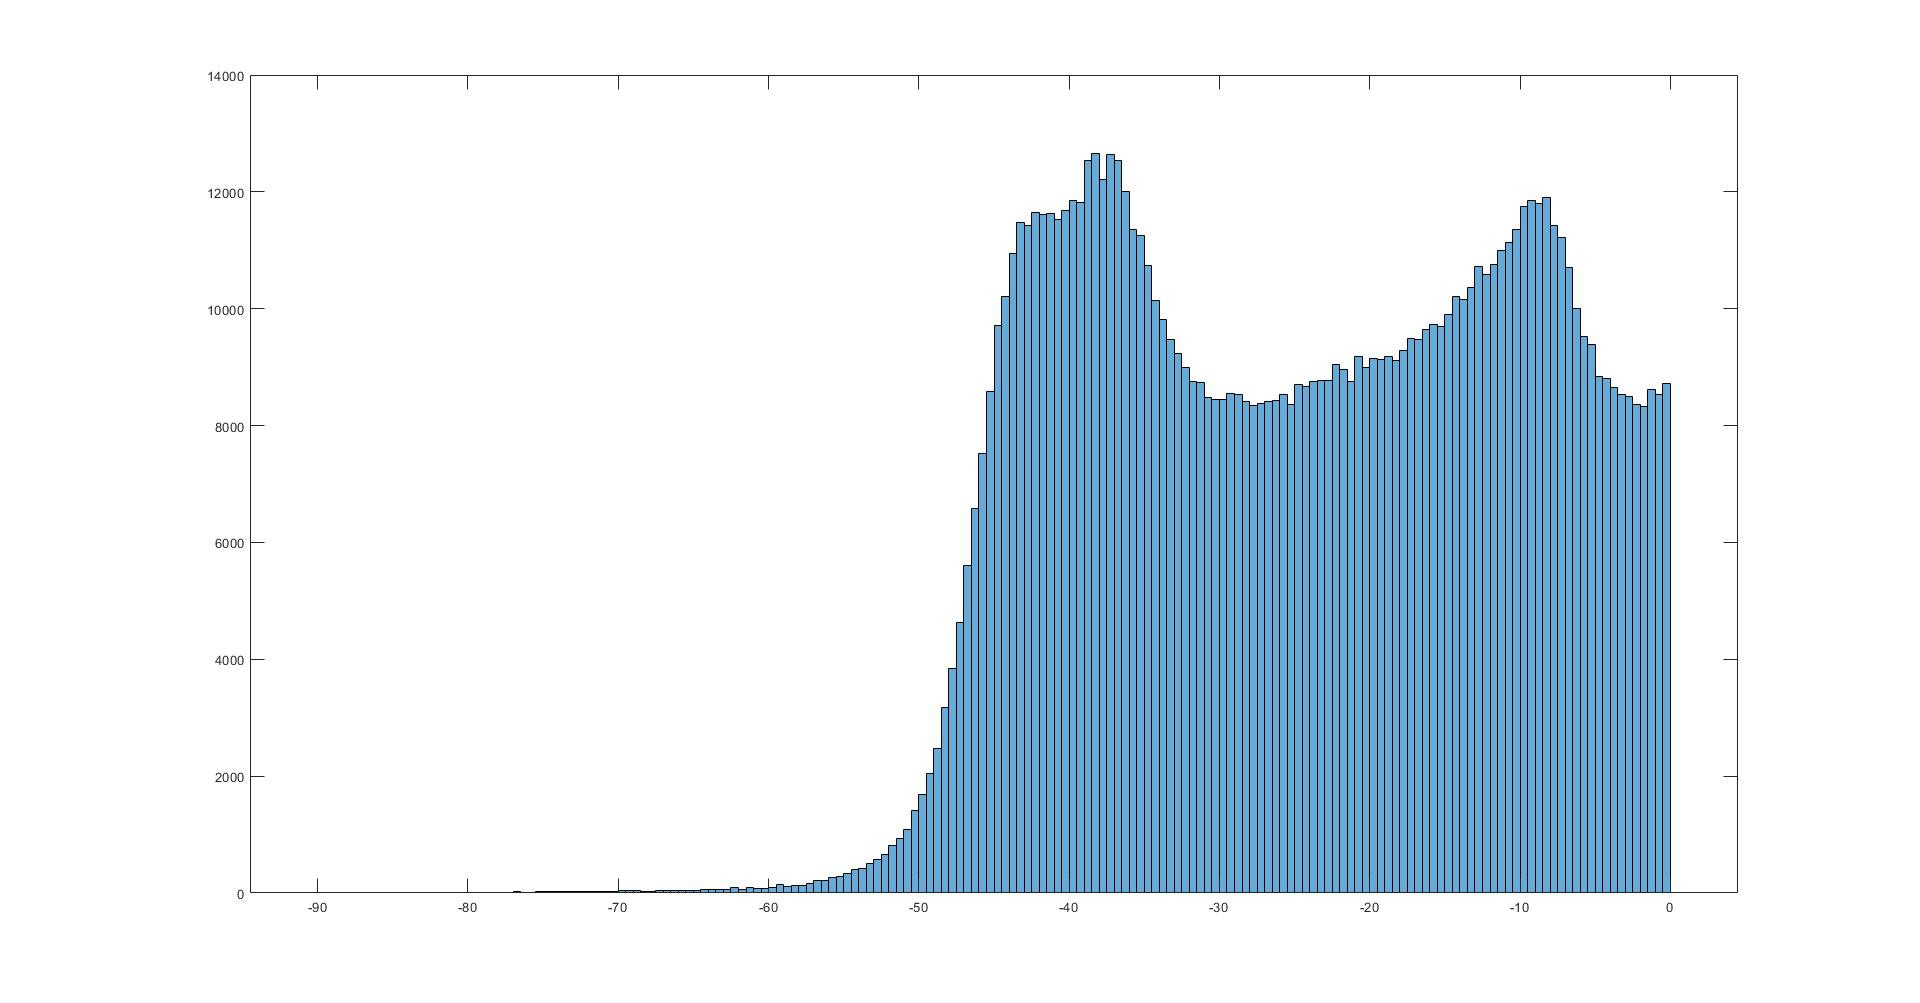
    The next histogram shows the distribution of data points as a function of depth in degrees from the horizontal. 90 degrees is vertical - straight  down. There is a bimodal distribution seen here as well.

    The next image shows a dot plot of the depth measurements. Due to the density of data points, the bimodality is harder to see in this format....

    Read more »

  • Changes detected 5 minutes before small local tremor

    Michael Doody05/18/2020 at 01:47 0 comments

    A 1.4 magnitude tremor was detected North of the Madison Valley machine today at  11:36:55  MDT.

    The USGS data can be found at:

    https://earthquake.usgs.gov/earthquakes/eventpage/mb80423319/executive

    Summary:

    Magnitude 1.4 - 34km SSW of Three Forks, Montana
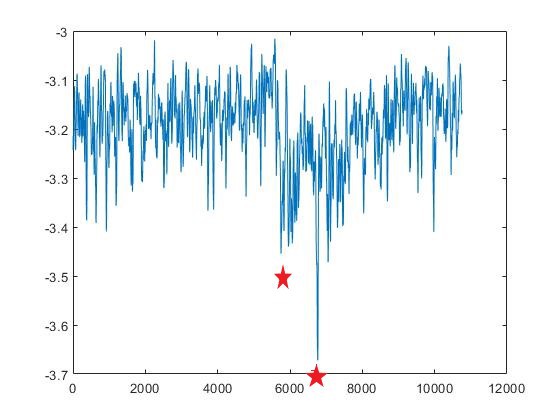
    2020-05-17 17:36:55 (UTC)   45.618°N 111.753°W   0.4 km depth   Event ID 80423319

     The following is a 10 second moving average of the combined probability data, with the first red star depicting the initial changes in probability statistic and the second start indicating the onset of the actual tremor, 336 seconds later. Data points are recorded from 11:00 to 12:00 every 333 msec in this plot.

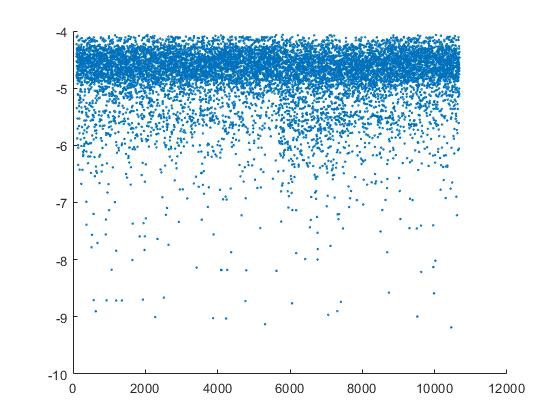
    These are the un-averaged probability data points from that time:

  • Hi Def Seismic noise and a significant local tremor.

    Michael Doody05/17/2020 at 00:56 0 comments

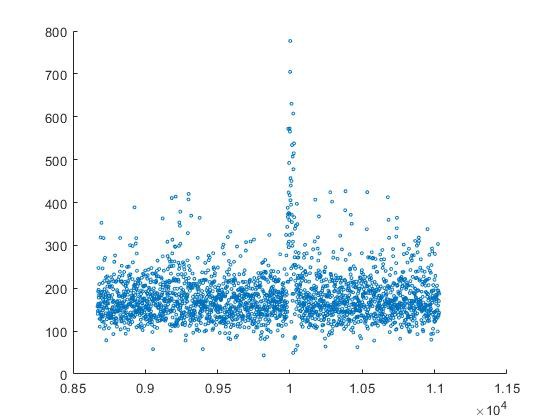
    On 5/14/2020 at 21:56:00 UTC (3:56 PM local mountain time) a 2.4 magnitude tremor occurred close to the location of the Yellowstone area machine.  The location as determined by the USGS was 44.955°N 111.710°W at 6.6 +/- 1.6 km depth. The event ID is 80422259. The USGS placed the location approximately 4 miles to the West of our device based on their remote regional seismic data but our device placed the signal axis directly to the North and South. The majority of the data collected before, after and during the event was in the linear part of the device's range.

    In the last month the device has been remotely installed with new software. This is an extensive upgrade. Timing is now from internet time servers and improvements in SD card utilization now allow data readings every 333 milliseconds. The sensors are now calibrated for baseline and individual sensitivity differences at the time of startup. 200,000 data points are now  collected at startup for the determination of the 3Dmagnitude, compass direction and depth probability arrays. The seismic noise background is now recorded in very high definition.

    This a plot of the 3D magnitude data for 13 minutes around the event.

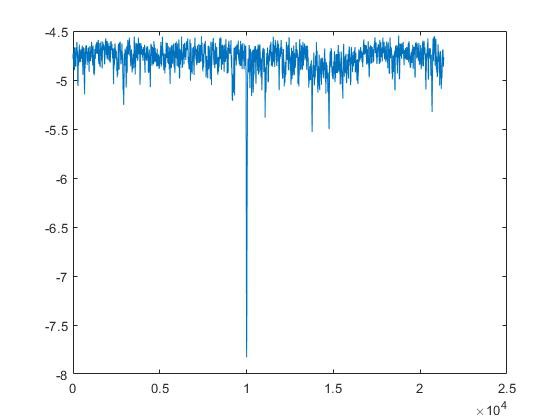
    Here is a 10 second moving average of the combined probability statistic for the two hours around the event. There are 21,372 data points in this plot. Probability is in logarithmic format.

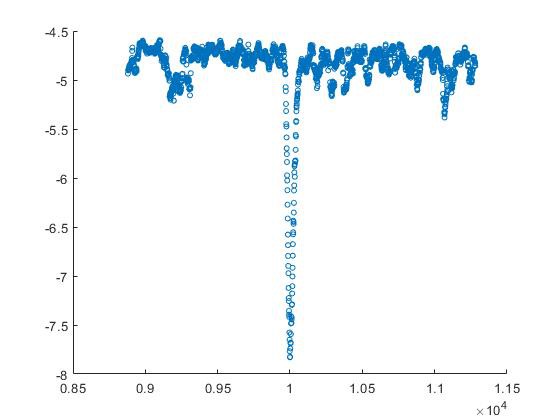
    This is a closeup scatter plot of the 10 second moving average. The  probability 'blip' prior to the main event precedes it  by approximately 4 minutes.

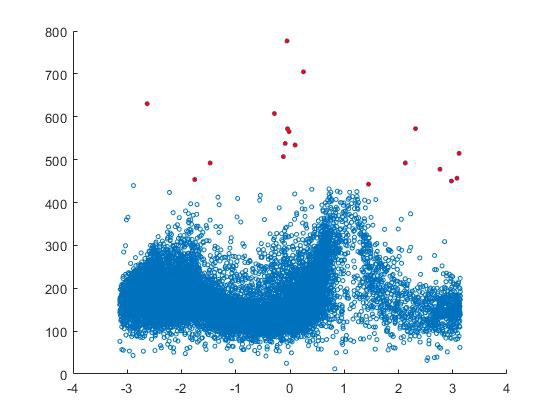
    This is a large pixel plot of compass direction vs. 3D magnitude.  Red time points are those with magnitudes greater than 450. These are clustered around -pi radians, 0 radians and +pi radians. This indicates a North/South vector axis.

    This is the promised hi def view of the local seismic noise over the 24 hours of 05/14/2020.. Compass radians (x axis, East to the left) vs. vs. depth radians (0 = horizontal, pi/2 = vertical) vs. 3Dmagnitude (millivolt units). 21,372 time points.

  • A Time Lapse of Seismic Noise Direction in The Yellowstone Region

    Michael Doody04/13/2020 at 04:51 0 comments

    Here is a time lapse video of the compass direction of the seismic noise in the Madison Valley of the Yellowstone region from March 4 to April 12 of this year. The seismic noise device was left undisturbed for the entire duration. One second time points were recorded. Noise values greater than 450 mV were excluded to eliminate the signals from the larger discrete local seismic events. The hourly files were concatenated into daily files. Matlab plots of noise direction (in +/- radians from North) vs. 3D noise magnitude were saved as 24 hour .tif files and the freeware Makeavi program was used to create a time lapse video of the 39 days. The center of Lake Yellowstone, under which the region's volcanic hot spot lies, is approximately 70 miles away and at about +2 radians relative to the device. There are clearly periods of increased activity both generally and from this direction lasting for extended times. 

  • Yellowstone Seismic Noise Is A Composite Of Many Discrete Events

    Michael Doody04/12/2020 at 02:57 0 comments

    Plots of the moving average of the seismic noise probability data seem to show that the noise comes in discrete clusters of abnormal statistics. The following plot is a 10 second moving average of the 1 second combined noise probability data points. Click or double click on the image to see more detail.

    Here is the compass direction of 24 hours of noise 3D magnitude in +/- degrees from North.  East is to the left. North is 0 degrees and South is either + or - 180 degrees.  Much of the noise originates from the West, with a strong concentration along the North/South axis. The device is roughly 70 miles Northwest of the center of Yellowstone lake.

  • Improvements to the program

    Michael Doody03/15/2020 at 15:59 0 comments

    Improvements to the startup self-calibration steps of the program have been made. This significantly improved the resolution of the device. Other major hardware improvement has been made by decreasing the second stage amplification of the charge amplifier and using a reference voltage to adjust for power supply noise. I will add details later.

    I uploaded a video of the spatial distribution of the noise - it is in the files section.

    https://cdn.hackaday.io/files/20735887126240/yellowstone%20noise%20slomo.mp4

  • "Fingerprinting" the local seismic noise in the Yellowstone area

    Michael Doody02/06/2020 at 01:53 0 comments

    The data from the last log entry was collected on Feb. 3, 2020. This log shows about 19 hours of data from today, Feb. 5, 2020. The unusual features of the last plot are highlighted again to show the similarities from day to day.

    First, the plot of the angular depth vs. combined probability statistic -

    Next, the plot of the compass direction vs. the combined probability statistic -

    Finally, the plot of 3D magnitude vs. the combined probability statistic. 

    Lots of persistence of the unique features of this noise data. Now - how to use this?

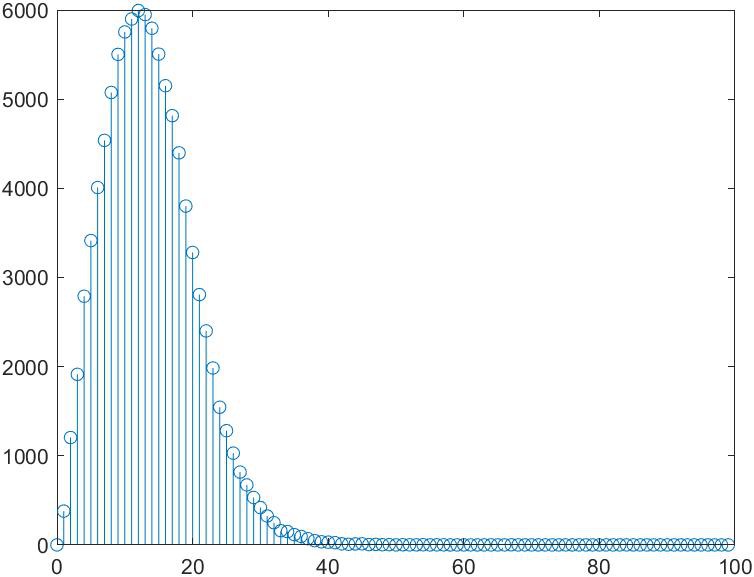
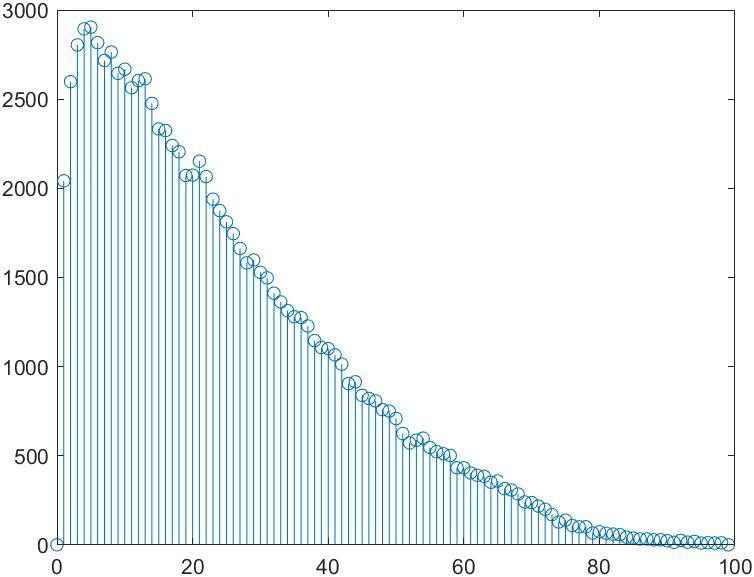
    There was a request for a graph of what the 3D magnitude and angular location probability arrays look like. The following two graphs show how 102,000 data points sort out into their 100 respective probability "bins." 

    First, the 3D magnitude probability array -

    Next, the angular location probability array -

  • Looking at the fine points

    Michael Doody02/03/2020 at 14:25 0 comments

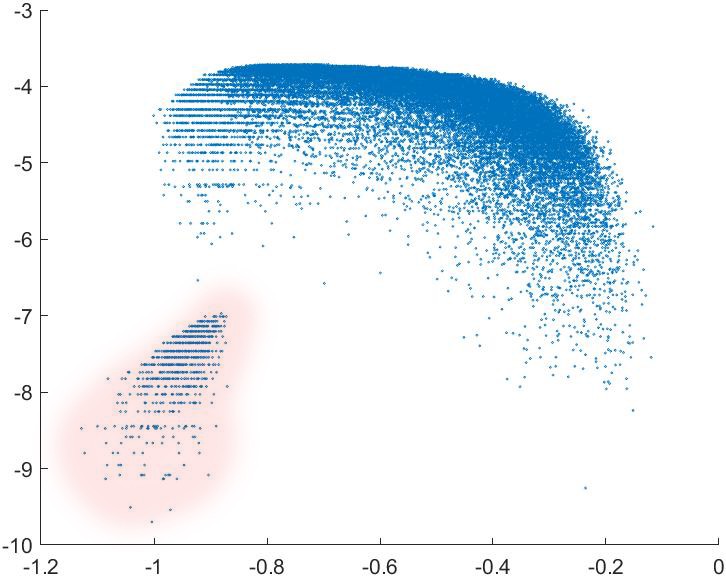
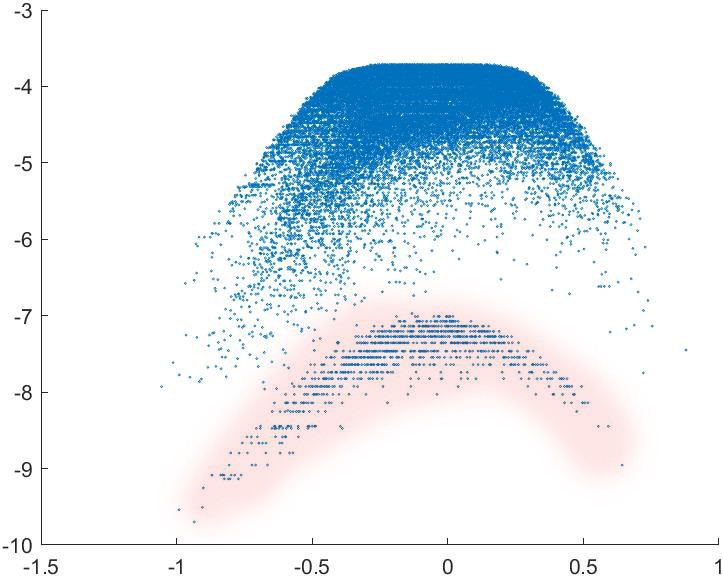
    The probability data really shows some interesting features. Again, the probability parameter of each 1 second data point is affected by the 3D magnitude, the averaged compass direction and the angular depth of that data point. It is clear that these 3 parameters are inter-related as well. The display of these individual data parameters against the probability statistic shows an interesting subpopulation of noise events. 

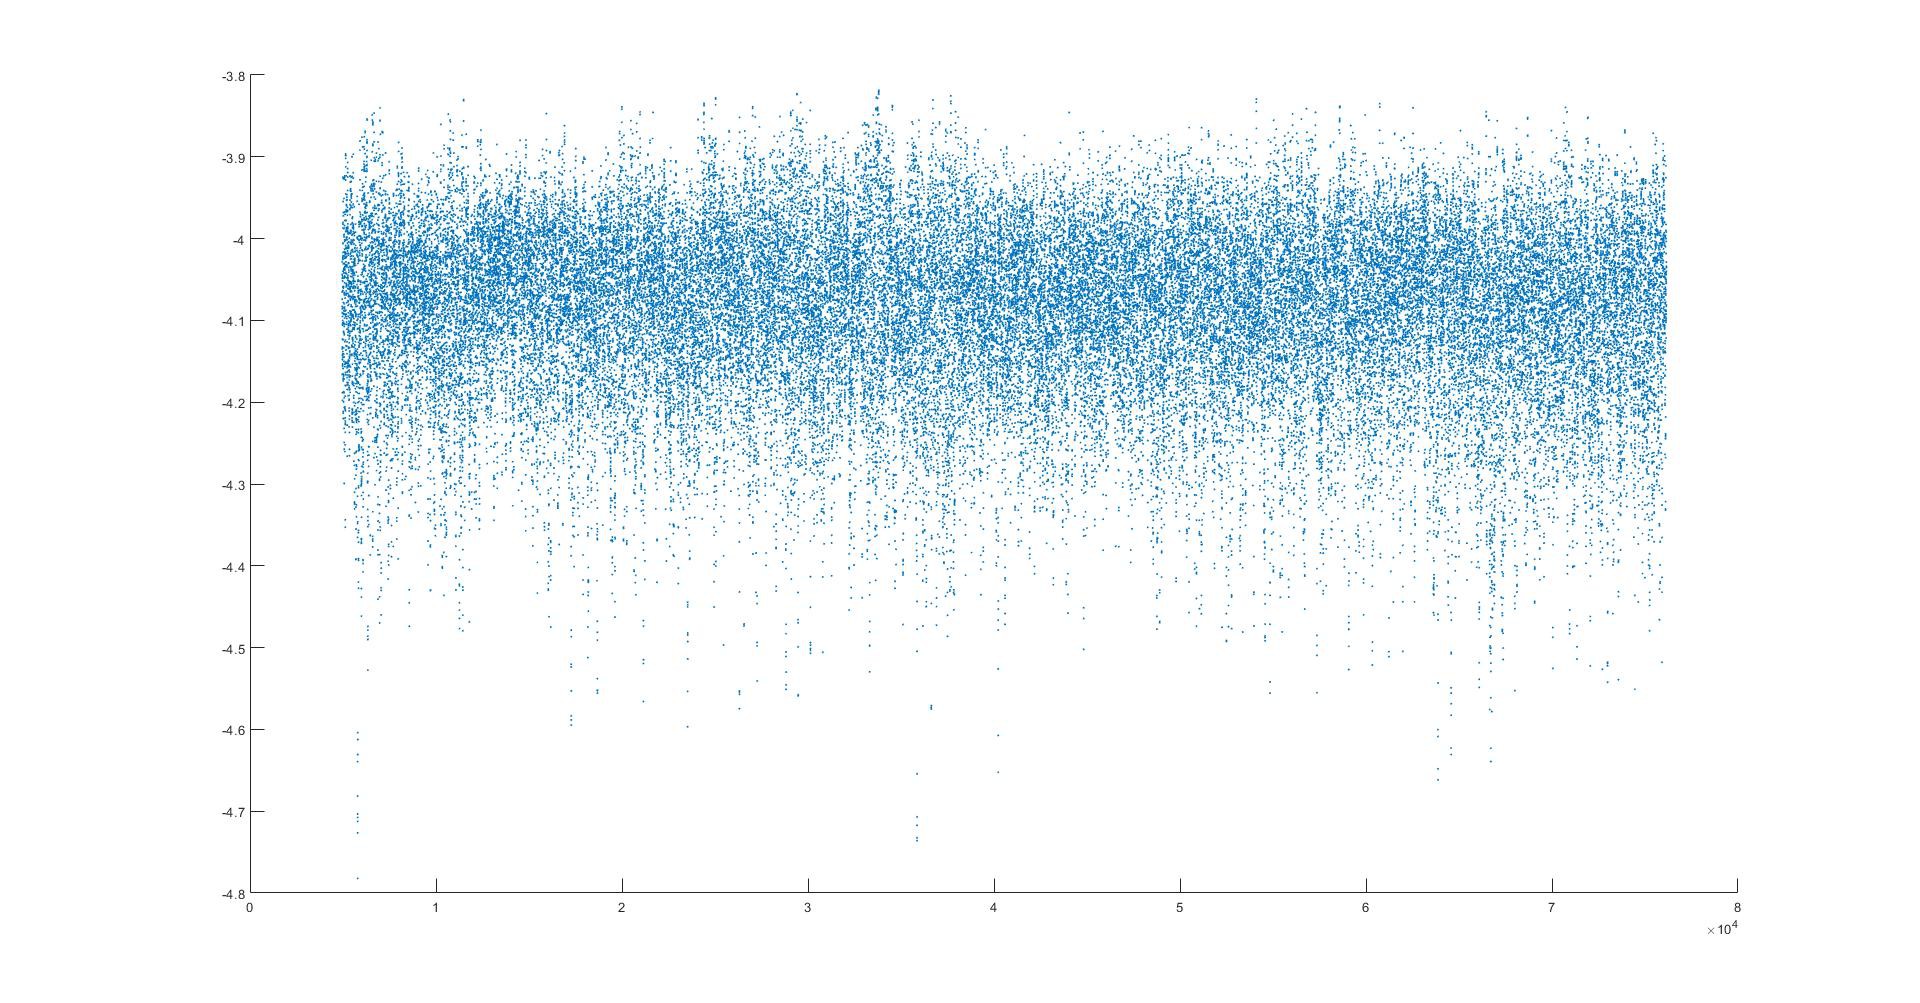
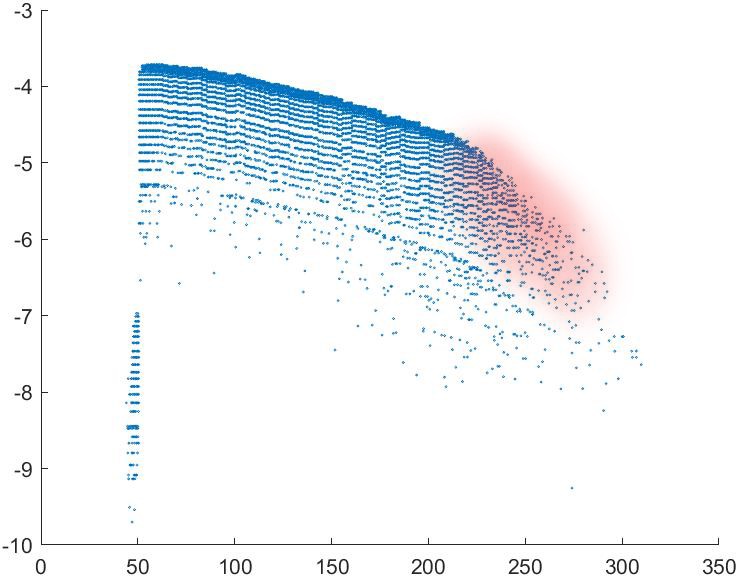
    This is a plot of angular depth (X axis) vs. probability statistic for Yellowstone data from the last 9 1/2 hours. There is a clustering of data points at around -1 radians of depth that is clearly separate from the rest of the data.

    The "steps" in the combined probability data relate to the fact that the magnitude and vector origin probabilities are stored in discrete "bins" that are not continuous.

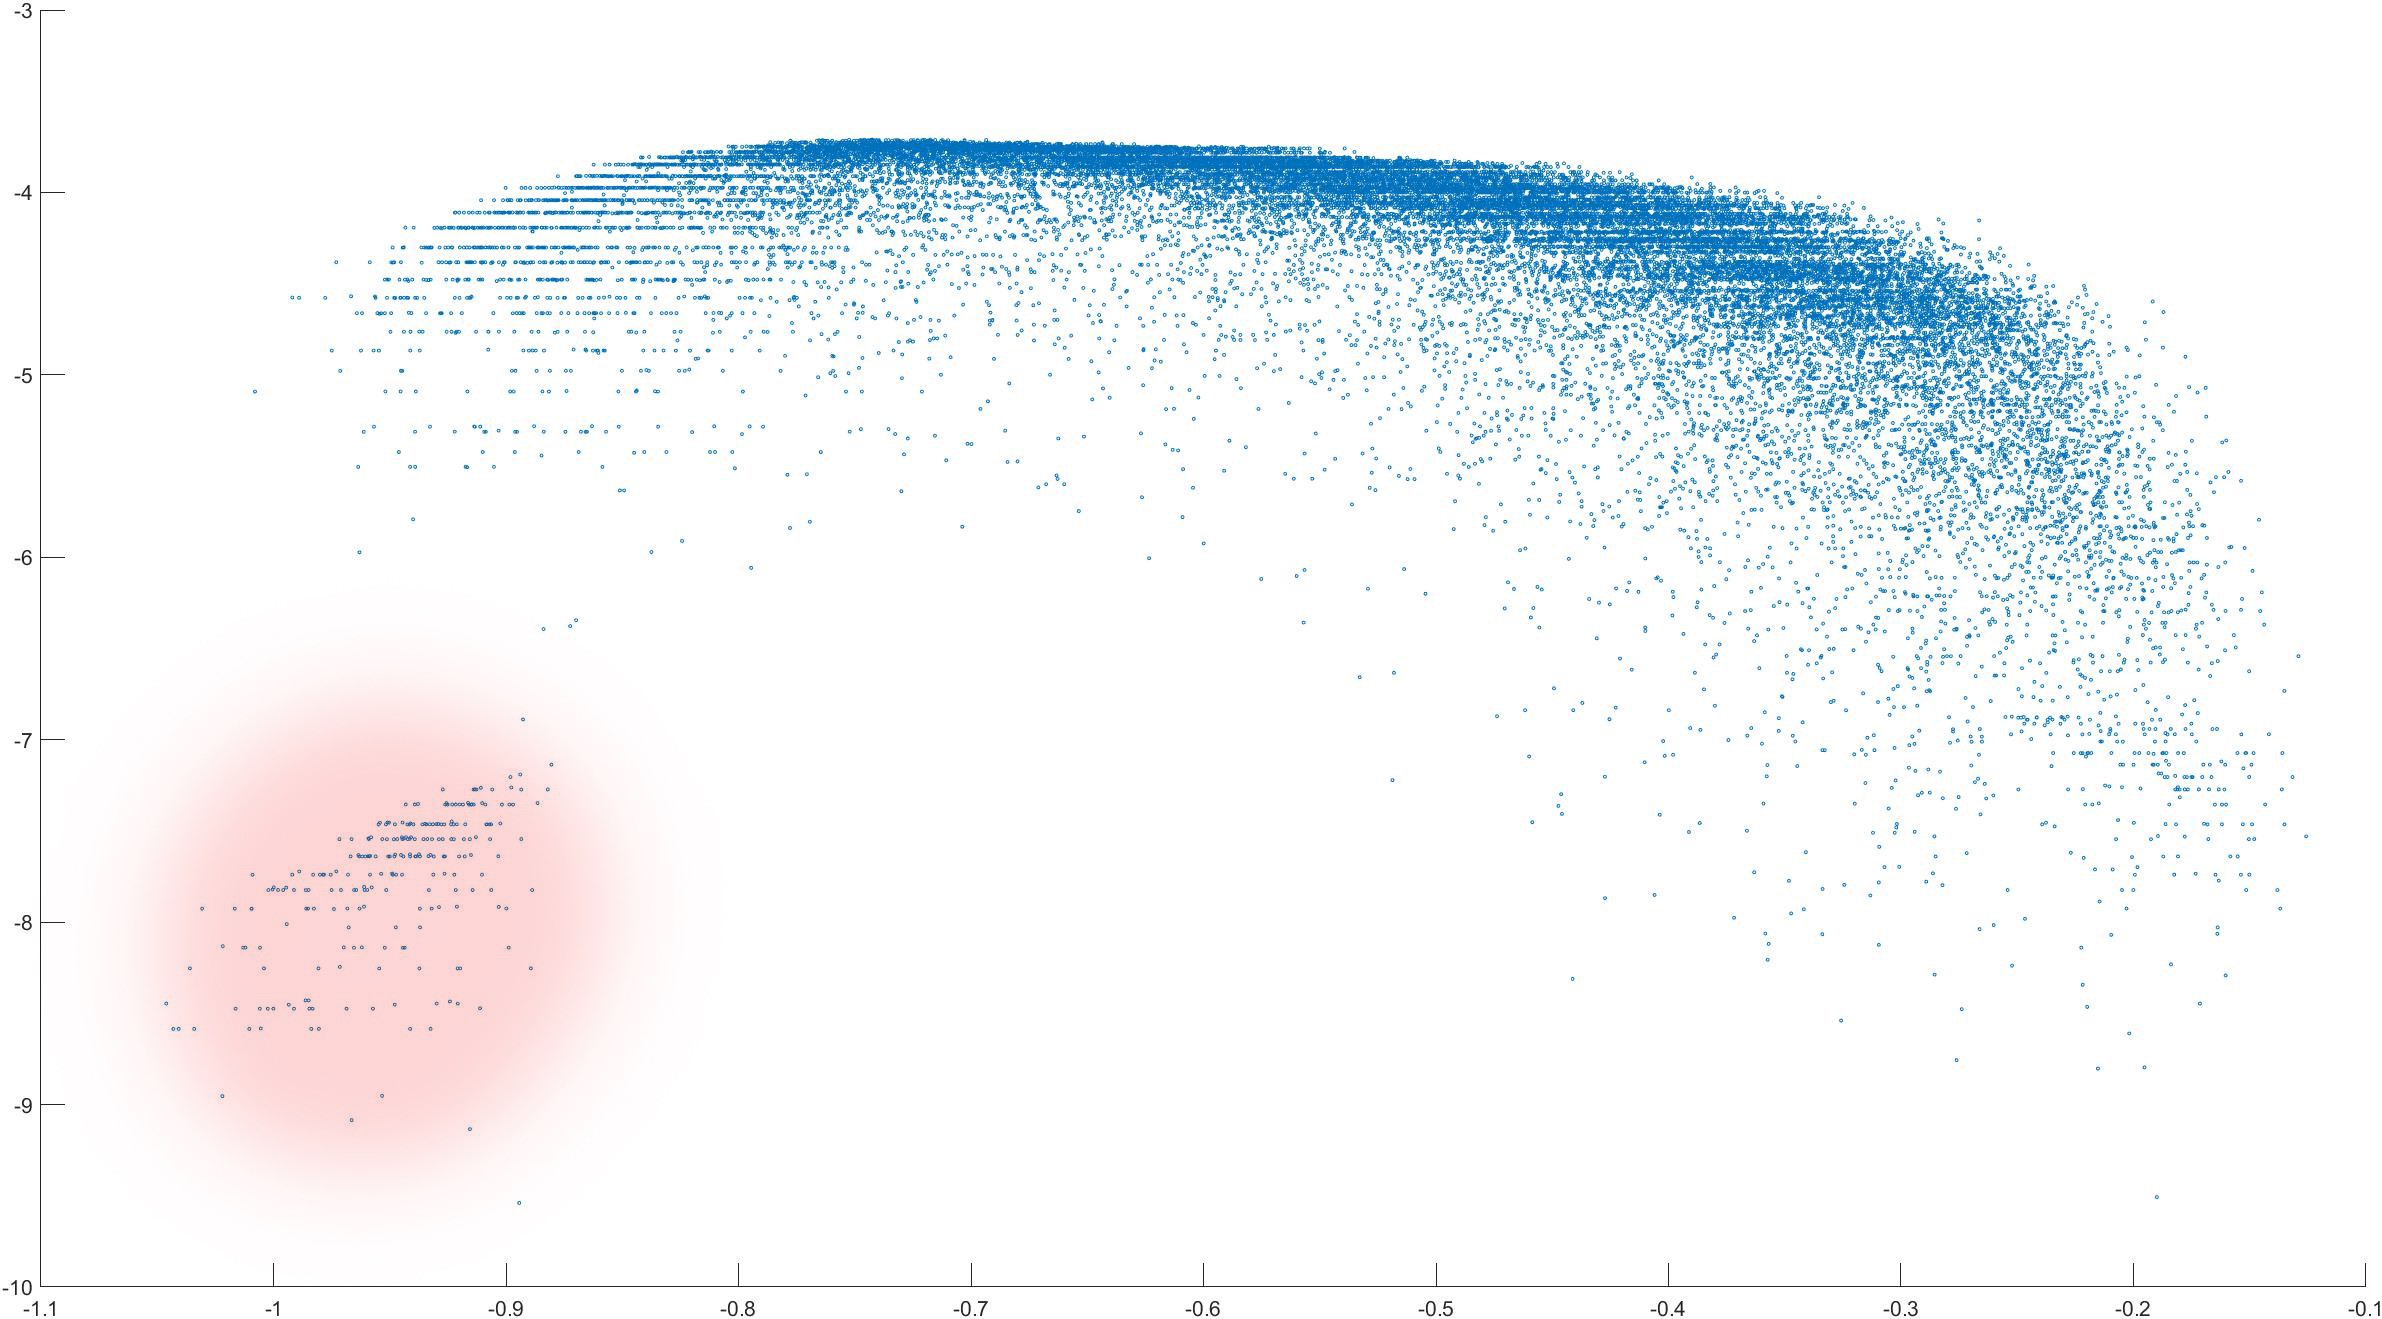
    Next is the same data set showing compass direction - another cluster of points is seen, but their compass locations do not seem to be out of the ordinary. The discrepancy must therefore be related to magnitude or angular depth.

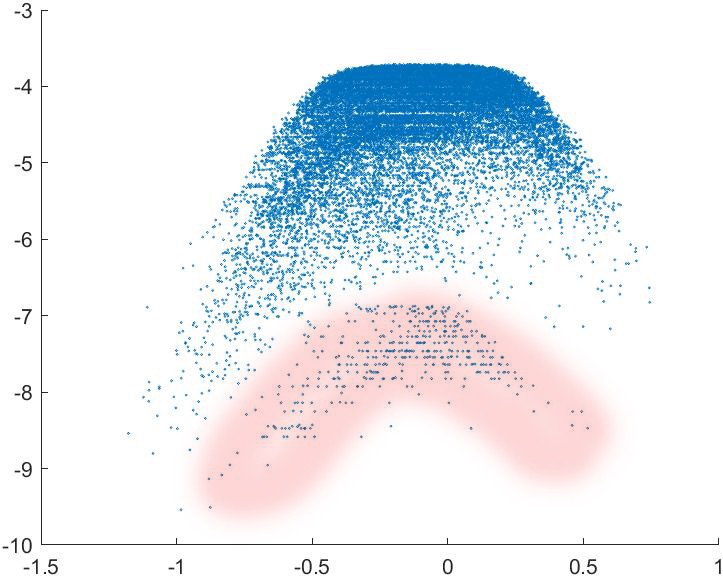
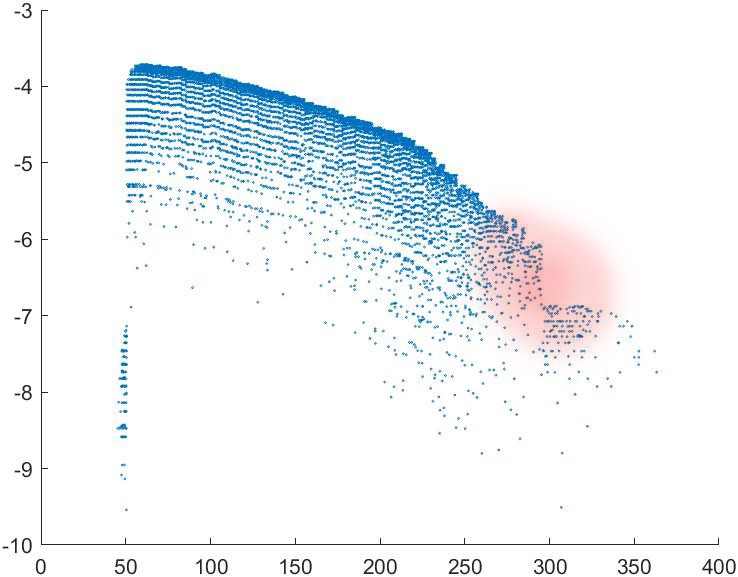
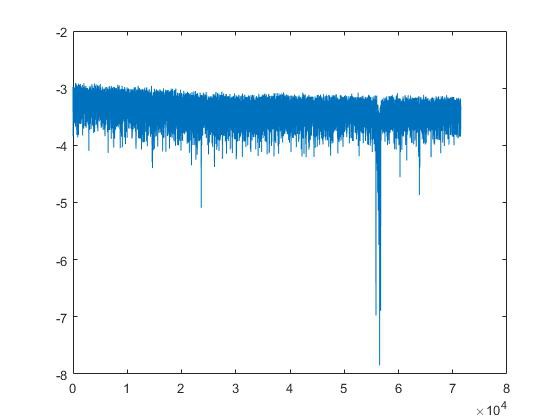
    Next is a plot of 3D magnitude vs. the overall probability statistic. There is a break in the data at the higher magnitudes. Something seems to be  "pushing down" the probabilities of points that "should have been" in the -6 to -7 range. If these are the same misplaced points as in the plot immediately above, it sounds like the data points with anomalous angular depth (from the first plot)  may explain the  discrepancies.

    What does all of this mean? More to follow as I try to figure it all out!

  • Data from the Yellowstone area - FINALLY

    Michael Doody02/02/2020 at 15:24 0 comments

    The seismic noise device placed in the Madison Valley East-Northeast from the Yellowstone caldera has been turning out reams of data. The amount of seismic noise in this area is astounding. It is 4 or 5 times as intense as the noise recorded by the same machine in East Tennessee. Much of the noise seems to be coming from the West, interestingly. The stronger noise is originating closer to the horizon and the less intense noise is deeper. Several strong local events have been recorded. The device is indoors in a climate controlled environment and it is possible that there may be data artefacts from the vibrations from the heating system. A future visit to Montana will be needed to eliminate this issue. Another source of noise may be the Madison river itself - it is about 200 yards to the East of the current location of the device.

    Here is a representative 24 hour plot of the vector magnitude data showing a local event. Full scale for vector magnitude would be about 650.

    This is the same data, expressed as a scatter plot. I believe that he small blips along the bottom of the plot may be related to the indoor heater coming on and off.

     Next is the 3D vector magnitude data expressed as a histogram. The nice Gaussian-like distribution seen in Tennessee is not seen! This data seems to reflect at least 2 independent sources of the noise.

    Here is a plot of the combined (multiplied) vector magnitude probability and 3D location probability (Y axis) of each time point during the same time interval. 10^-8 is one in 100 million. 

    Next is a plot of angular depth vs. vector magnitude over a 24 hour period. Depth is expressed in radians from the horizon. Zero is at the horizon. - Pi/2 would be straight down. Higher intensity time points tend (seem) to come from a direction near the horizon. At this point, the device is not fully calibrated and the angular depth cannot be considered to be precise. 

    The next video is the 3D plot of compass direction vs. angular depth vs. combined probability parameter for a 24 hour period. 

View all 22 project logs

  • 1
    Instructions for build

    This picture is of my "indoor" seismometer, with its electronics in an antique wooden box next to it. It is networked and completely functional, but because of its noisy indoor location, it is not useful for any serious seismology. It is never quiet, even at night, because of vibrations related to air conditioning or heating fans, dog activity, weather, etc. Things DO go bump in the night, a lot, and I have proof... The center mass is an agate sphere, in keeping with the geological aspect of this project.

    The basic device design consists of a heavy and rigid wooden base, mechanical supports for piezoelectric sensors, a spherical center mass, the sensors themselves, a high quality but very simple 3 channel charge amplifier based on an ultrasensitive Texas Instruments femtoampere op amp, a clock module, the Arduino YUN microcontroller and its program and an enclosure. Because the YUN has built in wireless networking, the data stored on its SD card can be accessed for processing externally, even remotely from the web. The "indoor" seismometer is enclosed in a glass display cloche, to minimize temperature and air current variations. "Working" seismometers are enclosed in weighted styrofoam coolers.

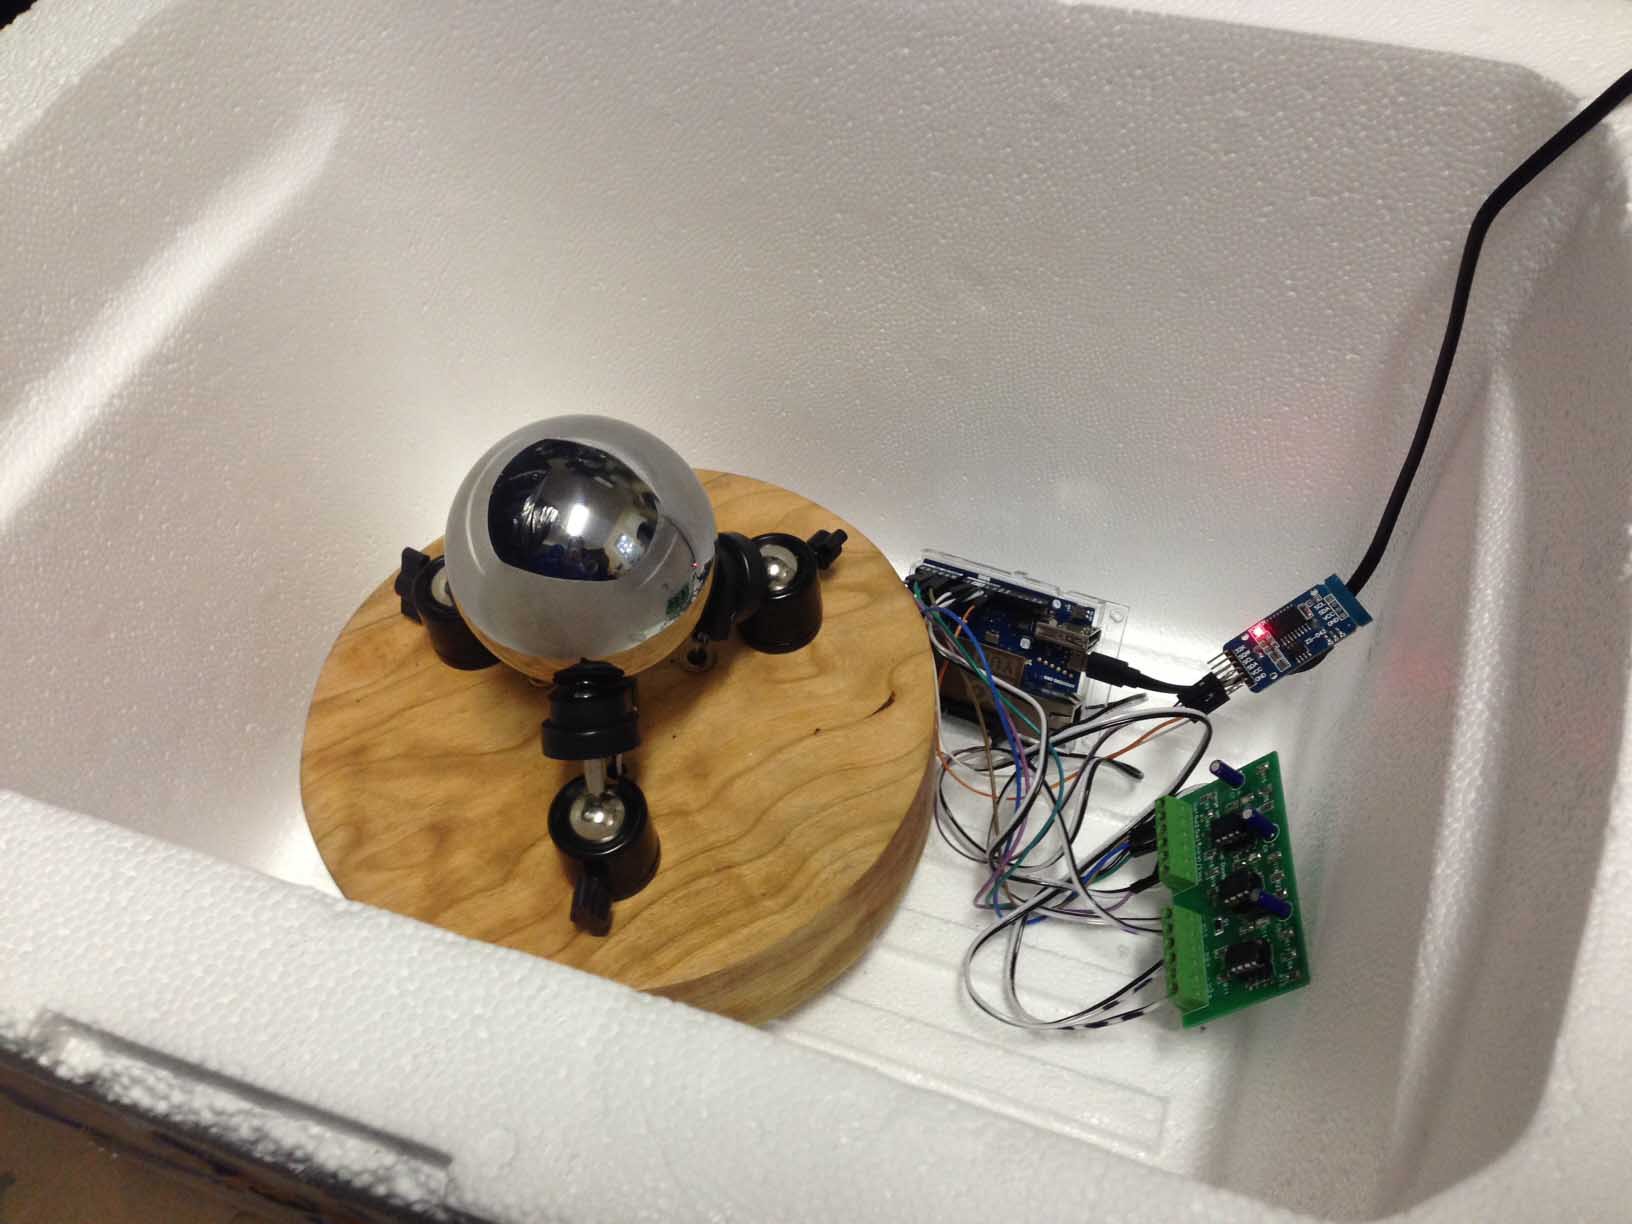
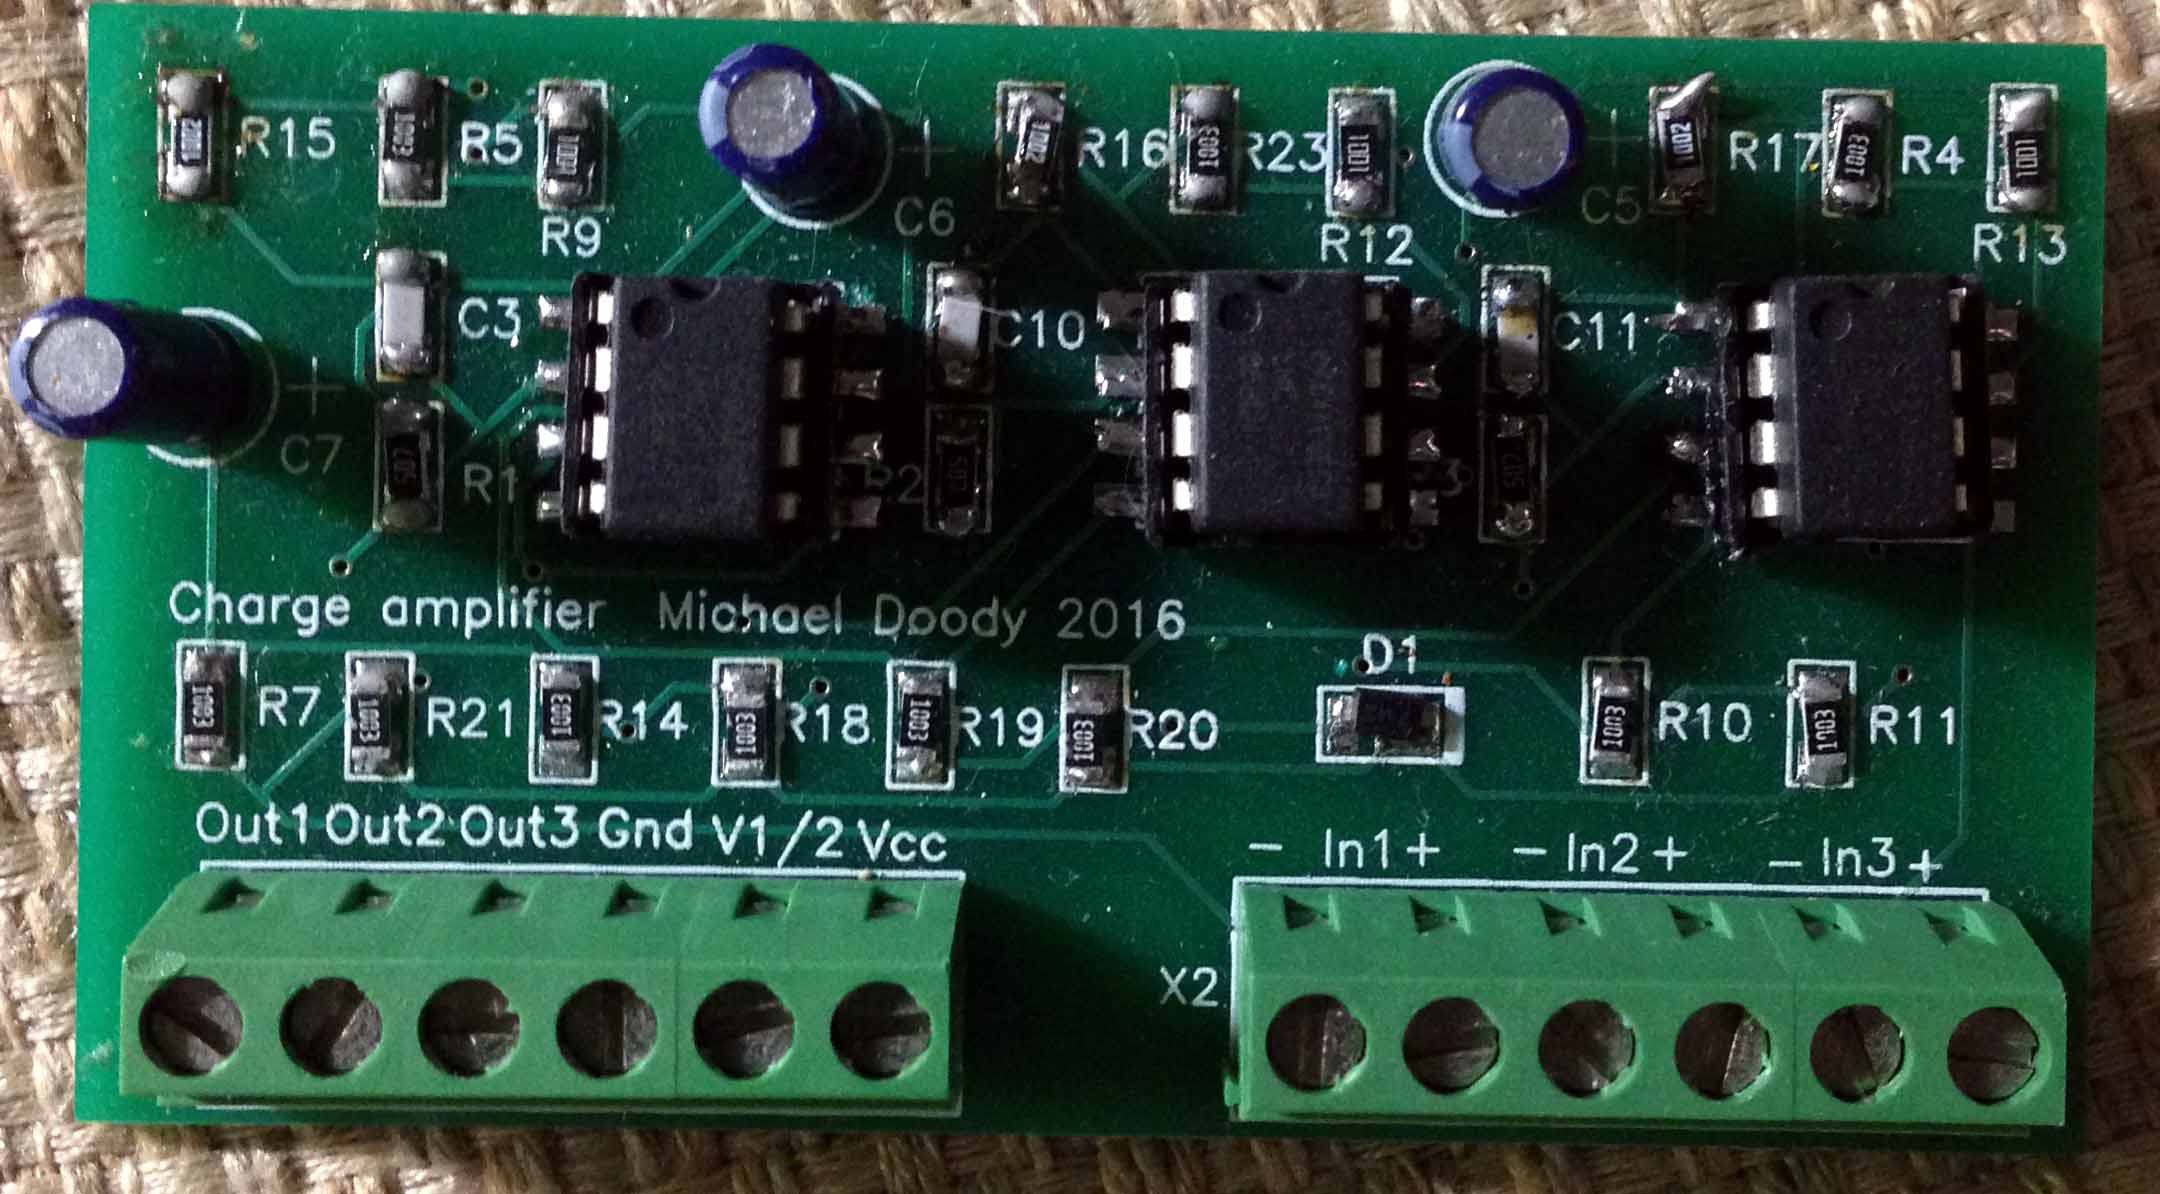
    The photograph above shows one of the devices, the Yun board (left), the clock module (middle, with the LED) and the three channel charge amplifier (right).

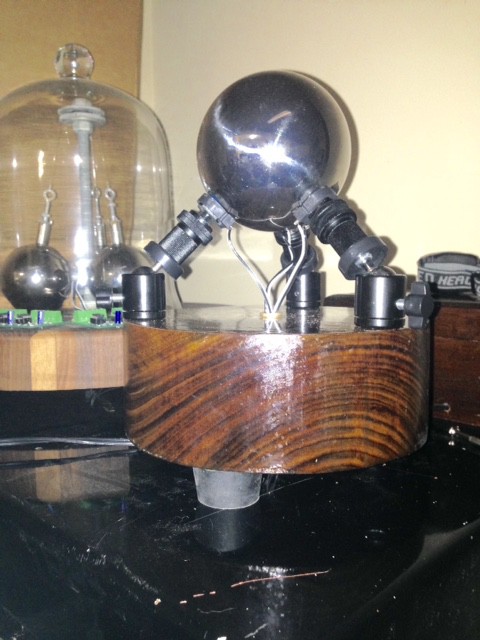
    The next photograph shows another device with a heavy 4" walnut base, a 4 pound chromium steel ball and rubber feet. The device behind it is the last version of an earlier design that used 3 steel balls suspended from a center post. It is no longer in use. The single mass design makes fewer assumptions about the vertical component of the seismic noise. It would also be much more stable in case of a strong seismic event.

    Two of the noise vector devices in their styrofoam containers rest directly on a massive 2-car garage concrete slab. The containers are weighted on top.

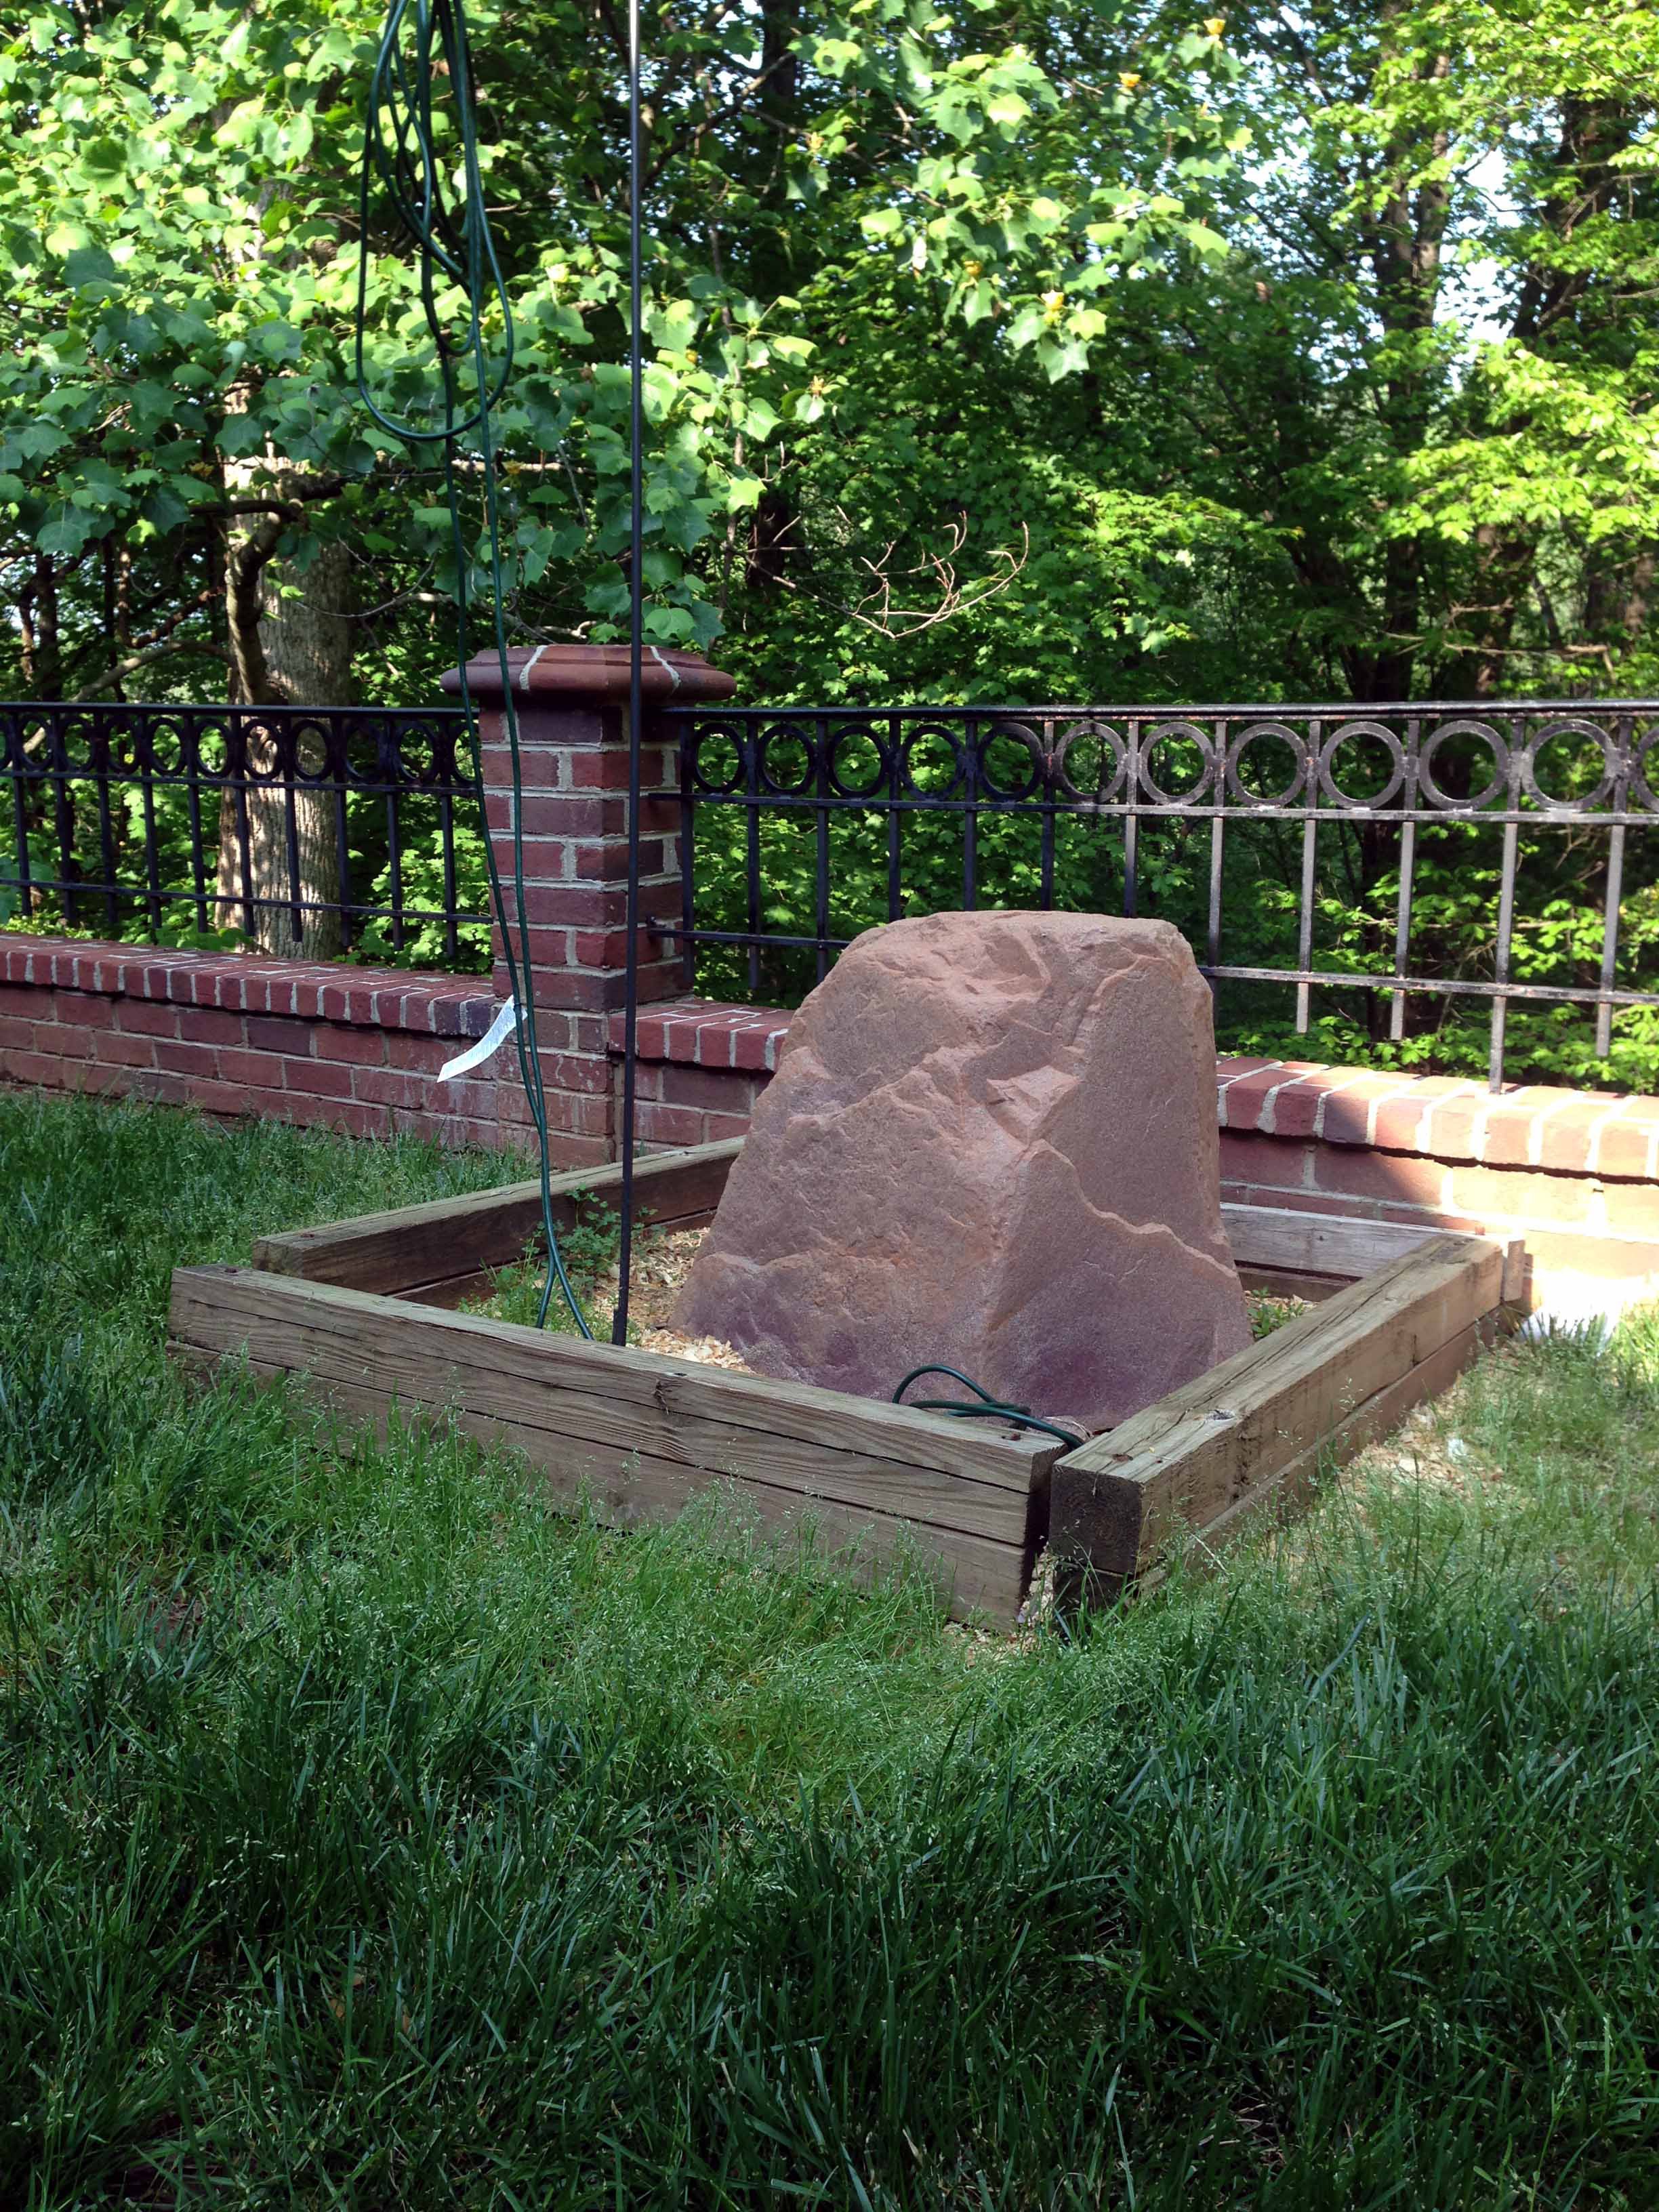
    One device is bolted through its styrofoam container to a 300 pound poured concrete base outdoors, under a weatherproof "fake rock" fiberglass housing. As with the others, it is connected to the home network through a wireless router.

    I have used several different hardwood bases - walnut, spalted maple and cherry. Different sizes and shapes are possible, but a circular base 2 inches thick and 8 inches diameter seems to work well. Beautiful pieces of wood can be purchased on Amazon - look for "bowl blank". Rubber stoppers (hardware store, usually next to the corks) work well as pedestal bases.

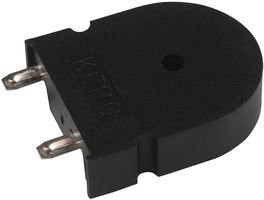
    The sensor elements are basically piezelectric buzzers in plastic cases similar to this

    http://www.ebay.com/itm/Lot-of-2-Piezo-Buzzer-70dB-2kHz-Supply-1-to-25v-Square-waves-/112066085579?hash=item1a17a8c2cb .

    The center hole of the piezo casing is drilled out to allow a hard plastic bead (JoAnn fabric store) to contact the piezo element directly.

    The sensor elements are glued directly to adjustable supports. Magnetic door stops (Lowe's, Home Depot) work well like those used for the "indoor" machine above, as do inexpensive mini tripod mounts like these on eBay.

    The adjustable supports are bolted to the wooden base by 1/4" threaded bolts (hardware store) that have been cut to size with a Dremmel tool.

    The center mass ball is supported by the 3 beads in the center holes of the sensors and the sensors are tilted at a 45 degree angle with respect to the horizontal. Beautiful minerals and rocks are easily available from multiple sources on the web as 3 inch spheres, as are chromium steel balls.

     The sensors themselves must be precisely angled and leveled - this is extremely important, as the acceleration of gravity is a very significant part of the program's vector calculations. The gravitational acceleration of the center mass must affect all three sensors equally. Smart phone apps like iLevel (for the iphone) can provide highly accurate leveling and tilting information. A bubble level or smartphone is used to level the wooden base.

    Inexpensive large scale manufacture is needed to produce a device for use in the third world. A molded plastic base incorporating all the necessary angles and distances without the need for adjustable elements would be the way to go. Glue the sensors in place, drop a lead or steel ball in and it would be done. Someone with a 3D printer could produce a prototype - anybody interested?

    Pad2Pad is a company that will custom produce circuit boards at rock bottom prices from designs produced on their own proprietary software or other professional software. 

    The circuit board plan  designed by me (in the files section of this project)  can be ordered by any interested party through Pad2Pad - contact me for further instructions if there is difficulty ordering it or Pad2Pad requires further permission from me. I have spoken with them and this should not be a problem. The design is based on ideas from a Texas Instruments white paper on piezoelectric sensor instrumentation.

    The need for soldering might be a barrier to makers interested in building these devices. I am looking into the possibility of selling the charge amplifier PCB board and all of its components on Tindie.com. It will be sold either as a kit with the DigiKey bill of materials or as a pre -assembled board.

    Newground.pcb is the Pad2Pad.com project file and it has been uploaded to the uploaded files section of this project. The Pad2Pad design program itself is free and downloadable from their website - it is needed to work with, view or modify the Newground.pcb file.


    The Pad2Pad.com BOM is also included in the uploaded files section of this project and it is also part of the Newground.pcb file. The Findchips.com web page suggested by Hackaday will not accept the BOM in the Pad2Pad format or open source Open Office format, unfortunately. I tried!

    The PCB is a surface mount design but uses fairly large (well, large for surface mount, anyway!) SMT 1206 components for the most part. Some soldering skills (or patience and willingness to learn!) are required for assembly.

    The 3 channel charge amplifier and low-pass filter electronics are based on the following simple design. Shown is one channel only, but they are identical. The TI op amp is a dual design, so only 3 relatively inexpensive op amps are needed.

    The Arduino YUN program (906 lines, including spaces and comments) is open source and it is available in the downloaded files section of this project description.

View all instructions

Enjoy this project?

Share

Discussions

yewie56 wrote 06/07/2022 at 20:43 point

Thank you for sharing!

I could not find the source code.

Is there some and where can i find it?

Thank you!

  Are you sure? yes | no

[deleted]

[this comment has been deleted]

Michael Doody wrote 03/17/2020 at 01:48 point
Actually, these devices detect quite a bit of seismic noise from far away in addition to being quite a bit more sensitive to far away seismic events than the USGS machines. My device in Montana recorded the Jamaica earthquake quite nicely and it is detecting and characterizing the directional features of the noise from the Yellowstone volcano area as we speak. 

The placement of a device underground does not guarantee that it is in contact with bedrock, by the way.

Thanks for your comments, though. It's always great to hear from someone else working on seismic measurements! What device do you use? 

  Are you sure? yes | no

RichardCollins wrote 04/06/2019 at 22:58 point

Keep up the great work!  Very interesting.  I love the use of wood and stone.

I have a project to use sensitive accelerometers to track the sun and moon.  Essentially, a seismometer or accelerometers, becomes a "gravimeter", when it is able to be continuously calibrated against the sun moon vector tidal acceleration signal at the station.  If you have been collecting data continously, I can help you to calibrate it, or show you how to do it yourself.

I started about 15 years ago, using data from the superconducting gravimeter (SG) network.  Their signal is about 95% sun moon tidal acceleration.  The remainder comes from the earth.  Then I tackled the seismometer network because I needed three axis machines so I could invert to report positions of the sun and moon (one at a time holding the other as known).

I know of about 30 technologies which have produced instruments that either detect the tidal signal, can be pushed to do so, or have to correct for it, and really ought to be measuring it.

You should probably accept Peter Walsh's offer to help upgrade the amplifiers.  If you have a nice noisy seismic environment, that will provide the variation in the output of the piezo's -- if you can get enough natural noise to drive keep the mass moving continously.  If you have a way to ping the mass randomly (in three independent directions) , so that the impulses are not correlatied, that will cause greater output in the piezos, that will be correlated with the stress, and the weight of the mass.  The greater the mass, and the greater the random driver, the stronger the signal.  Up until you break it.  I have not tried this, but I think it should work.  His ampliers might be generally useful for many projects, but it would be worth trying it on yours.  If you drive the mass randomly, or use the natural noise, you will probably have to carefully model the acoustic and vibrational modes of the mass.  That might mean using very uniform and hard spheres. But then the agate ones might damp noise internally more effectively. 

You could also just drive the piezos with another piezo. but off the frequency of the detector piezo. That would provide a modulated signal in a steady mass that would be easier to amplify than the static piezo output.  I think that is probably easier and cleaner.  I love noise, but you don't have to use random, if there is an off-the-sheld technology that can do as well or much better.  I can't build these things, but I know what I have seen and others have tried.

I looked into a tripod supporting a heavy mass, where the "feet" of the tripod rest on piezo sensors.  That should be equivalent using piezos.  If you hang a heavy mass on the tripod, the shifting weight will give a signal correlated with the local vertical gravitational acceleration, and on a finer scale with the sun moon accelerations.  You can track the position of the sphere and get a boost from two indendent measures.

If you mount opposing small but strong magnets, it should allow you to float the mass, but you would need an interferometer or noncontact atomic force sensor or other.  

To get the same sensitivity as an SG means 0.1 nanometer/secondSquared (nm/s2) measurements once per second. And high stablility, which you can get by using the sun and moon as continous references.

You mentioned you did not get early warning for the earthquake.  The networks found they can "see" the gravitational field changes from large earthquakes in the the seismometer and superconducting gravimeter records.  These changes propagate at the speed of gravity, which is identical to the speed of light.  I have been trying for over a year to get people interested in building high sensitivty, three axis, Gsps gravimeters, which are what you need to track and image such gravitational field change sources.  A giga sample per second gravimeter is recording data coming in at the speed of light|gravity.  The corresponds to about 30 cm resolution at the source.  Most of the time-of-flight methods from lightning location and imaging apply. There are many resources, if you can get the acceleration data captured and into the existing data streams. They have a funny catchword, "elastogravity".  It is actually density changes in the source voxels, generating changes in the gravitational potential, which diffuse at the speed of light (they are incoherent from natural sources), and cause changes in the gradient of the potential (accelerations) at the detector.  The potential is fundamental, not the accelerations.

Very nice.  I would carve a statue and set it on three supports.  My small statues weigh about a hundred pounds. Some of the larger ones close to 500.  Would probably have to go old school and use quartz.  I don't know if the new piezos could handle that much weight. So much to learn.

Getting too old to carve marble and limestone.  Maybe someone will help me build a hand controlled robot carving machine.  :)

Richard Collins, The Internet Foundation

  Are you sure? yes | no

senorblasto wrote 02/02/2020 at 19:22 point

Thank you for sharing your knowledge and experience. 

  Are you sure? yes | no

mr.jb wrote 06/29/2017 at 08:44 point

Hi,

I'm researching for a similar project with a MiniSense 100

I have tried to understand your first stage  : "it really responds to the derivative of the squeeze,"

I'm interested why you put the 500 Mohm at that particular spot.

( guess it's a filter as described  from  Charge amplifier 3.2 )
http://www.ti.com/lit/an/sloa033a/sloa033a.pdf

FL = 1/(2*pi*500E6*22E-12) = 14.5Hz   ( start of passband !? ...guess it's FH )

Low pass filter at end of handwritten figure :
F = 1/(2*pi*1E3*10E-6)= 15.9Hz

hmm looks like  FL,FH is swapped in Texas instruments pdf

http://metrology.hut.fi/courses/s108-180/Luento3/varvah.pdf

Since you probably has 14.5Hz  as FH, what about FL ?

A big input resistor missing ??

--------------

My plan before seeing your project,   using 250 Mohm in parallel at the input stage, described here....  ( just another way to achieve same type of filter ? )

http://www.scienceprog.com/thoughts-on-interfacing-piezo-vibration-sensor/

What is your opinion about sensitivity ( noise problems ) compared to a geophone ?
http://www.experiencingphysics.com/?p=87

Any suggestions about overvoltage protection ( that does not interfere with the circuit ) ?

zener or schottky  ?

Did you connect the piezo to the voltage divider ( x2 - 10k ohm ) to achieve vcc/2  ( any problems with such low resistance !?)

/JB

  Are you sure? yes | no

Tillo wrote 06/29/2017 at 06:39 point

Congrats on that sleek look, it already looks like a object to put somewere in the living room. It's actually well too beautiful designed to be a hackaday project ;).

  Are you sure? yes | no

David H Haffner Sr wrote 06/26/2017 at 20:31 point

I see UR are on the "feature" page...This project deserves it :)

  Are you sure? yes | no

Tindie wrote 06/23/2017 at 00:27 point

Congratulations on being one of the Internet of Useful Things Hackaday Prize Finalists!

  Are you sure? yes | no

Peter Walsh wrote 05/07/2017 at 00:10 point

1) That "not a gaussian" curve looks suspiciously like a Levy distribution. It's one of the three known stable distributions (others being Gaussian and Cauchy). It's what you get when the variation is proportional to the offset from the mean, and comes up occasionally IRL for things such as annual flooding and geomagnetic reversals.

http://www.gummy-stuff.org/Levy.htm

2) I don't know what amplification you're actually getting, but a quick back-of-the-envelope estimate guessing the parameters of the piezoelectric sensor indicates that the output of your amplifier is 1,000x the input signal.

I have a project with a charge amplifier circuit that I've been working on for awhile, and I'm getting a factor of 1,000,000x the input signal, which are 3MHz pulses. (Measuring individual alpha particles.) I'm accurately measuring 6uV pulses that are 1/3uS long, which is about 3x the noise floor.

If you think higher amplification would benefit your project and want to compare notes or try a different circuit, send me a PM.

3) Kickass project, looking forward to future posts.

  Are you sure? yes | no

Michael Doody wrote 05/09/2017 at 00:48 point
Peter - 

Thanks for the comments.

Your project page looks really interesting. I would really like to look at your charge amplifier circuit out of sheer curiosity about what it looks like. Sounds like you have a great project there too. You are looking at transient pulses whereas I am looking at ultra-slow seismic waves affecting the behavior of piezo crystals, so we are optimizing for different things.

The amplification in this piezo charge amplifier first stage is somewhat difficult to define because of the huge but necessary (500 megaOhm) resistor, the ultra-low femtoampere leakage current of the TI op amp inverting input, the high resistance of the piezo crystal and the very nature of "charge " vs. "voltage". 

This is not at all a perfect analogy, but you can think of a piezo crystal as a sponge - you squeeze it and electrons get squeezed out - when you un-squeeze it they go back in. Unlike a sponge, though, if you stop squeezing the electrons go back in too, even if you haven't un-squeezed it yet. Therefore, it really responds to the derivative of the squeeze, so to speak. The electrons go "out" of the sponge/crystal in a charge amplifier circuit but not "around the block" as in a typical circuit. The charge amplifier first stage is then followed by a classic 10X voltage amplifying second stage. The second stage could be arbitrarily high, but 10X is just fine for our data collection purposes and it keeps the electronic noise down to a minimum.

To summarize, the first stage charge amplifier is very sensitive to the static electric field produced by the piezo element's charge output and the second stage amp gives us tens of millivolts of output in response to the acceleration of the center mass caused by the seismic noise. 

Mike

  Are you sure? yes | no

David H Haffner Sr wrote 04/29/2017 at 22:17 point

This is another fantastic project here, and I truly wish you luck on this, what a breakthrough it would be!

  Are you sure? yes | no

Thomas wrote 04/28/2017 at 18:39 point

Did you try using ordinary TL072 for the charge amplifiers? The bias current is a bit higher, but I don't expect the offset to be higher than 0.5V (which can be canceled out with a floating average). 

  Are you sure? yes | no

Michael Doody wrote 04/29/2017 at 01:49 point

The original design used TL082 op amps - it  "worked", but was not nearly as sensitive. The standard deviation of the noise increased significantly when we swapped the op amps (that's a good thing).  The idea for the change came out of a Hackaday discussion (!). This project depends on resolving the noise into the widest possible noise distribution. The wider it is, the more the program can detect subtle changes in what is happening down there!!

  Are you sure? yes | no

Thomas wrote 04/29/2017 at 03:01 point

Thanks, now it's clear :-)

  Are you sure? yes | no

Andrew Bolin wrote 03/31/2017 at 02:14 point

Great write-up, I'm interested to see how your results come out!

  Are you sure? yes | no

Similar Projects

Does this project spark your interest?

Become a member to follow this project and never miss any updates