 Taylor Wass
Tl;dr
- C4D detector system design document
- Review of state-of-the-art in C4D detection
- Our improvements upon current designs
As ions are brought into the capillary tube by the separation voltage, they move as distinct bands. The detector system lets the C4Derpillar ‘see’ and measure these bands, enabling us to identify and measure dissolved chemicals. This post aims to serve as a system design document for the C4E detector and show the engineering process taken to achieve our prototype design. For information regarding the physical phenomena behind C4D, please look at Project Log: Conductivity Detection C4D.
Functional units of the detector
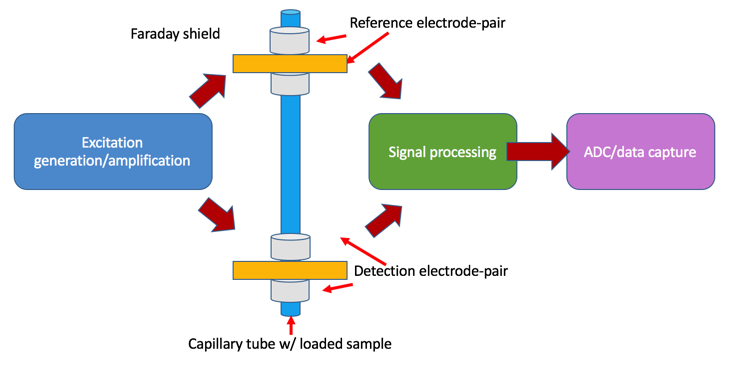
A sine wave excitation signal is generated by the function generator and amplified to several hundred volts. From here the signal travels through the detection cell and is combined with the signal from the reference cell, positioned such that it is only ever measuring the conductivity of the separation buffer. The phase cancelled signal is rectified and attenuated for detection by an ADC and subsequent data processing. A typical C4D detector can be divided into several functional units, which are explained in detail below:
Excitation signal generator
The transmission signal is a vital component of our detection circuitry as the working parameters allow for calibration of the platform for optimal detection sensitivity (Signal-Noise Ratio - SNR). C4D detection operates with an AC sine wave signal at a minimum of tens of kHz to ~10MHz. This is because the signal must be at a sufficient frequency to overcome the minimum working frequency of the system but also within a range to avoid the excitation and detection electrodes becoming coupled so that the sample no longer affects the conductivity reading. As the excitation frequency of the system is increased, heightened sensitivity is typically observed until a point where stray capacitance becomes an issue.
In the literature a wide variety of excitation signals are used, ranging from 1-200Vp-p at frequencies spanning 20kHz to 10MHz. The research group of Peter Hauser has pioneered using a high voltage source (up to 350V) at a relatively high frequency (200kHz), which was found to offer unique advantages for enhancing the signal-noise ratio (Kuban, et. al, 2006). This is presumably due to the large amplitude of the signal masking any small fluctuations introduced by the environment. Based on his group’s research, we have selected componentry that will be capable of generating a 1kHz-10MHz sine wave at ~16-240Vp-p.
As the SNR depends heavily upon the excitation frequency and voltage, being able to dynamically optimise these parameters is desirable. Second generation devices, featured the ability to adjust the operating frequency and voltage of the system, however the user is still required to reflow passive SMD components on the circuit board and perform electrical calculations; a hurdle that would prevent novices from achieving this end.
In our design, signal is generated by an Analogue Devices AD9833 SPI function generator, which produces a sine, square or triangle 0.6Vp-p signal from 0.1Hz–12.5MHz with 0.1Hz resolution. A two-stage op-amp system is used to amplify the excitation signal from 0.5–15Vp-p. This is achieved by using a fixed 20x multiplier op-amp in tandem with a selectable (0.1 – 1.5x) attenuating op-amp, controlled by an Analogue Devices AD5280 I2C digital potentiometer with 256 wiper steps. This staged gain system was required in order to keep us within the gain-bandwidth product specifications of the Analogue AD829 and AD818 op-amps. In this design the pre-transformer signal is limited to 15Vp-p, which is the digital pot terminal voltage maximum working parameter. There are chips on the market with higher terminal voltages but for the moment 15V is right where we want to be, giving us a final working voltage range of ~16–240Vp-p when used in conjunction with our Coilcraft 1:16 wideband RF transformer.
Being able to adjust the excitation parameters on-the-fly is a significant advance from current designs because it lets the system do things like auto-calibrate for maximum sensitivity. This is a vital feature if we want to ensure reproducibility of results across devices, as the optimal excitation voltage and frequency will be unique to each system due to variation in the construction process and detector geometry. This improvement is in line with our design principles in that we want to make the device accessible to as many non-technical users as possible while at the same time providing a highly informative analysis.
Apart from making the device easier to use, we want to push the capabilities of our system to the limit and explore interesting things like sweeping the excitation frequency, which we think could provide a novel and simple way of separating superimposed detector peaks.
A further limiting factor in existing detector designs was the use of the N87 transformer core, with core permeability from 25kHz to 500kHz [datasheet]. This means that designs using the N87 core are incapable of exceeding this limit as the excitation signal cannot be transmitted. The transformer we are using has a bandwidth from 0.1-90MHz. This is perfect for our system as the minimum working frequency is CE-C4D systems is usually ~20kHz and the range limit of the excitation signal frequency is from 10kHz-5MHz before capacitive coupling is an issue. If you want to read more about optimising the excitation signal, a wealth of information can be found in the PhD thesis of Pavel Kuban [open access link].
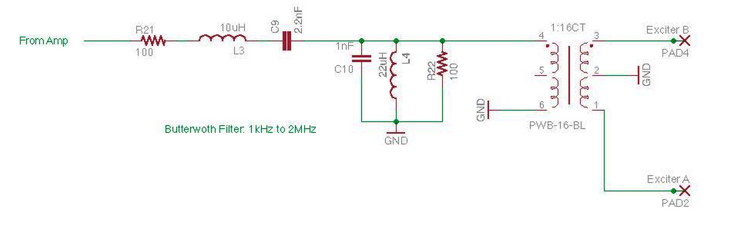
The schematic for the exciter module can be found below:
Excitation signal generation/amplification:

Wideband RF transformer, producing two out-of-phase signals for the detection and reference cells:
Electrode configuration
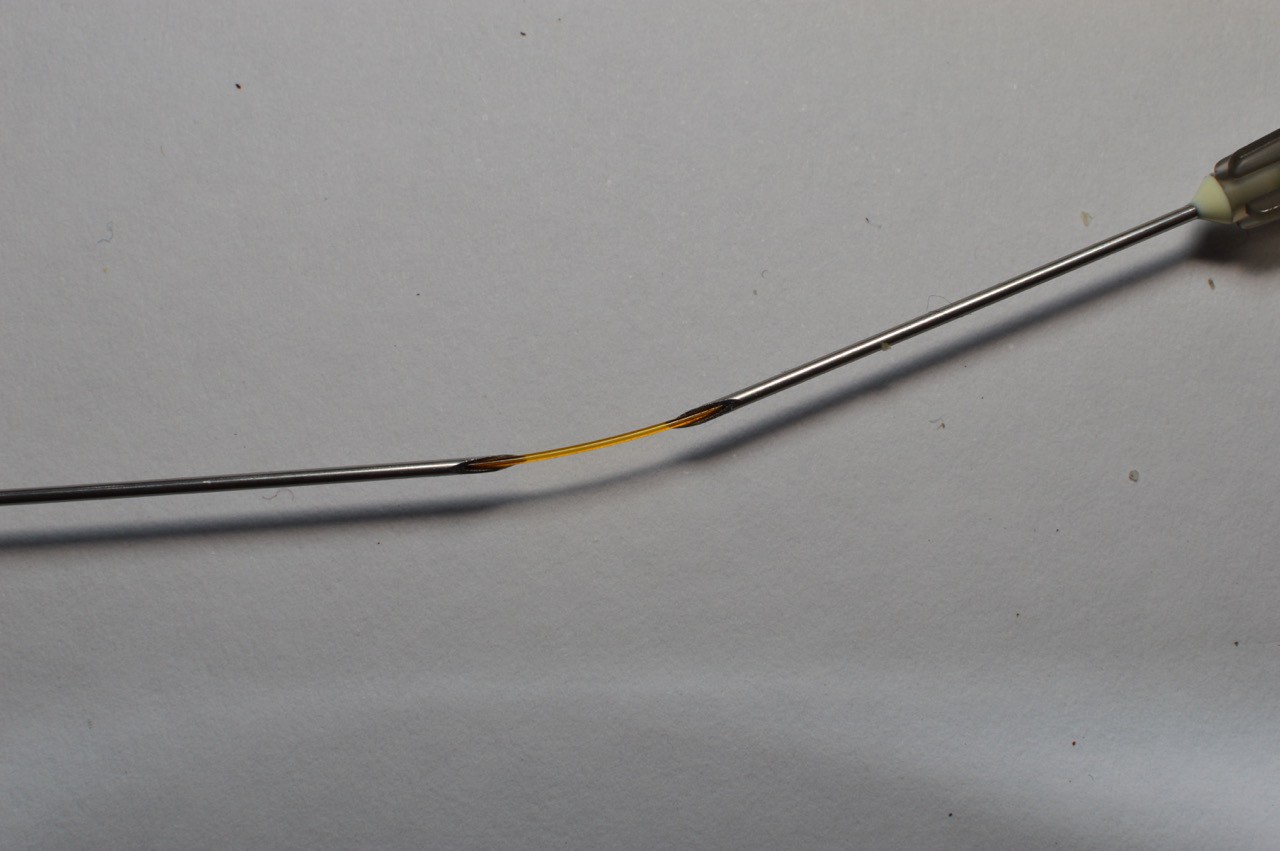
Traditional C4D detection cells consist of a fabricated single electrode pair, featuring a working electrode and a detector separated by a Faraday shield to prevent direct coupling between the electrodes. This design presented many advantages over traditional contact-based conductivity detection methods. Development of this concept was continued by Zemann, et. al (1998), who used low-cost stainless steel syringes sleeving the capillary (shown below). This design gave a cheap and simple detector that has the unique capability of being mobile along the capillary; letting users alter the effective separation length and adjust the time it takes for a run to complete. Sometimes users will only want to detect one or two ions, requiring only a small run length in the capillary to achieve effective separation. Reducing the run length significantly speeds up the analysis time by trading it for resolution, giving users the freedom to customise the device to suit their application.
Example of the electrode configuration of Zemann, et. al. (1998). The 375μm OD capillary is sleeved with a 400μm ID stainless steel syringe.
One disadvantage of using a single detection cell is that any signal processing requires the introduction of an offset to account for the conductivity of the separation buffer. As the temperature and buffer composition can change through the course of an experiment, dynamically accounting for this value becomes difficult, introducing random error over the run.
This issue was solved with the introduction of the Hauser group’s referenced C4D detector (Stojkovic, Schlensky and Hauser, 2013). The design features a second electrode pair which is situated so that it is exclusively measuring the conductivity of the separation buffer. The signal from this detector is combined with the one from the working electrode pair such that the separation buffer signal is removed by phase cancellation. Our Coilcraft transformer allows easy production of a 180 degree out-of-phase signal through a third tap. By providing this ‘reference’, it is possible to negate using a signal offset while at the same time dynamically account for intra-experimental environmental variation.
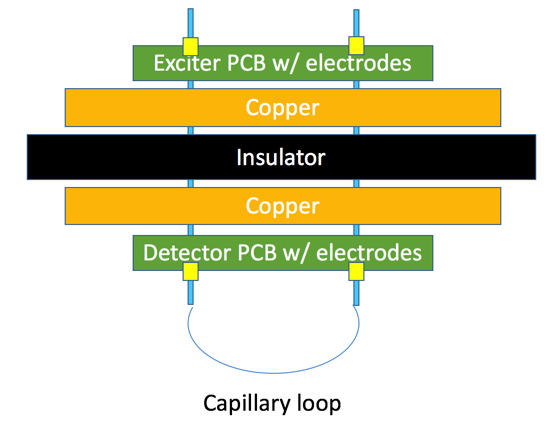
In order to have one cell constantly monitoring BGE, a design is used where the capillary loops through a ‘PCB sandwich’, which features the detector circuitry and layers of insulated copper clad that serve as the Faraday shield between PCB-mounted electrodes. Each layer of copper will be grounded to the detector box, serving to funnel stray capacitance away from the detection electrodes.
Signal processing
The phase-cancelled signal is then amplified by a pickup amplifier in the I to V configuration (transimpedance) and passed to an AD630 synchronous demodulator, also known as a lock-in amplifier. Early designs would instead feature a rectification step; however, this is not considered optimal as the lack of bandwidth restriction in the amplified signal increases electronic shot noise, decreasing the sensitivity of our reading.
One bandwidth reduction strategy explored in the literature was that of Kang, et. al (2008), which featured a piezoelectric resonator selectively allowing reception of the excitation signal. This was found to reduce noise in the system. While the researchers did get improved resolution, it was difficult to implement this system in line with our design principles, as users would find it difficult to adjust the excitation frequency. Fortunately, we can use another approach called synchronous demodulation by using the Analogue AD630.
Synchronous demodulation functions somewhat similarly to rectifying a bandpassed signal, where the amplitude of only a narrow spectrum of the signal is measured. This approach overcomes the difficulty of high precision filters by using the unamplified signal from the function generator as a reference and only demodulating the component of the attenuated signal in-phase with the transmission signal. After this, the demodulated signal (now DC) is stripped of any lingering AC signal using an active low pass filter and brought within range of the ADC by a TI PGA280 programmable gain amplifier. The Hauser Group was the first to establish using the AD630 in laboratory C4D instruments, finding that it substantially simplified the detector circuitry while at the same time increasing the quality of the output signal.
Sounds good! A comparison of the signal processing stages of traditional instruments vs. ours is below:
C4Derpillar:

Traditional instruments:

A schematic of our signal processing module can be found below:
Pickup amplifier and synchronous demodulator passing a demodulated signal to the ADC:


Signal digitisation
For signal digitisation, most groups take advantage of commercial DAQ units, which are routinely accessible in university laboratories (such as the EDAQ or many Native Instrument products). Unfortunately, for normal users, the units are prohibitively expensive, costing several thousand dollars. This didn’t make sense to us as the majority of commercial units do not have remarkable specifications and are quite bulky, requiring mains power to operate. Obviously, this issue would be a huge roadblock to the average user trying to record things in the field. We have overcome this constraint in our design by taking advantage of the Linear LTC2440 24-bit 3.5kSPS SPI ADC. The LTC2440 costs ~$4 and has terrific documentation for Arduino with example code written by the company (see Linduino). Sampling at 24-bit/3.5kSPS will give us superior resolution to the 21-bit/20SPS maximum reported in the academic literature and the 18-bits/1kSPS offered by commercial units such as the EDAQ (Francisco, do Lago and Lucio, 2009). In our testing phase we aim to determine the optimal sample rate, and if there is any reason to sample at resolutions greater than 1kSPS.
We have also made a significant improvement by housing the signal generation and processing/ADC in a combined module that is designed to fit over the capillary tube, rather than using a large standalone unit. This autonomy reduces the complexity end users have to deal with, while at the same time substantially enhancing the portability of the detector. Our plan is to connect each detector (one each for anions and cations) to a Teensy 3.1, which has more than enough power to read two 24-bit ADCs and write to a SD card/serial simultaneously, while maintaining the device’s backend. The detector design is also modular in that tubing other than capillaries could be used simply by modifying the hole diameter in the design file.
By combining the described technical advances from the semiconductor industry with the referenced detector of the Hauser Group, our detector represents a culmination of the cutting-edge in C4D detection. The placement of a C4D detector directly into the hands of the public for such a low cost is something our team is VERY passionate about, because it empowers people with the ability to analyse virtually any aspect of their life with better precision than laboratory grade instruments. This will lead to society as a whole being more informed about the chemical forces that govern our life, from toxic heavy metals to beneficial flavonoids in food. In order to do this, we are developing a robust, social data analysis platform, which will be described in detail in future posts.References
Stojkovic, M., Schlensky, B. and Hauser, P. (2013). Referenced Capacitively Coupled Conductivity Detector for Capillary Electrophoresis. Electroanalysis, 25(12), pp.2645-2650. [open access]
Discussions
Become a Hackaday.io Member
Create an account to leave a comment. Already have an account? Log In.
Within the THE Port hackathon Team "Pier15" we are looking into CE methods to analyze counterfeit drugs. Would like to to collaborate with us on this topic? http://theport.ch/home/the-port-2015-cern/#topic-pier15
Are you sure? yes | no
YES please! Feel free to send me a PM - I was actually looking at doing a similar analysis for festivals or something :)
Are you sure? yes | no