 rawe
raweKnown work:
There are various vectorizer tools and algorithms available (e.g. Inkscape includes some). Lots of papers describing fancy algorithms show up if you dig deep enough. The readily available solutions do not fit my problem, as they create filled polygons. Work on these results means to read and "understand" the existing vector graphic and transform it in another vector graphic that only contains lines. The scientific papers, filled with matrices, high level math and no available actual source code implementation are nice for inspiration, but I am just too lazy to fully understand these, convert these papers to actual code, run and debug it and then find out that it does not fit my problem (where would be the fun part?)... but a great inspirational source.
The closest thing to what I want as a result is described in the Eggbot wiki over at evilmadscientists:
- http://wiki.evilmadscientist.com/Hatch_fill
- http://wiki.evilmadscientist.com/Creating_filled_regions
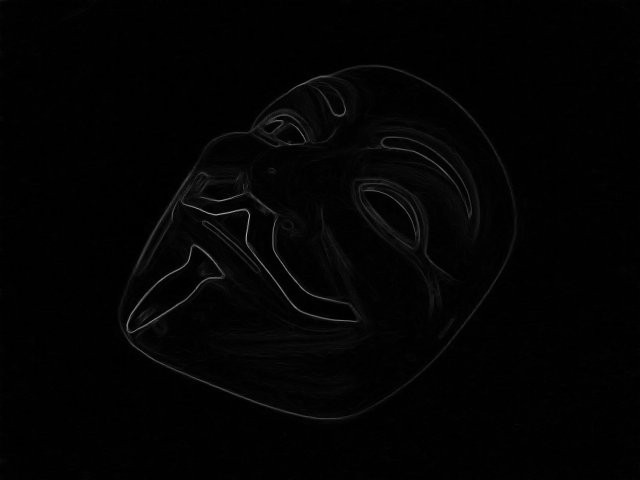
But I don't want evenly spaced lines, the "hatching" look is what I am after. Lines should follow contours. Darker areas should use tighter line spacing.
Current status (mid-feb 2016):
For now, I've already implemented some nice algorithms that are easy to understand and just use basic programming stuff. Images are 2d arrays that contain an RGB-value at each entry, everything else consists of lists and variables. No fancy math formulas, laplace transforms etc. to show off my brainpower - basic algorithms mixed with (hopefully) smart ideas. No multithreaded worker-thread-kung-fu. This results in slow code execution and overhead, but increases flexibility and comprehensiveness. After all, if van_gogh.exe works, and it is slow, it should not be too hard to boost the performance by some optimizations or just take the concept and re-implement it in matlab...
Ok, so...?
The plan is to describe single puzzle parts that do something with image data in the project log and show some example pics along the way. These should base on the output of the previous puzzle part(s) and "enhance" it by some way, e.g. extract information or combine information for conclusions. Finally there should be some puzzle parts that take all that extracted information and draw lines on a virtual surface (and in an HPGL file to feed a pen plotter :).
Watch out for a median filter implementation that also extracts contours, or a "motion vector" (ok, its just a delta-x, delta-y) extraction and interpolation thingy, a line following, mountain climbing bot and propably more.


 Right now, filling is just a quick hack and needs improvement. There are much more points in there than necessary. Paths can be combined (if end-start, start-start or end-end are near each other) and certain intermediate points can be omitted. More on this in a followup log...
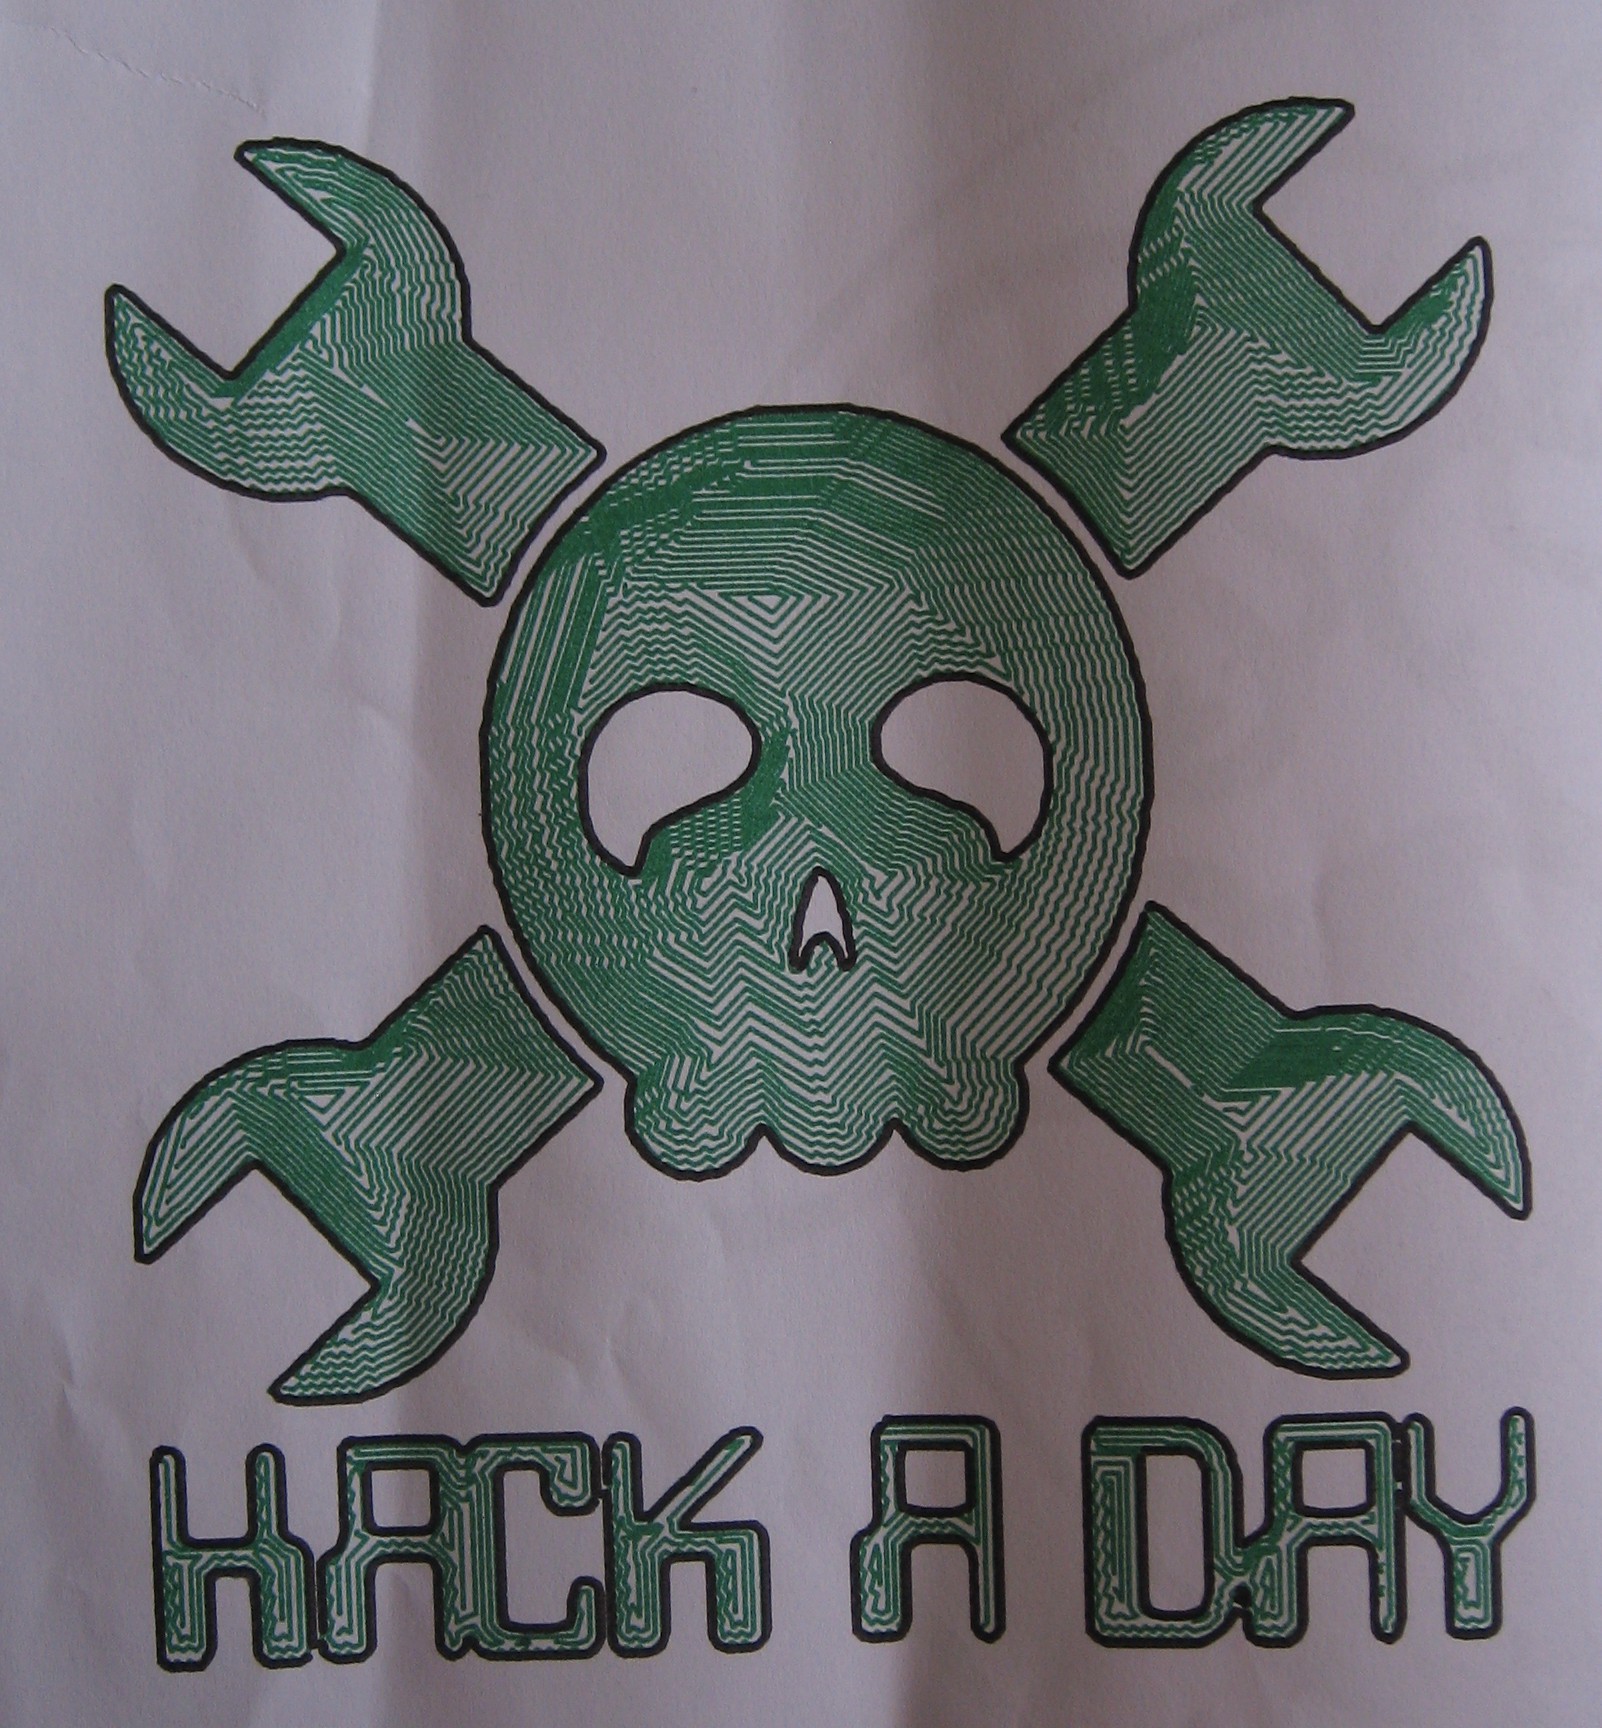


 Chris.deerleg
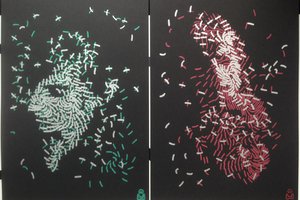
 Christian Walther
 Dennis
 Ahron Wayne