EK
EK-
Autonomous Routine Testing
09/27/2016 at 03:14 • 0 commentsIn order to reach the larger goal of making the robot more efficient than a human at collecting shoreline debris, it will require autonomous behaviours. The first step will be to make the sequence of moves required.
We created two modes, here is a video of them in action:
Both modes begin with a home position - with the arm and claw up. Code update can be seen here
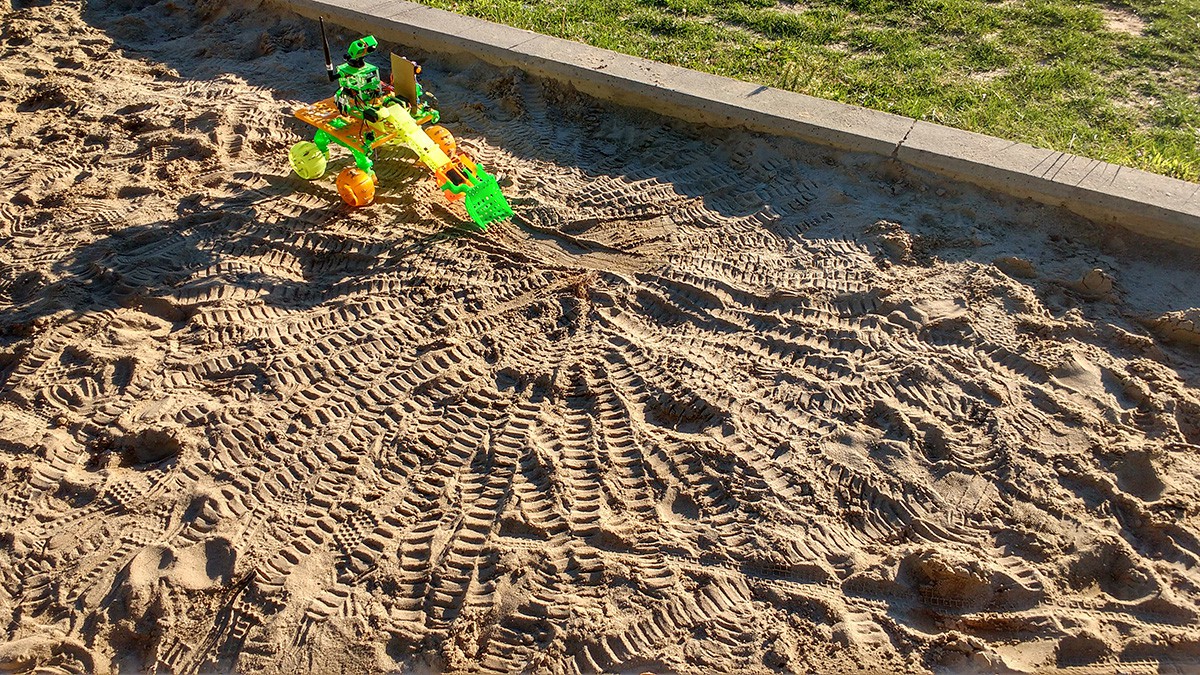
Mode #1
![]()
Mode #1 uses the scoop as a way to move across the sand. The idea behind this is that with another type of end-effector, perhaps a rake, this will be effective to collect items that are flexible and light - such as candy wrappers.
Sequence of moves:
- Arm down
- Claw down
- Backwards (2s)
- Stop
- Arm up
- Claw up
- Forward (1.5s)
- Turn right (0.2s)
- Stop
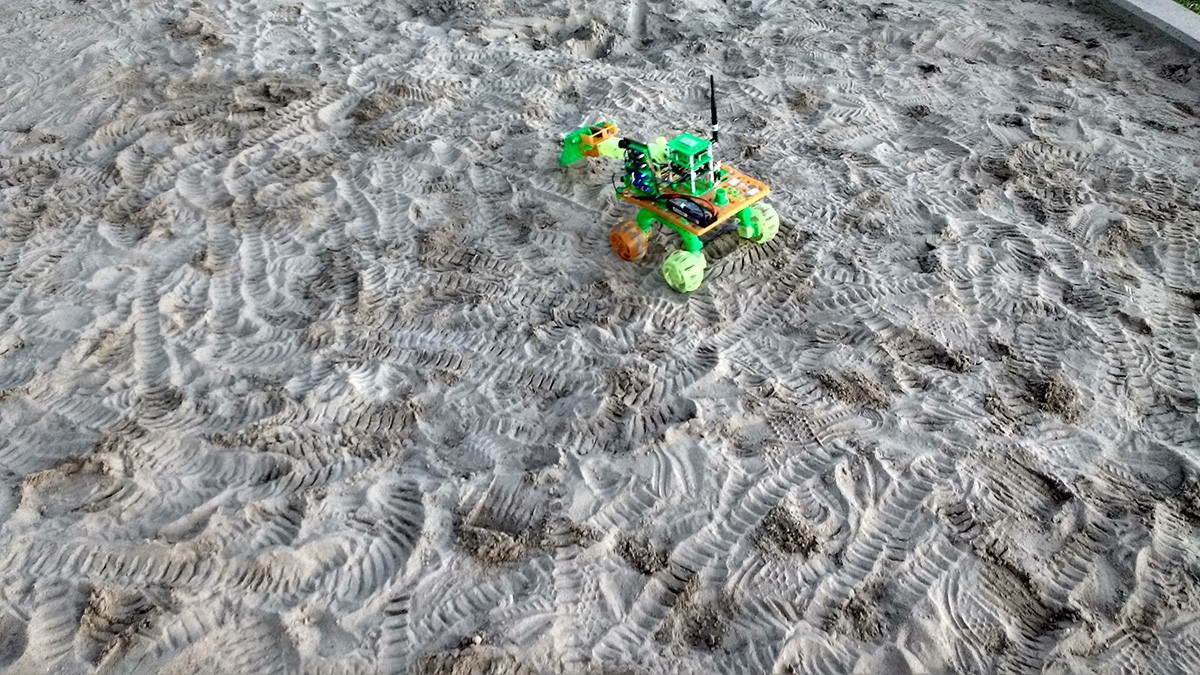
Mode #2
![]()
Mode #2 uses the scoop to collect some sand, and move it to a different location. In the next version, the movement of it will be at a specific GPS waypoint.
It was interesting to watch a pattern being created in the sand. Timelapse video:
Sequence of moves:
- Turn right (2s)
- Stop
- Arm down
- Claw down
- Forward (1s)
- Turn right (0.2s)
- Turn left (0.2s)
- Stop
- Backward (0.2s)
- Claw up
- Arm up
- Turn right (1s)
- Arm down
-- 3x:
-- Claw far down
-- Claw up
- Arm up a small amount
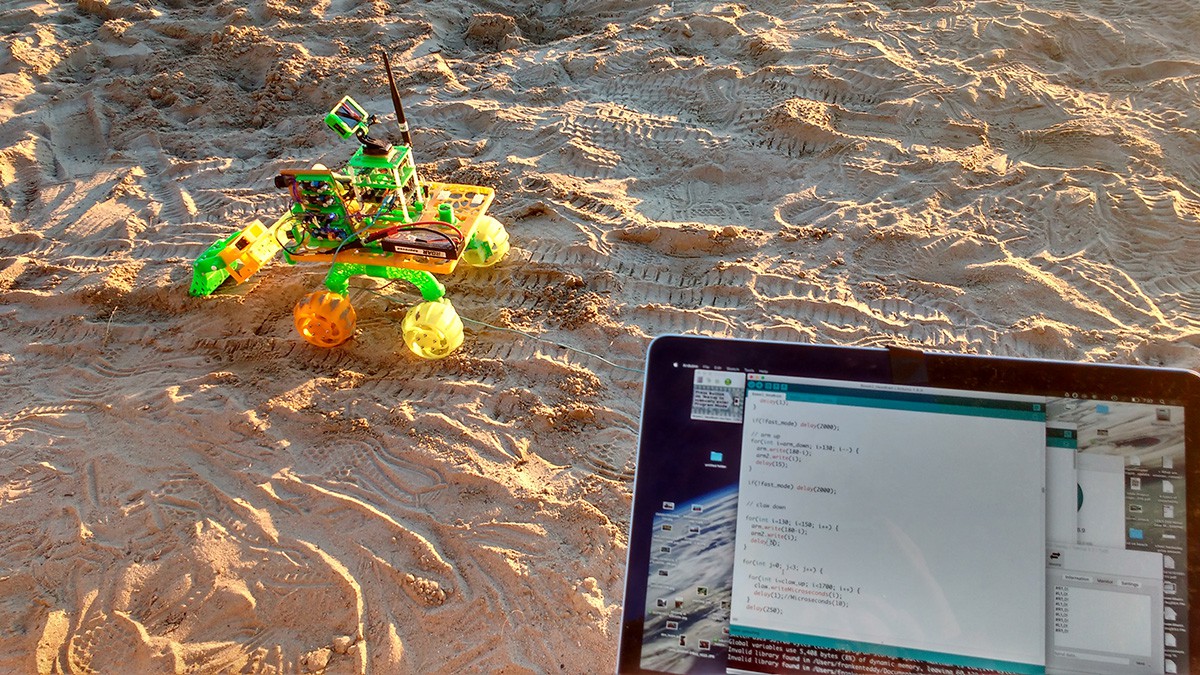
Results
The iteration of the code was incredibly useful to do in the field because we were able to adjust and see the timing of the steps. For example, in Mode #2, we noticed that the scooping results improved (more sand in the scoop) when the wheels turned the robot (and scoop) slightly, twice.
![]()
The top 3 items that can be improved for next time are:
- Implementing functions for basic robot operations in the code
- Using the ultrasonic sensors for obstacle detection
- Adding a sensor to receive feedback from the scoop end effector about where it is in relation to the ground
-
Environment + Robotics
09/18/2016 at 03:13 • 0 comments![]()
Inspiring today to see the connection of the environment + robotics in action! We had an amazing time during the Great Canadian Shoreline Cleanup at Guild Park & Gardens — volunteers helped to collect debris in the park, and also helped field test Bowie the robot
Valuable
Seeing this connection is valuable because it shows that we can help improve the environment: by working together and raising awareness that this is important; and by developing new tools to increase efficiency and our understanding through sensor data.
Check out more photos from today in our photo album, on @GuildPark, and internationally at #2016Cleanup
-
International Coastal Cleanup Day
09/16/2016 at 15:12 • 0 commentsSeptember 17th marks the International Coastal Cleanup Day. Many groups around the world will be collecting shoreline debris to help keep our coastlines clean. The data that is recorded leads to more insights about the debris that has washed ashore.
Check out this video to see how much trash was collected globally in 2012:
Robot Missions will be participating through the Great Canadian Shoreline Cleanup at Guild Park & Gardens
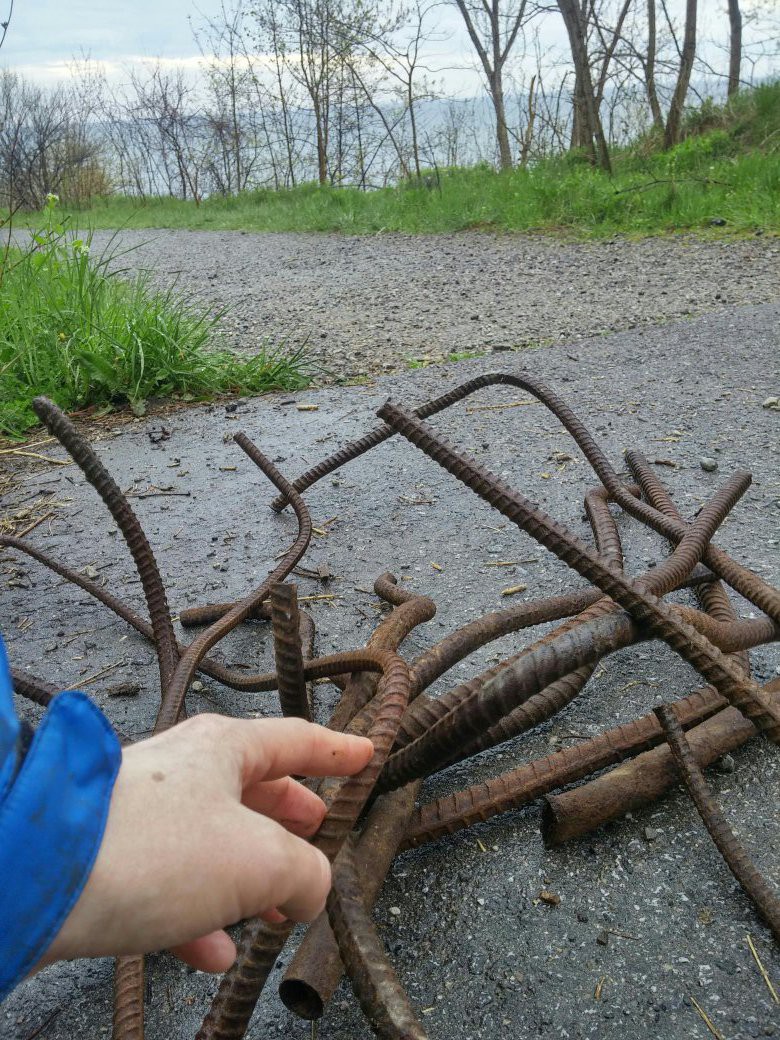
There is evidence of big trash:
![]()
@RobotMissions Will we get to see Bowie in action on Saturday? The rebar is all gone but stll lots to clean #ScarbTO pic.twitter.com/sffz23V1pQ
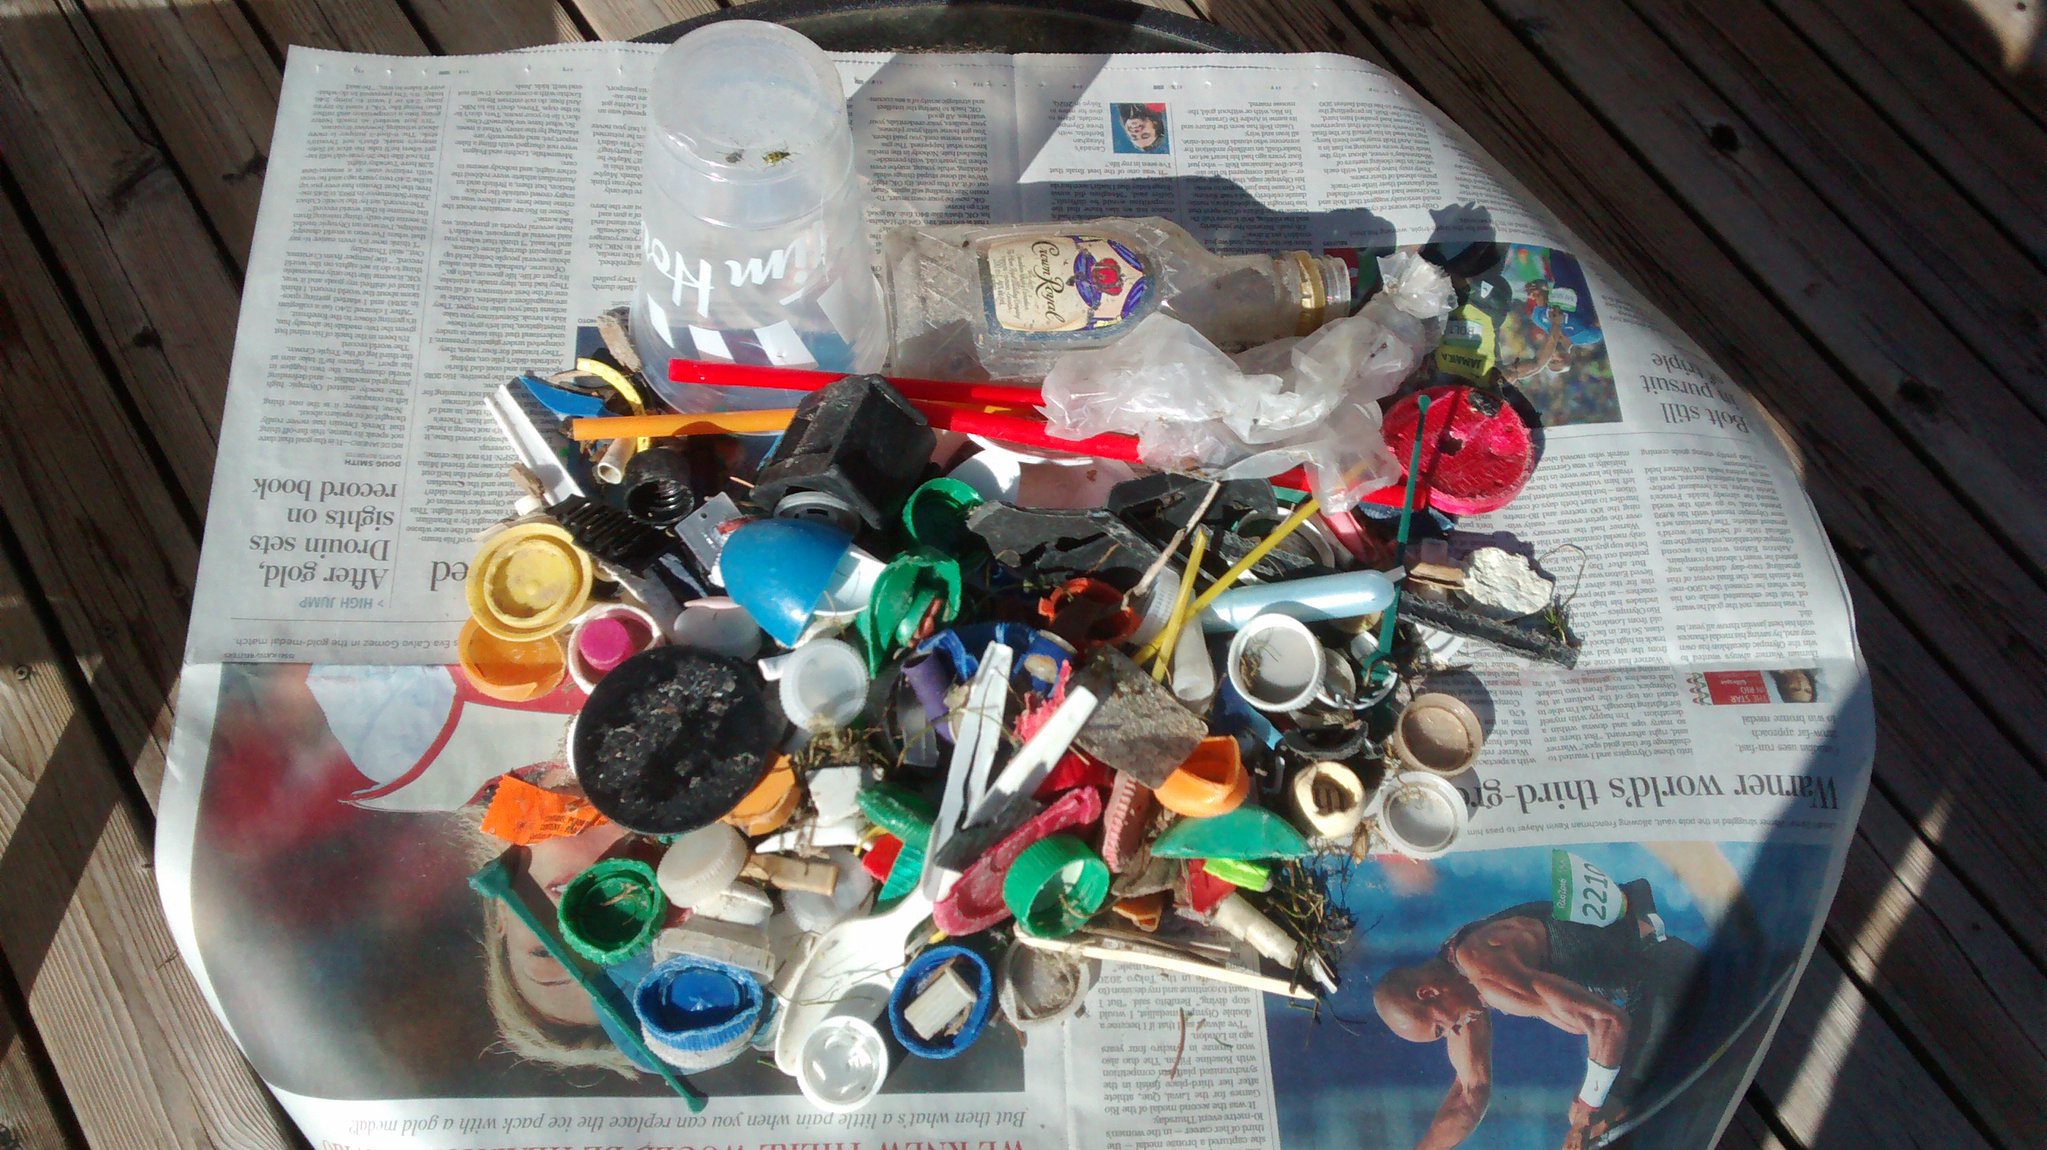
— Friends of Guild P&G (@GuildPark) September 16, 2016And tiny trash:
![]()
What could you find in a 7 minute #shorelinecleanup? Rose from #Ontario found 179 pieces of #plastictrash @GuildPark pic.twitter.com/X00uCFinqf
— Shoreline Cleanup (@cleanshorelines) August 25, 2016We are looking forward to learning more about the types of debris they find, helping to clean up, and taking Bowie on a test run.
Whether you are near an ocean, river, lake, or even a storm drain - find somewhere to collect trash and help reduce the pollution.
Stay tuned for what our results are!
-
Robot ventures far, far, away
09/10/2016 at 03:38 • 1 comment![]()
With some new improvements on the power supply and drive system, we wanted to see how far Bowie can go. We packed up the robot and headed to a park with an open field, which is a great place to test out manual, compass, and eventually more GPS driving.
Manual
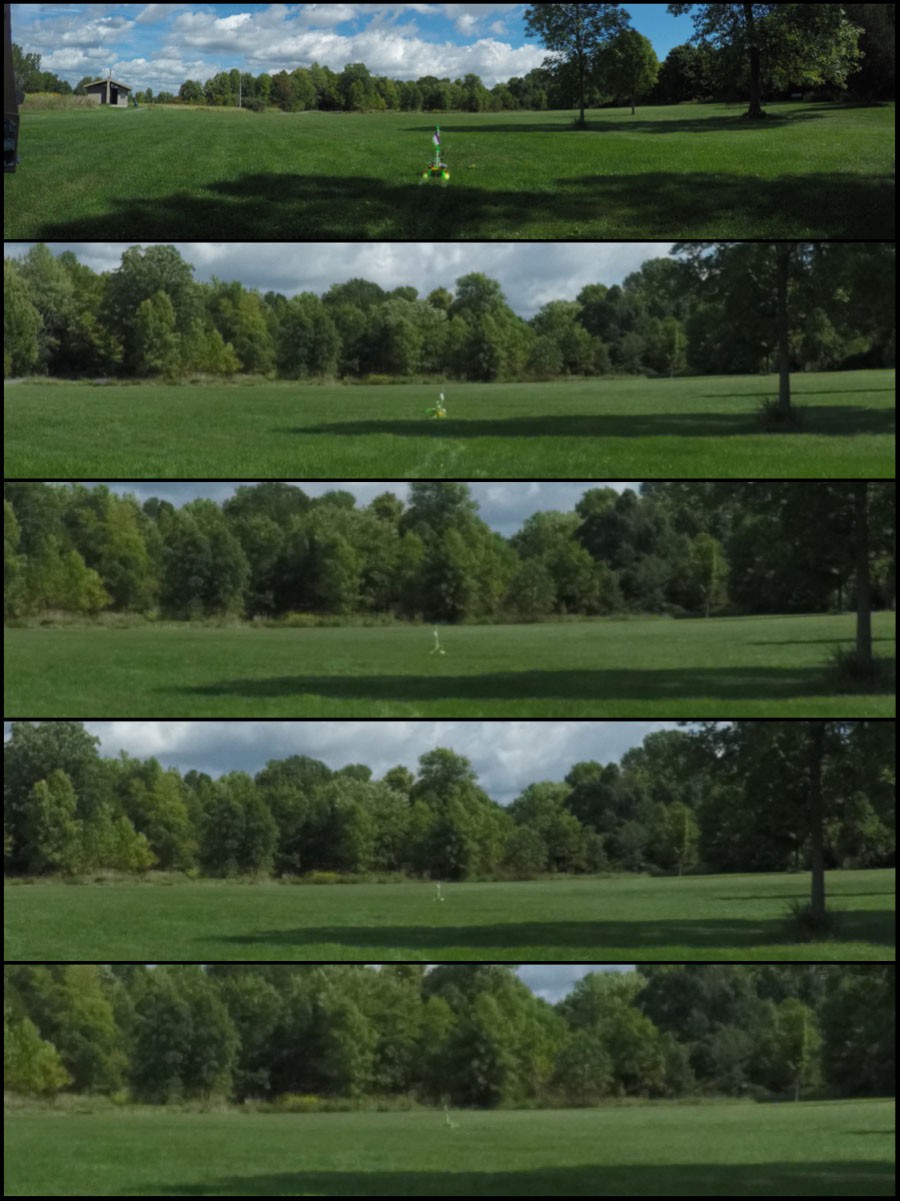
We manually drove the robot across the field, check out the timelapse here - don't lose sight of the robot! Video:
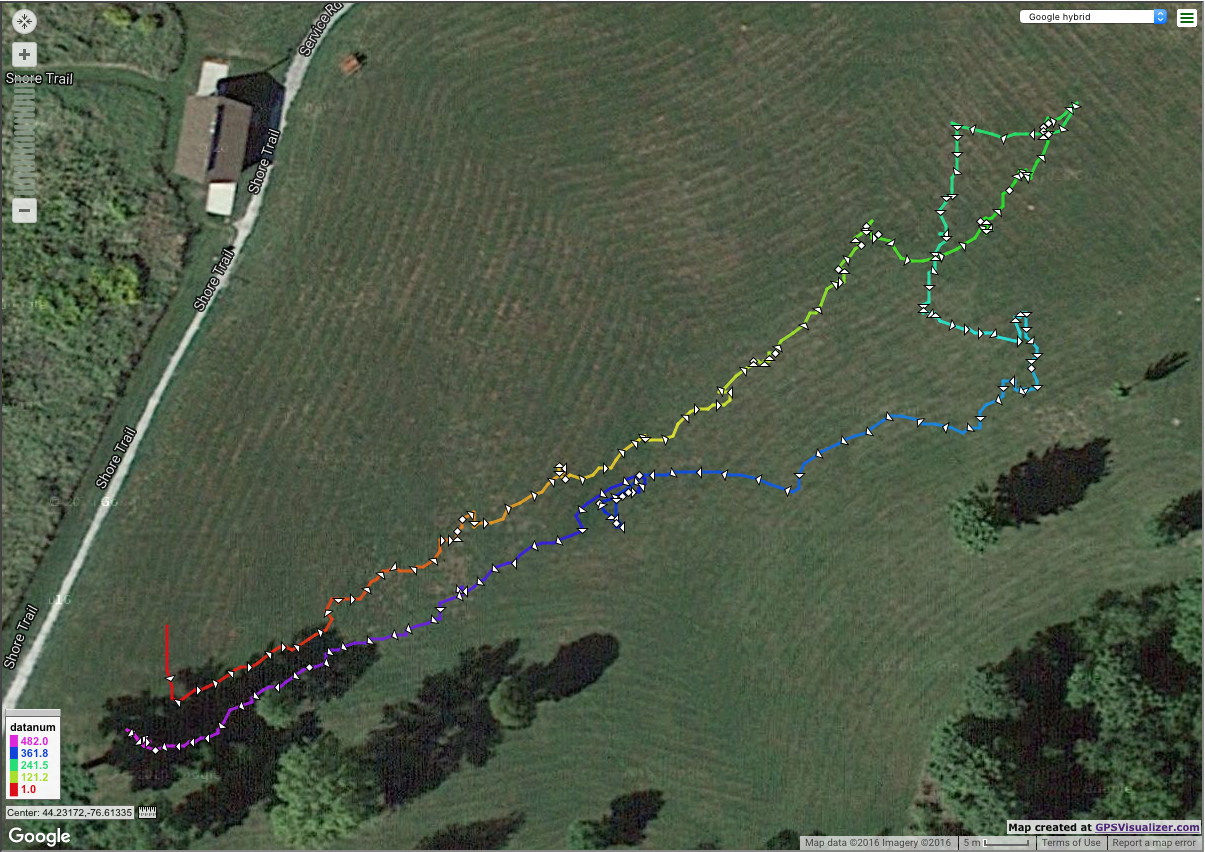
With the GPS data, we can see the path the robot was driven along:
![]()
First half the robot travelled ~120m in 15.3 mins, and second half the robot travelled ~152m in 16.3 mins.
The tickmarks are every 10 seconds - closer tickmarks mean the robot was moving slower, farther away means the robot was moving faster. This can be due to the length of the grass, and any inclination difference.
Check out the interactive version of the map here
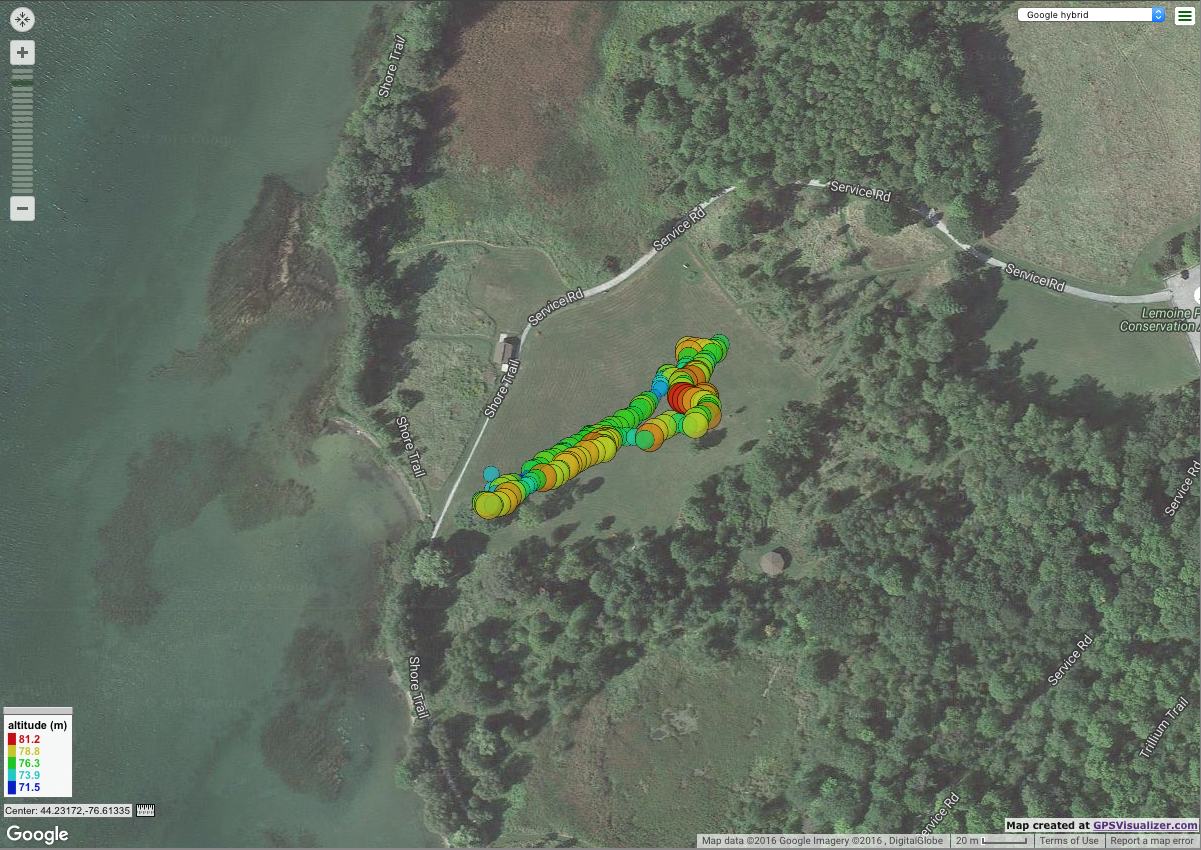
Altitude
Using the altitude sensor, we can get a better understanding about the lay of the land:
![]()
The altitude range was 71.5m to 81.2m. Larger dots represent a higher altitude. For the spectrum, red colour indicates highest and blue represents lowest.
See the map here
Compass
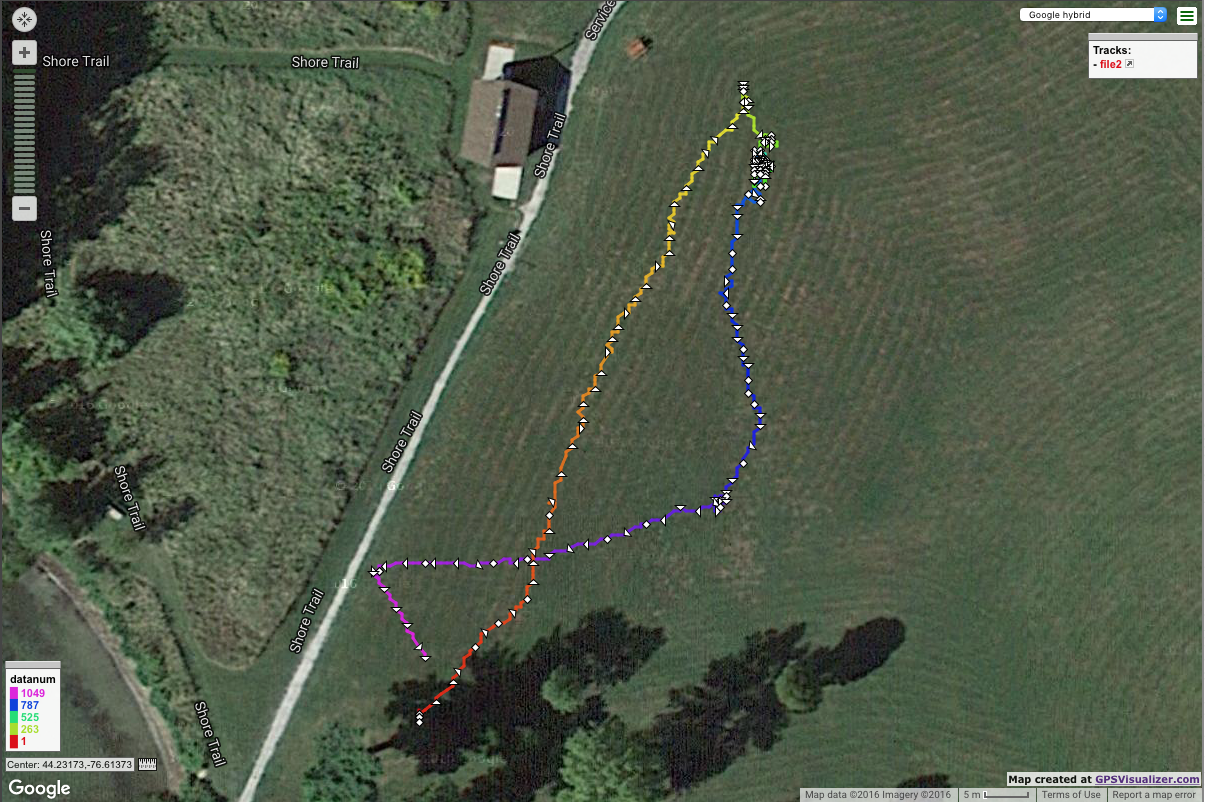
Next up was to try driving autonomously with the use of the compass
![]()
The first leg (red->yellow) of the path was not working out as planned, which lead to us having to recode the algorithm in the middle of the field in order to get the robot back to our temporary mission post.
The second leg (blue->dark blue) was improved, and changes were made on the fly.
The third leg (blue->purple) is where the changes were evident. The robot appeared to be navigating more smoothly, though we can see in the GPS data that there was a bit of an arc.
See the map here
Squares
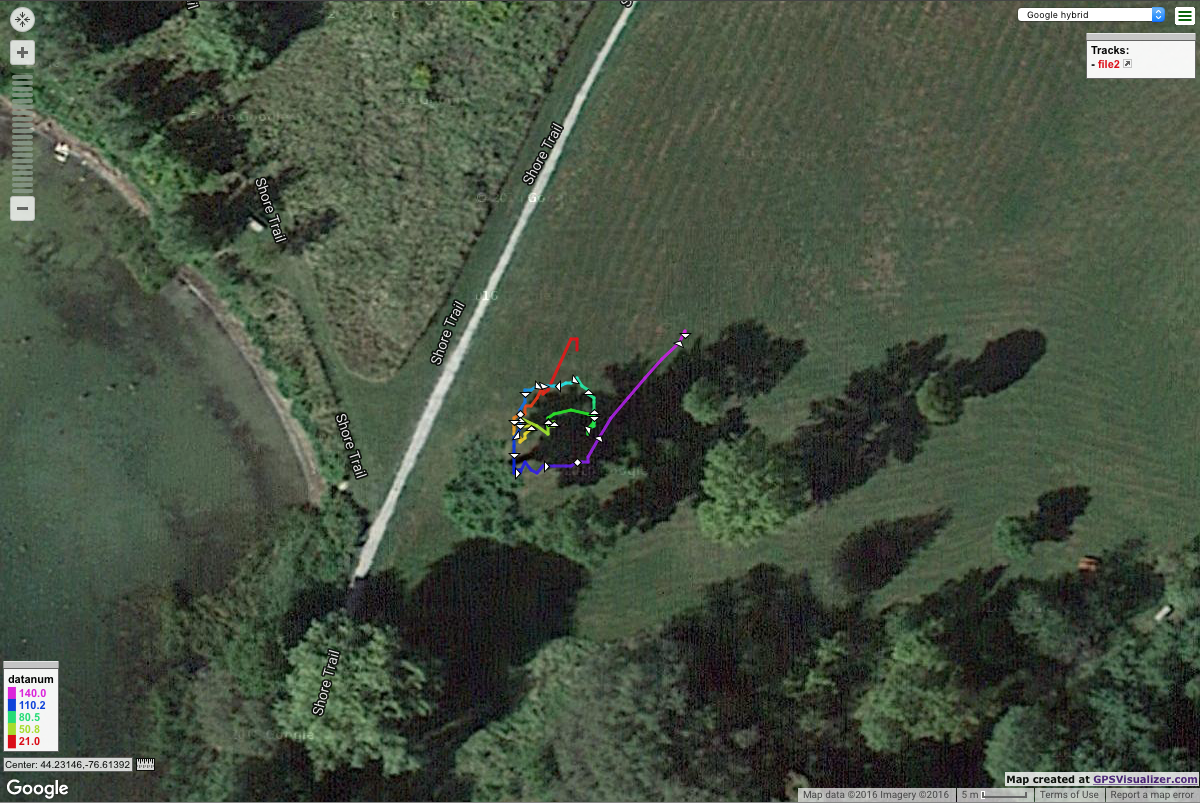
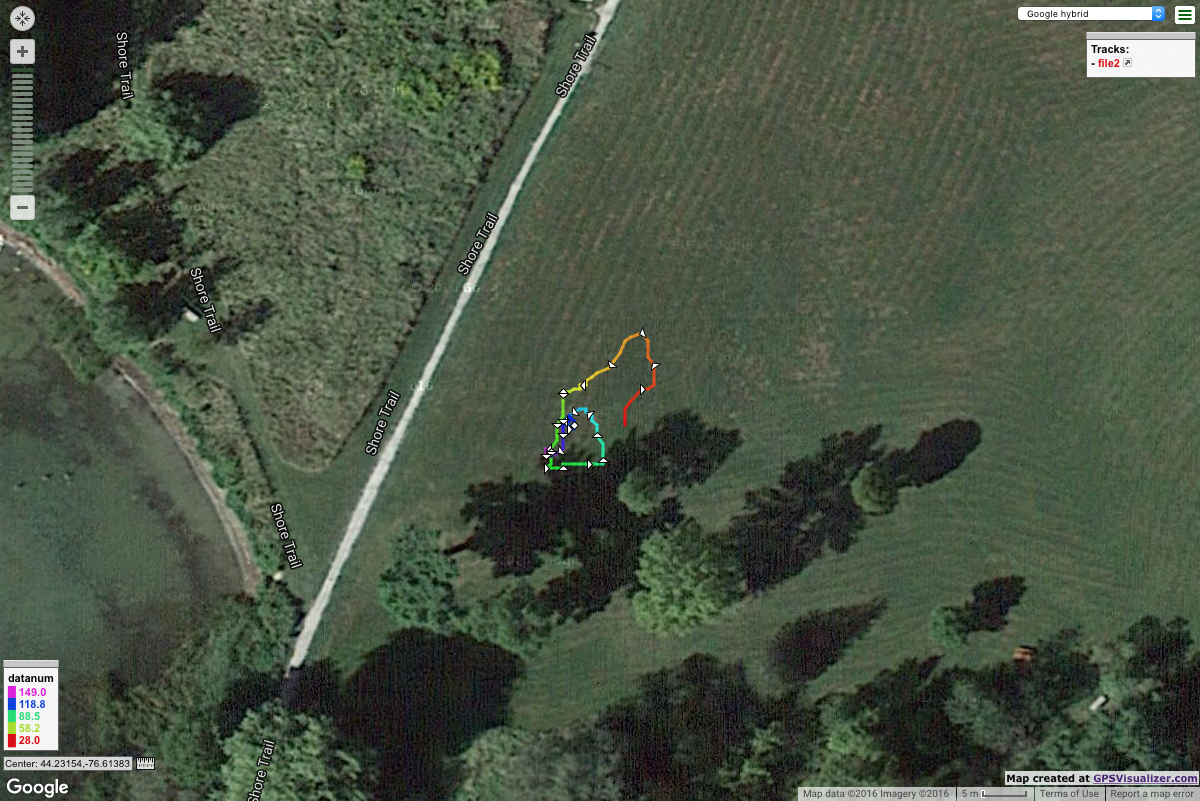
With the compass working better, it was time to try some "squares"
![]()
Try #2:
![]()
The squares are generated by changing the heading 90 degrees apart after a certain amount of time. The time was increased in Try #1 and Try #2.
Results & Observations
It was extremely beneficial to spend dedicated time debugging & working on the robot outdoors. Data files and python scripts for the maps can be found in this repository. Here is what we learned:
- Robot range is at least 150m using the XBees for control
- Battery lasted the entire time, still has charge
- Upgrades to drive system performed well in the grass
- Upgrades to the power supply worked excellent
- Flag poll helped with being able to see the robot from far away
- Improved compass navigation code
3 improvements to be made:
- Navigating between headings (the square)
- XBee reliability, needs to stop entering into packetization mode
- Receive indication on the controller side that the robot is still connected & alive (battery level)
-
Wheel stress simulations & result
09/07/2016 at 02:22 • 0 commentsRight when we were testing out the autonomous GPS code, one of Bowie's wheels broke
![]()
We decided to simulate the wheel, applying a 2N force to the center face of the wheel. It was constrained on the outer rim.
In reality, this would represent the scenario that happens when the robot is turning. The center piece is either being pushed or pulled depending on the direction, since turning is controlled by motor speed and direction (rather than a steering servo).
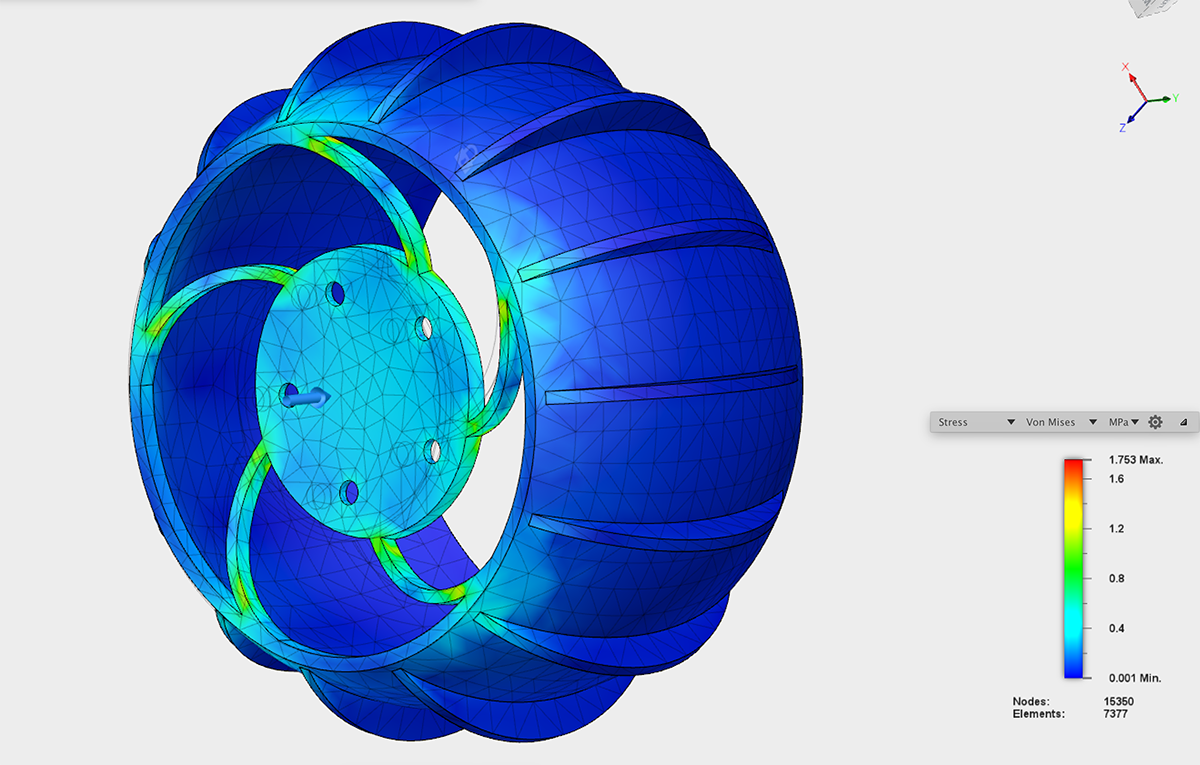
Using Autodesk Fusion 360, we simulated stress on the wheel. Animated view of stress simulation:
Looking at the Von Mises stress simulation, you can see that the weak parts are the spokes:
![]()
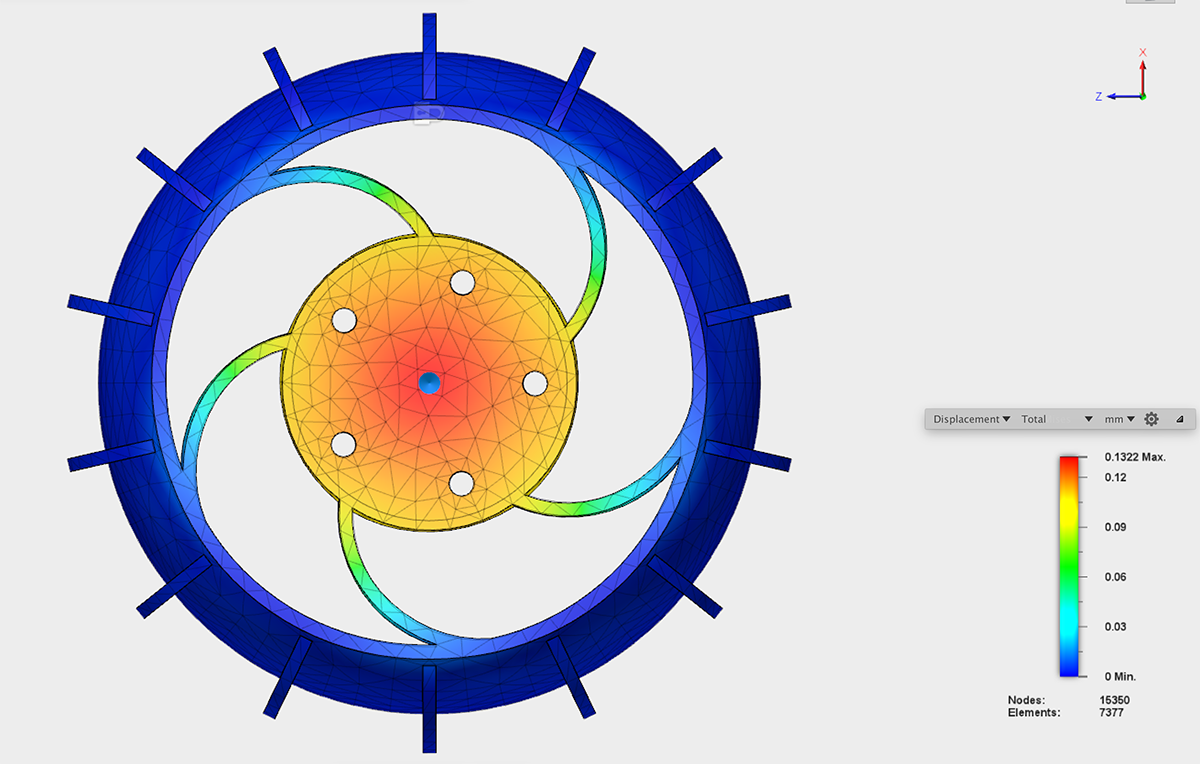
This displacement map shows that the center moves quite a bit, extending to the spokes as well:
![]()
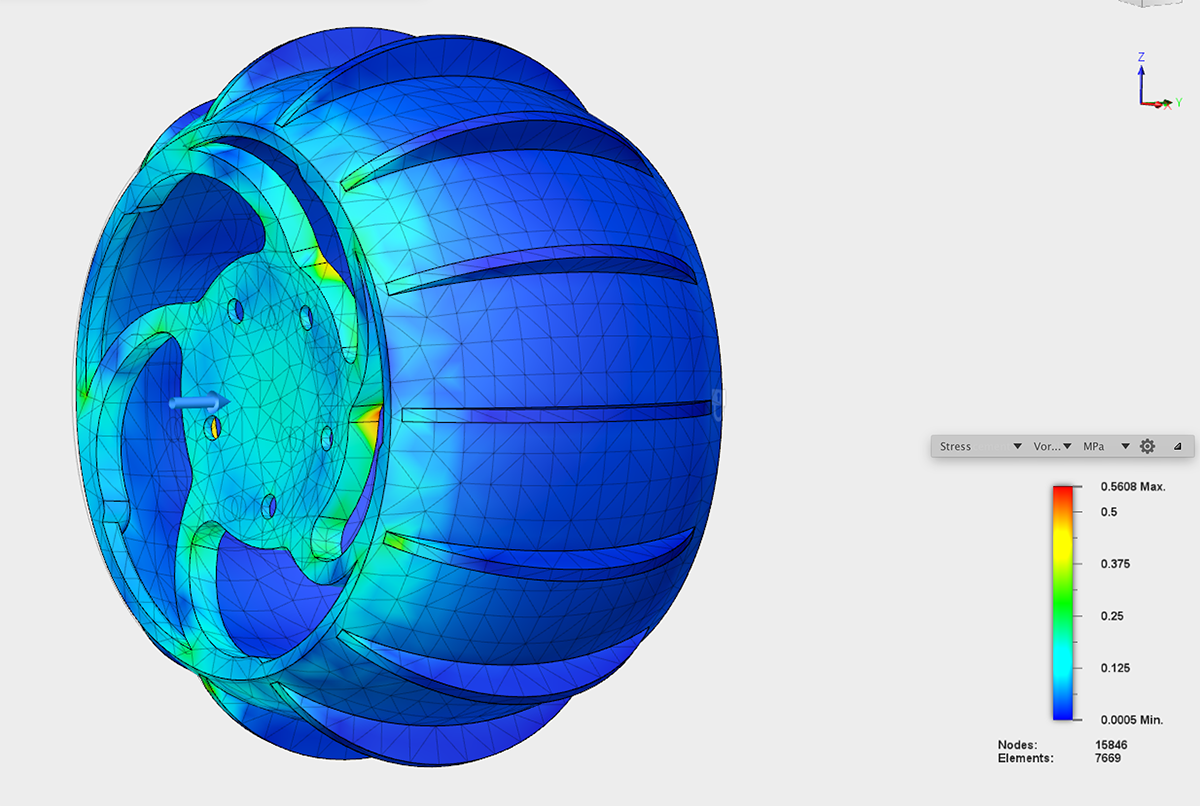
For the new wheel, the width and depth of the spokes were increased. Here's the new Von Mises simulation:
![]()
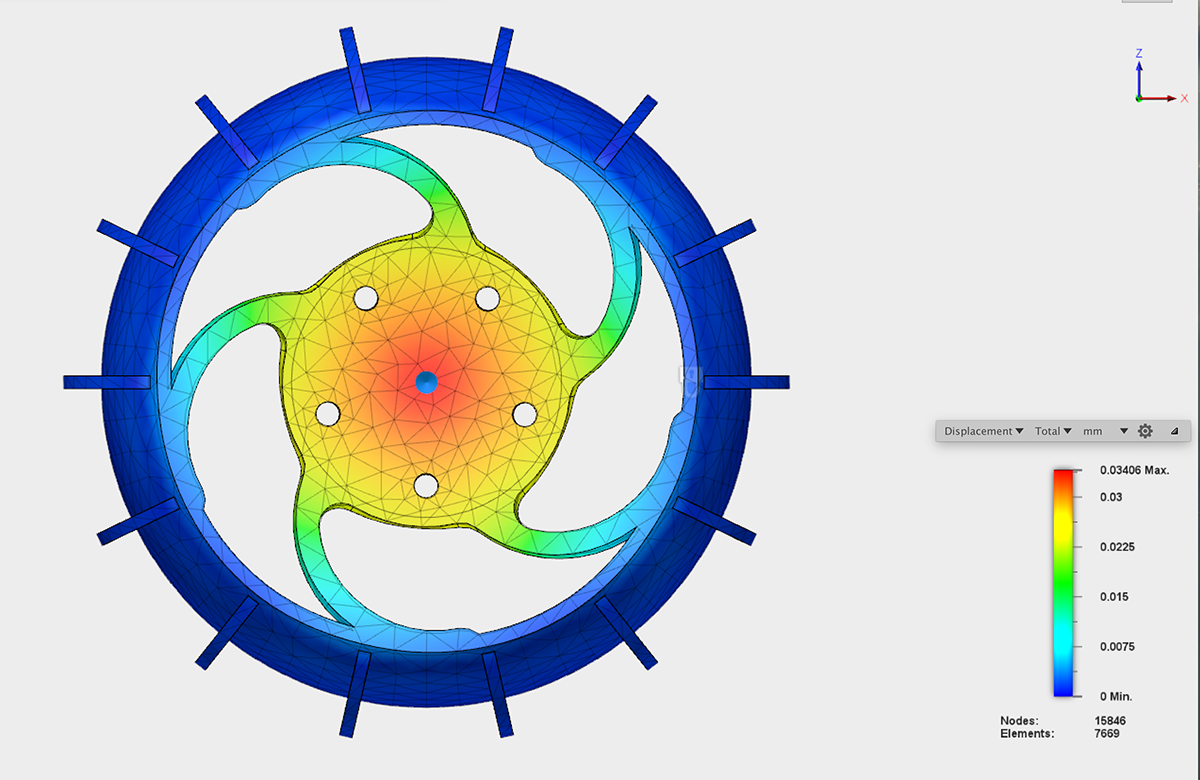
The displacement map doesn't carry out as much to the spokes:
![]()
Result: New wheels are holding up so far!
![]()
-
"To the flag post!" - Magnetometer navigation
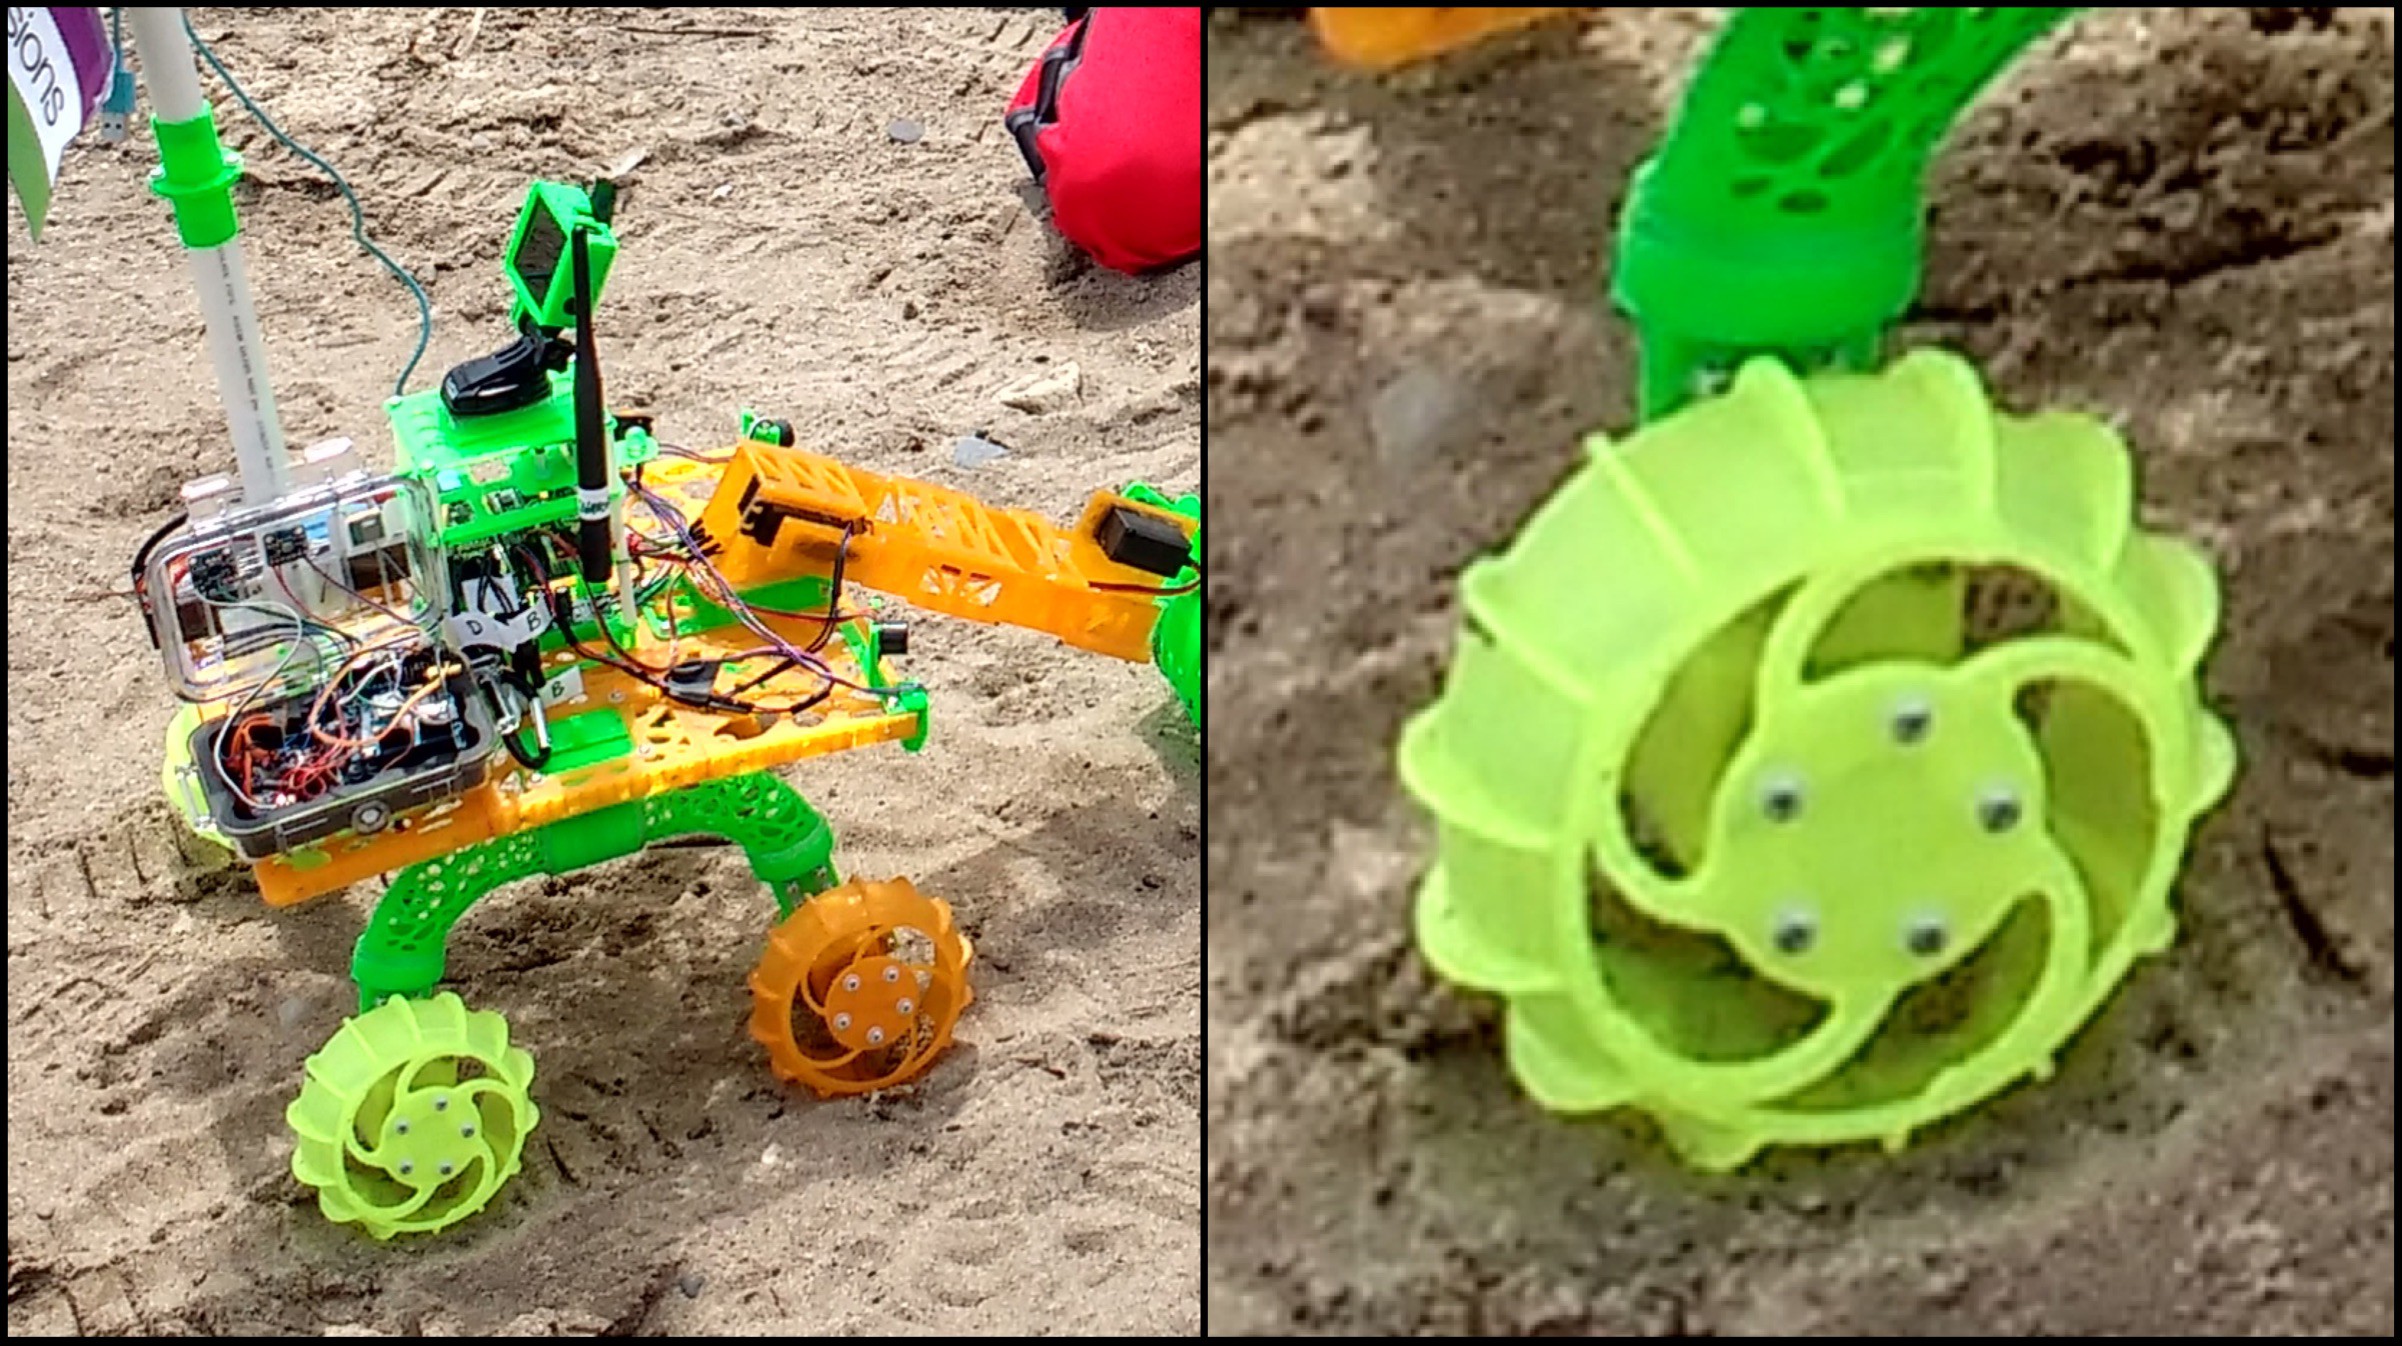
09/03/2016 at 19:43 • 0 comments![]()
At the SUPER Field Test, one of the experimental tasks was to test out the autonomous navigation code for the robot to go in a straight line. It uses the magnetometer to get a heading, and follow this within +- 15 degrees.
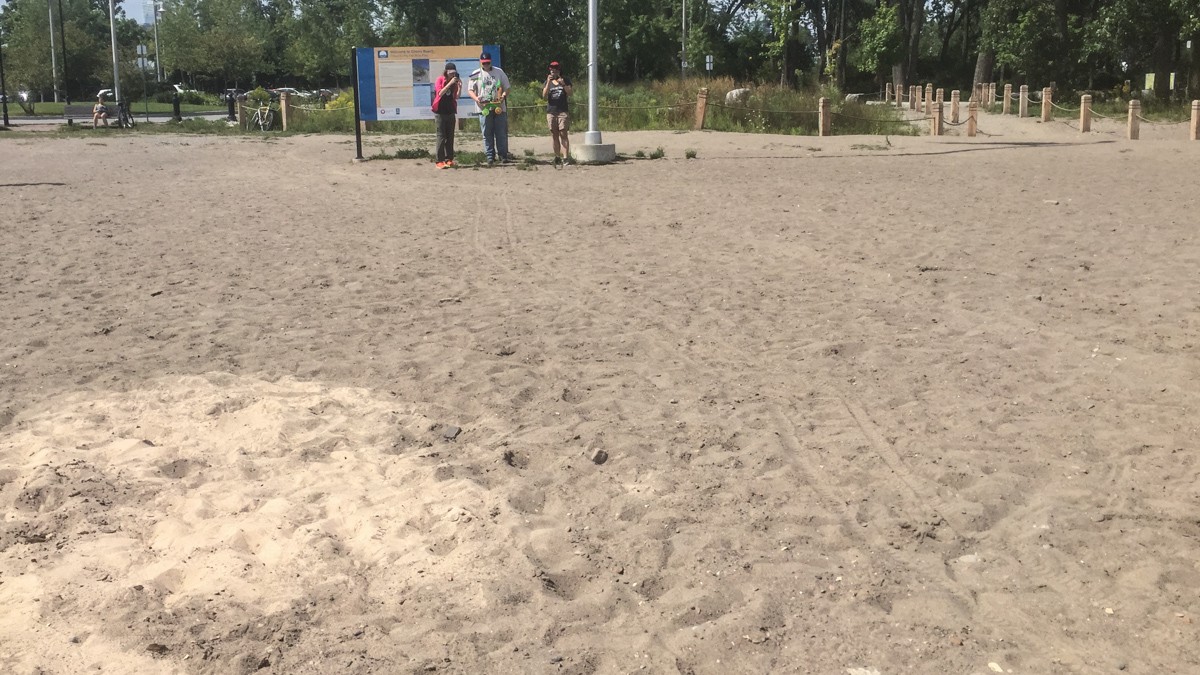
![]()
We set the robot to follow a heading to go towards the flag pole (the Blue Flag beach flag!). The robot worked through the sand to go to it! You can see the point where it hits the 15 degree threshold, then adjusts accordingly.
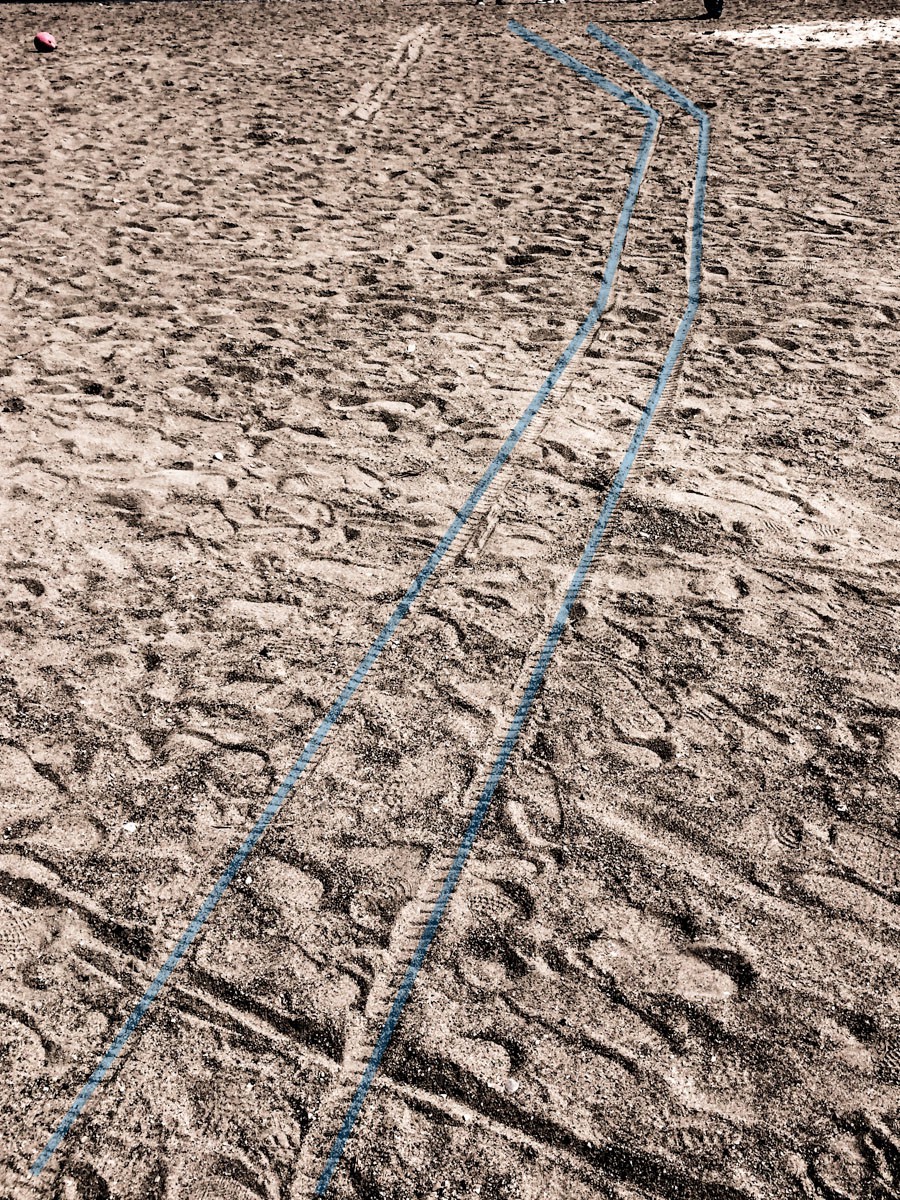
Here is the entire view of the track:
![]()
Here is the point where the adjustment was made:
![]()
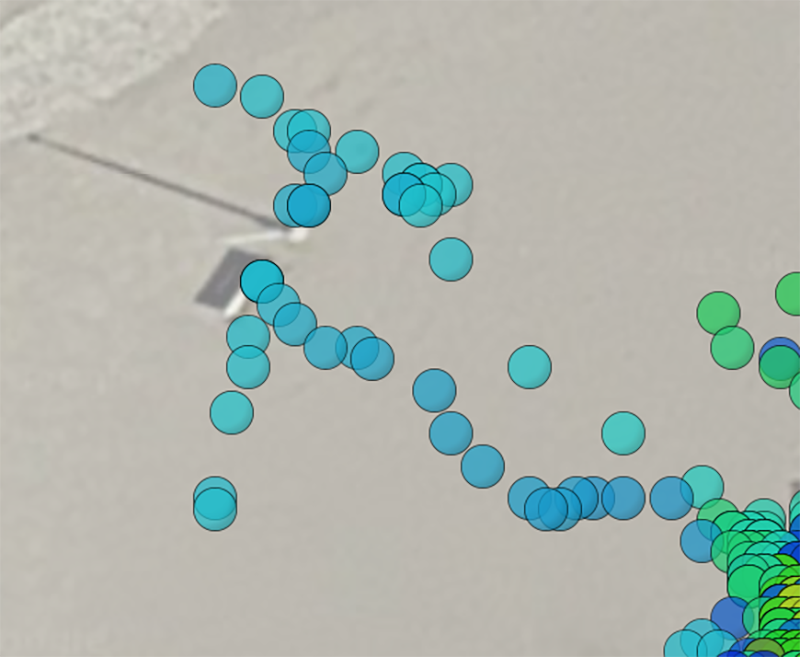
We were excited to see if the GPS onboard the robot would have mapped this, and it did! You can see the point where it made the adjustment!
![]()
Special thanks to Sam, Randy, Elaine, Derek, Agnieszka, and Sen for helping with the Field Test!
-
SUPER Field Test
08/23/2016 at 15:09 • 0 comments1pm on Saturday August 27 at Cherry Beach, we are having our SUPER Field Test
Check out this page for all the event details
![]()
-
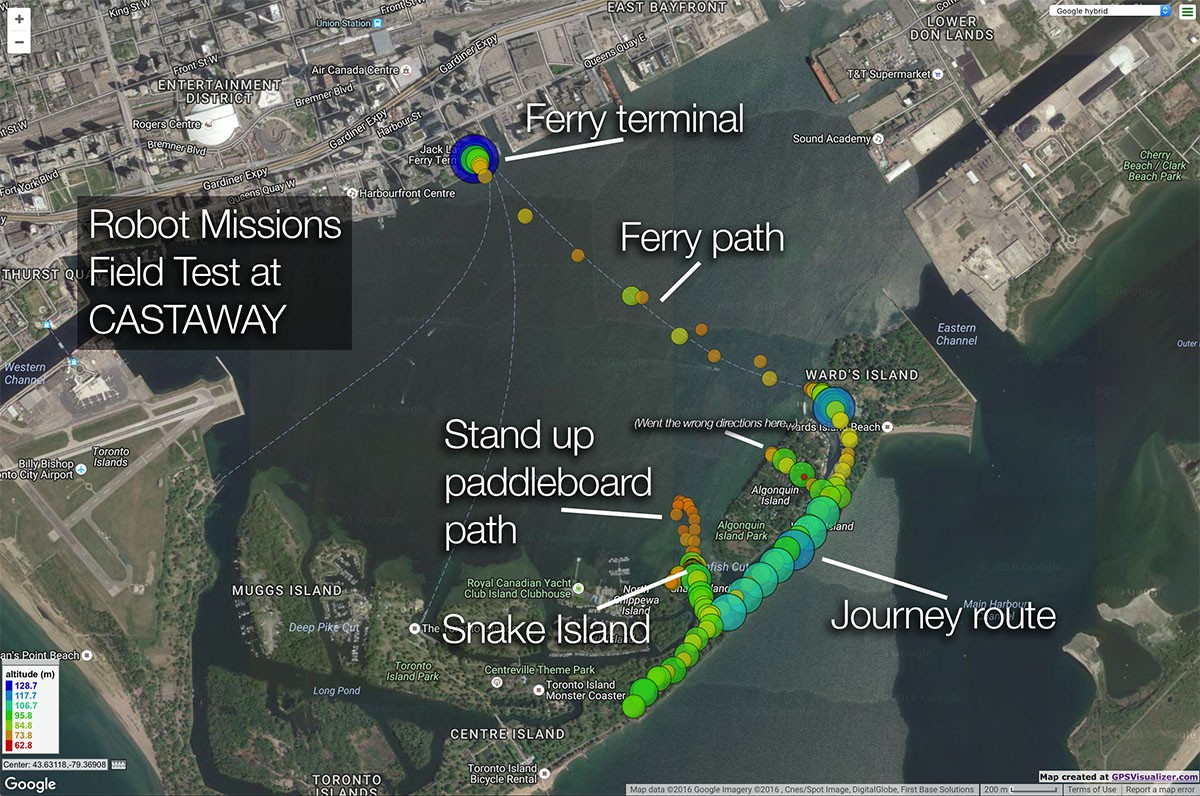
Observing key areas on shoreline with GPS data
08/17/2016 at 16:31 • 0 commentsDuring the CASTAWAY Field Test, we used a GPS unit with the robot to plot its location. We learned that we're able to see exact cluster locations of where the robot collects debris. This is extremely interesting, as we can use a similar technique in the future to find trends in where the debris is located.
Here is an exploration of the data:![]()
Sneak peek at our observations. Read on for the technical details!
![]()
Setup
Since we needed to get this ready as fast as possible, the setup was very simple:
- Arduino Diecimila
- GPS + SD shield
- Li-Ion Batt
- Powerboost 1000
- Water resistant case (like a pelican or otterbox case)
![]()
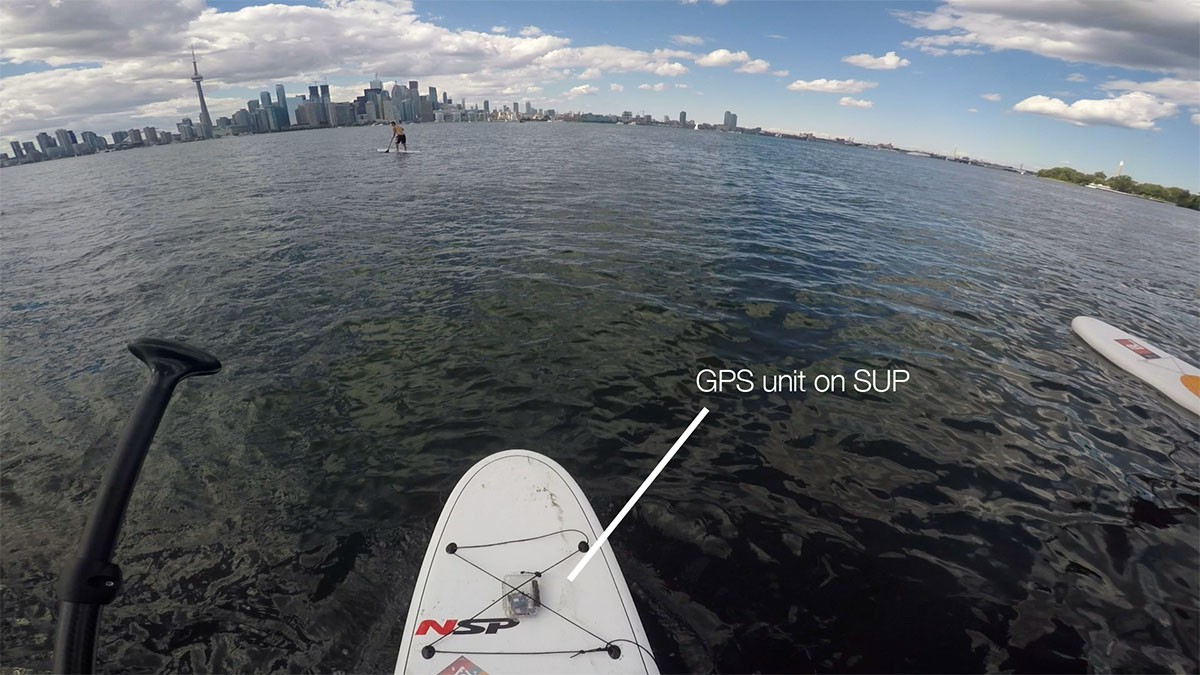
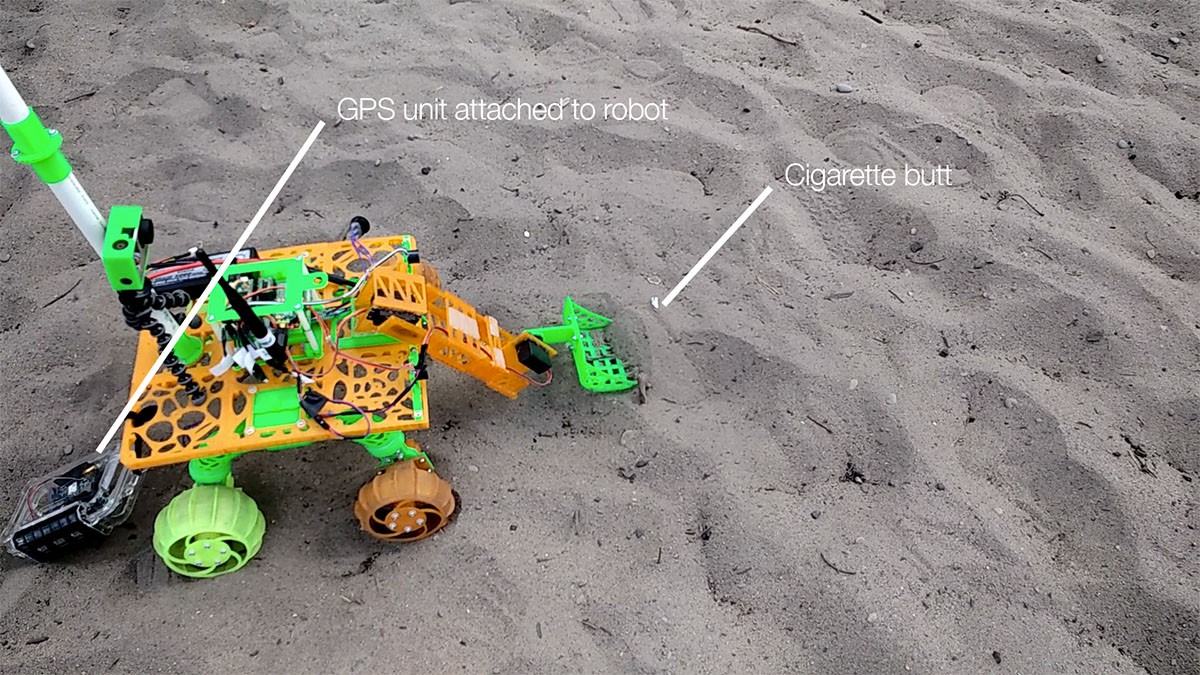
We moved the GPS unit around with us all day - either in the backpack or holding it. When attaching it to Bowie, we tied it onto the back. For the stand up paddleboard (SUP), we placed it in the cords on the board and tied it. (Glad we didn't tip over!)
![]()
Method
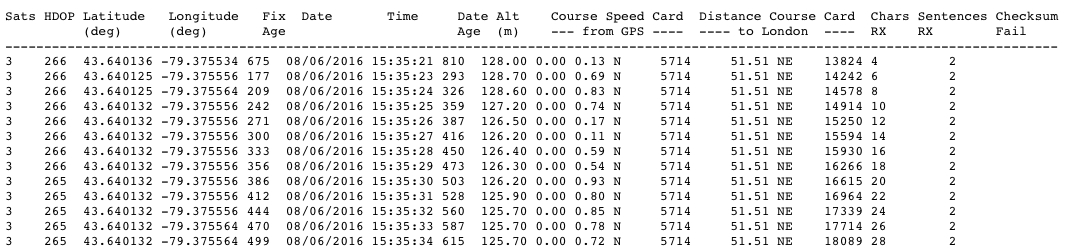
The code running on the Arduino is based on the TinyGPS++ example code. Sampling was at 1Hz, and this data was logged to a text file.
We then made a python script to parse all of the data, so that we could output it to different formats and reduce the amount of data points.![]()
We then generated 3 csv files, which included data every 60 seconds (rather than every second). This was then used with the maps.
Map
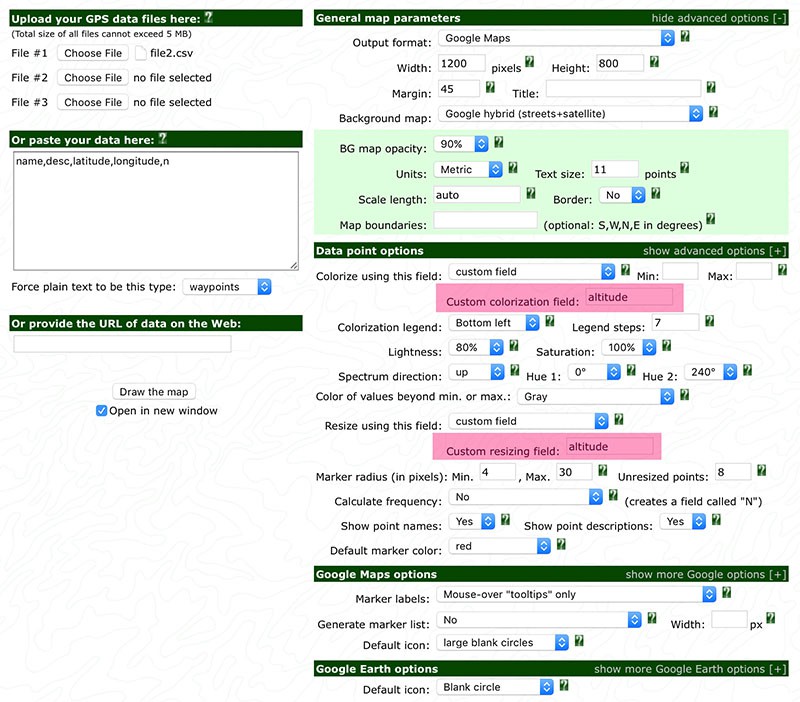
We used GPSVisualiser.com to view the data. This a great tool that is easily accessible, letting us colourise the bubbles and vary their size according to altitude.
The data source was file2.csv. The data included was latitude, longitude, altitude, and time.
Here's the settings we used for the map:
![]()
This generated a map that looks like this, where we can now visualise the data!
![]()
Observations
Below are observations from the data
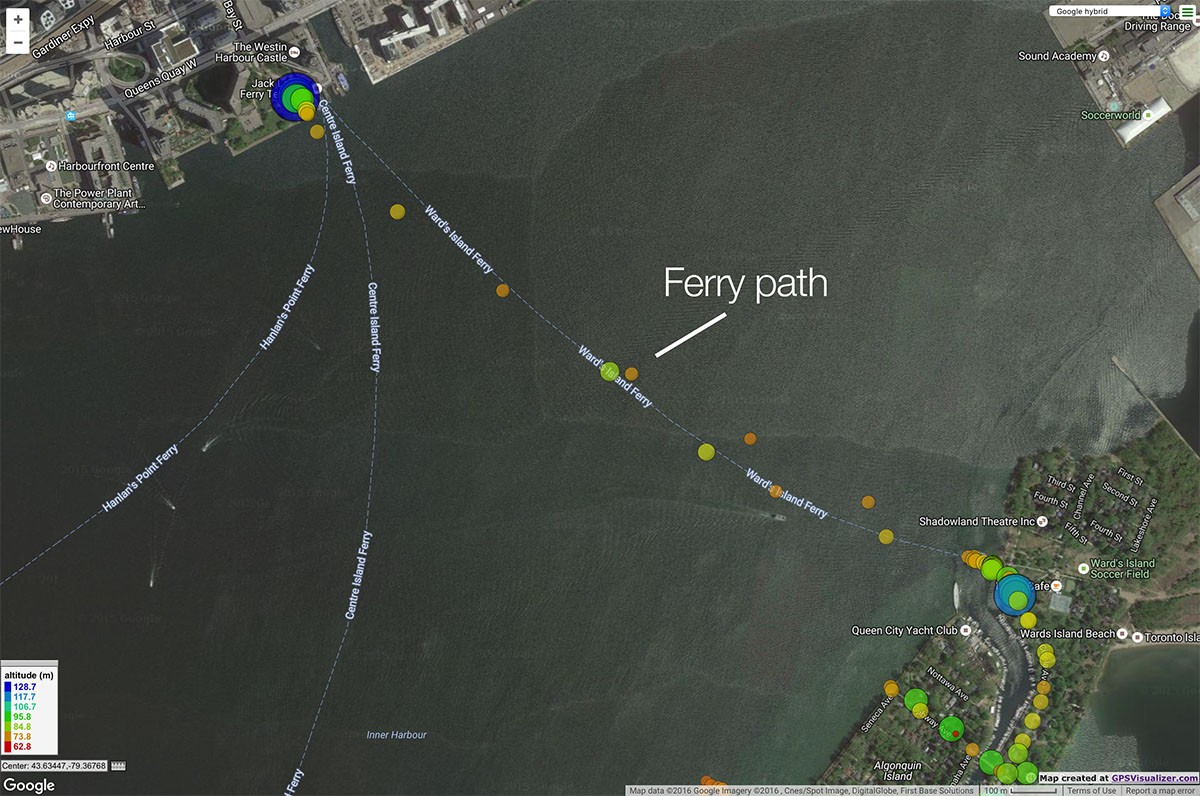
1. Ferry path
![]()
The spacing between the points represents how fast we were moving. Here you can see on the ferry to go from Toronto to the island, we were moving rapidly. Not surprising, the altitude remained roughly the same for the trip.
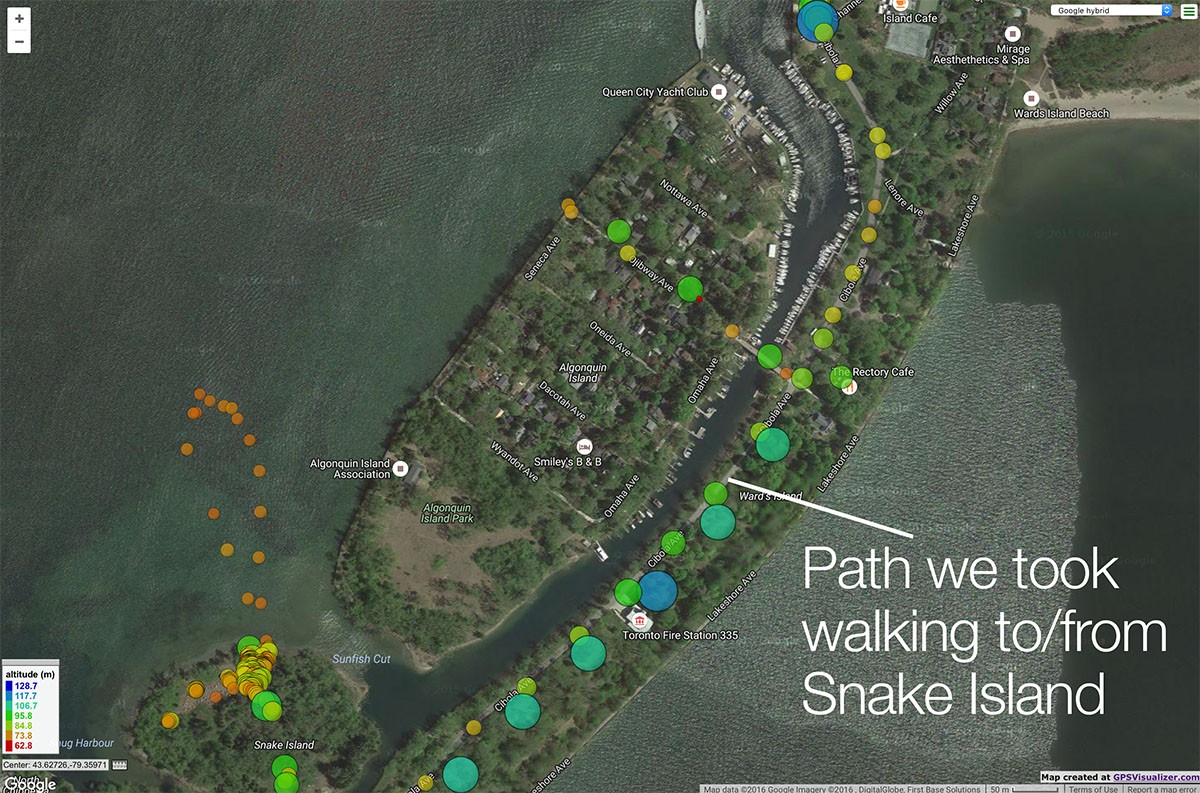
2. Walking path
![]()
Compare the ferry path to the walking path, and you can see we were moving slower. Along Cibola Ave, the elevation did increase!
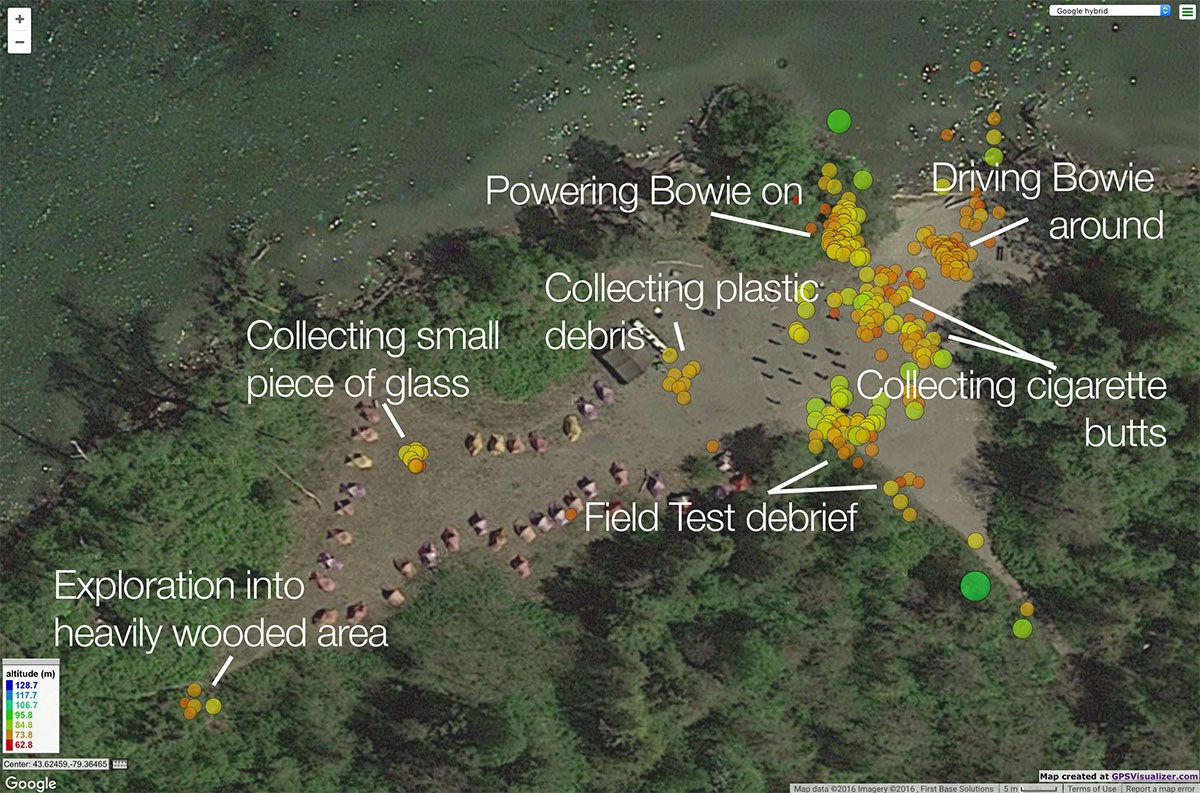
3. Snake Island Field Test area
![]()
Snake Island is where the Field Test took place. The first thing you see here, are all the clusters of areas that we were in. The areas where we were collecting debris were more concentrated as there was more time spent there testing the robot.
Being able to see these clusters gives a good idea of where we spent the most time. Which was on the beach near the water, where everyone at CASTAWAY was.
As for exploration into heavily wooded area - check out this project update for a video!
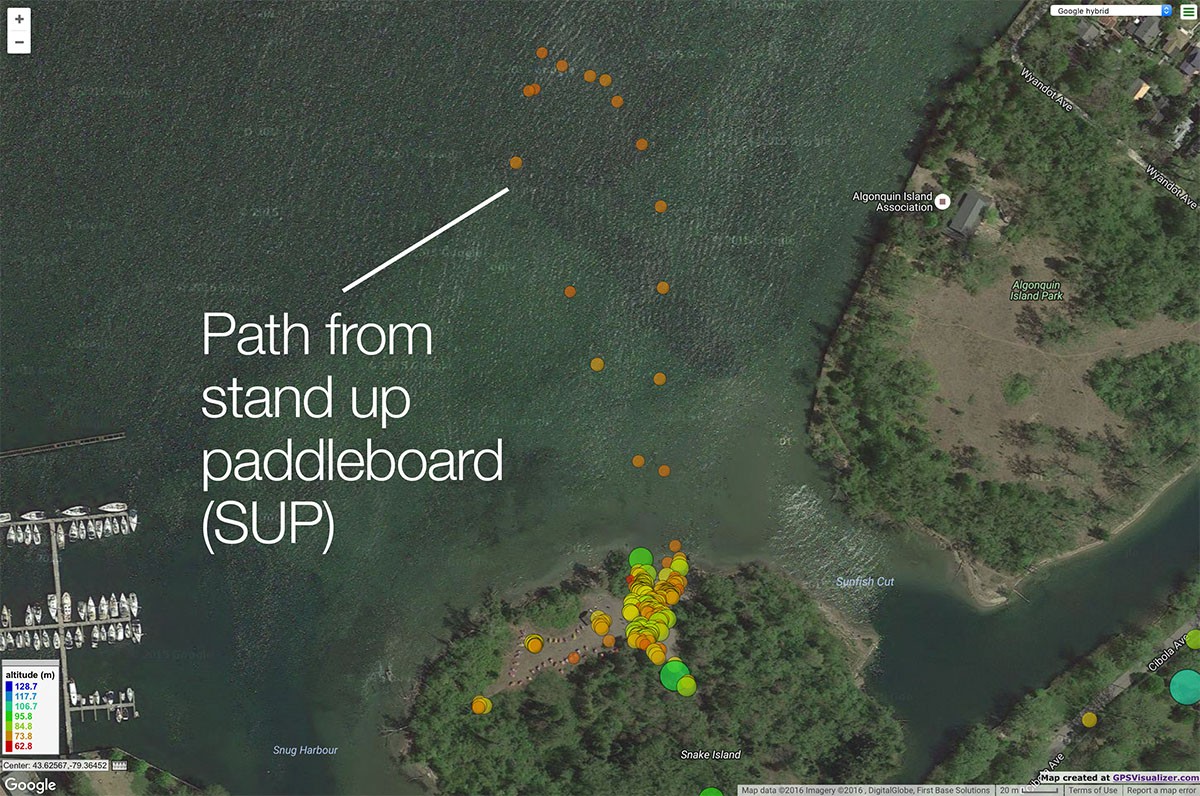
4. SUP path
![]()
We also took the GPS unit for a spin on the stand up paddleboards. Here was the path. It was surprising to see how small it was, as it seemed much longer and closer to Toronto mainland when we were out on the water!
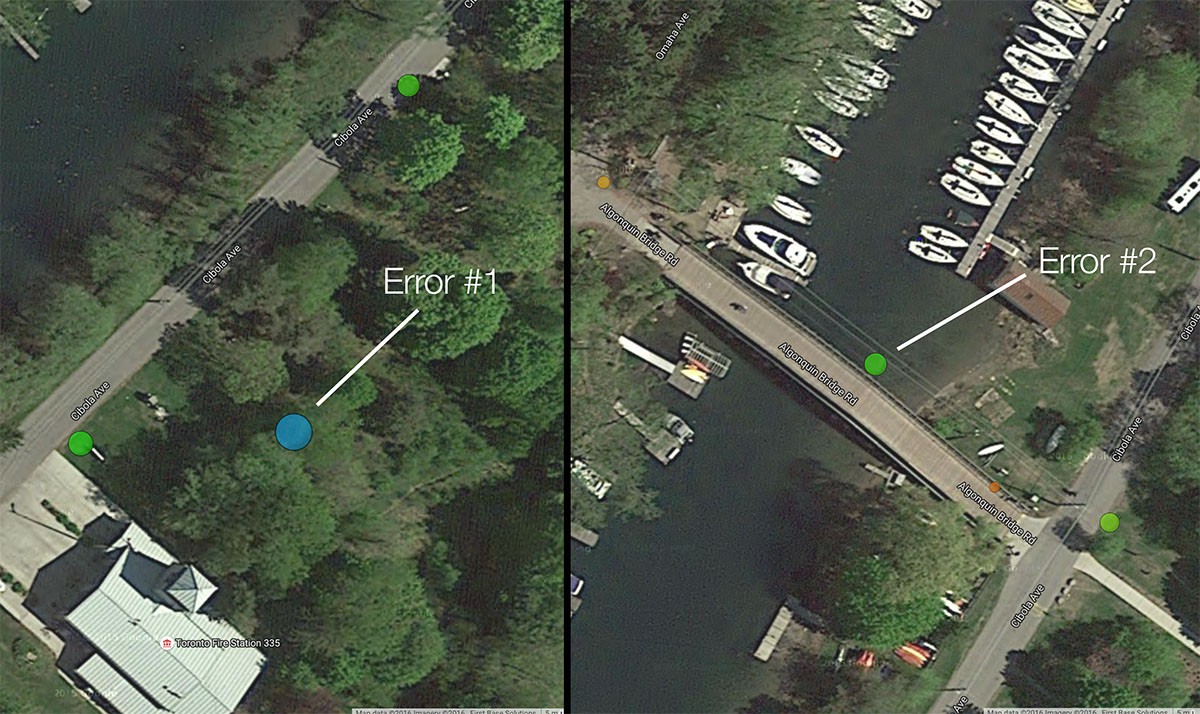
5. Errors
![]()
A key observation we wanted to make was how accurate the GPS is. For the most part, it seems pretty on spot. Here are two points where it was not. The one on the left - we didn't venture that far off of the road. The one on the right - we were on the bridge, and the point shows that we were in the water. However, the bridge was small, and so getting to the precision of being on it might not be feasible.
Outcomes
It was interesting to see the cluster areas where the robot was collecting debris. This will lead to better analytics about where debris is - and we can track changes over time to see any trends.
- Accuracy is much better than expected!
- Need a button to mark points of interest
- Indicate there is a fix with the satellites with an LED
- Indicate if battery level becoming low
- 1Hz sampling rate might be too frequent
- Using additional sensors for the colour or size of the bubble will lead to more insights
The next step is to improve the GPS unit, and make it communicate with the robot controller so that it will be able to navigate to a specific latitude and longitude using the compass. (If you've been following on social media, you might have been hearing about our progress with the magnetometer!)
Special thanks to Sam, Jeff, Fiona and Erin for helping with this Field Test!
-
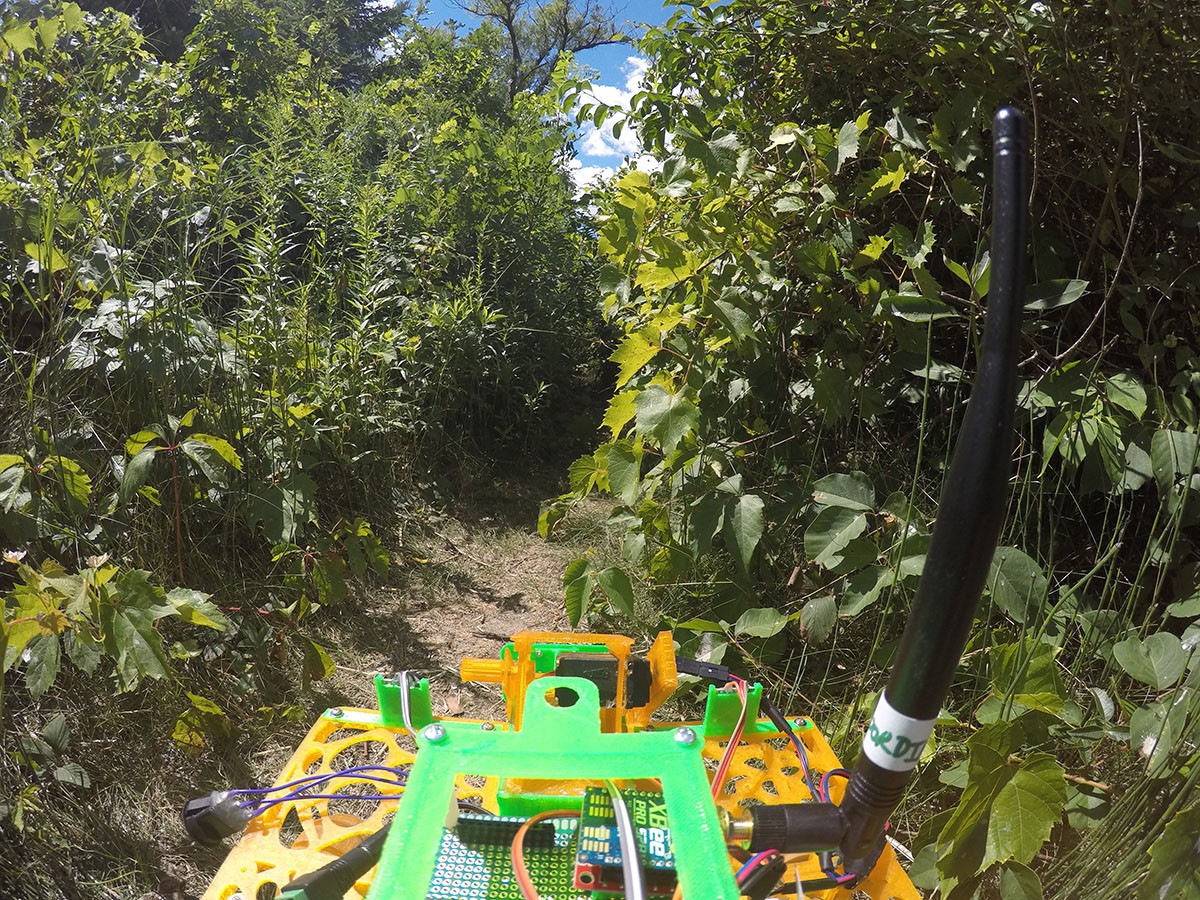
Mysteries remain on this path
08/17/2016 at 16:09 • 0 comments![]()
During the CASTAWAY Field Test, we came across a path that lead to somewhere, but we couldn't see where. This is the perfect opportunity for this robot to show us where it goes!
We set up the bot and operated it along the path. Watch it here:
Our adventure was cut short when the antenna on the Xbee snagged on one of the bushes, and thus severed the communications link. Shucks!
We'll make some improvements (ie, find a box that covers the electronics and antenna), and try this again.
Until then, whatever mysteries that remain on that path still have yet to be discovered
-
A family left behind their trash on the beach. Robot helps clean it up.
08/11/2016 at 01:43 • 0 commentsJust after finishing this Field Test, we noticed a family left behind their trash on the beach. Immediately seagulls flocked towards it and began ingesting it.
It is such a sad sight to see this happen.
We need to preserve our natural spaces. In addition to large debris, there's smaller debris left on our shorelines that has to be cleaned up.
Here we are operating the robot to drive towards the debris, lower the arm, tilt the end-effector (scooper), in order to collect the plastic bottle cap. (video)
It is our vision to improve the environment using this robot platform. This is the first step along that journey - and in the process, we are raising awareness to properly recycle your litter and leave a smaller footprint.
Robot Missions
Makers and Environmentalists collecting shoreline debris using a robot platform