Close
0%
0%

Open Source Spirometer using ESP32

An open source standalone spirometer (measures tidal volume) made using Olimex ESP32-POE-ISO and Sensirion SFM3300 Flow Sensor.

Similar projects worth following
The idea is to measure the volume taken into the lungs on a single breath and display the value. Normally a mechanical respiratory ventilator will control and display this information, but when splitting (AKA co-venting, MultiVenting), you don't have individual measurements for each patient. Nor do you have any standalone device that can measure it.

This device is one of many parallel efforts. I picked the fast track route with OTS components and minimal build. The goal is to start testing with something, ASAP. Anything we learn will be shared with the other projects in development.

Problem Statement:

COVID19 is and will exhaust the current inventory of mechanical ventilators. While new units are being made, the idea to split a ventilator or co-vent has been tested and approved by FDA under an EAU (emergency authorization use). 

The US posted this a few days ago: https://www.hhs.gov/sites/default/files/optimizing-ventilator-use-during-covid19-pandemic.pdf

This shows how it's possible, and approved in an emergency, to co-vent multiple patients. One of the challenges is making sure each patient has the right tidal volume at the right pressures. The ventilator, operating in pressure control mode, will control pressure and the breathing circuit and lung compliance will determine tidal volume into each set of lungs. But there is no method to easily measure individual tidal volume. 

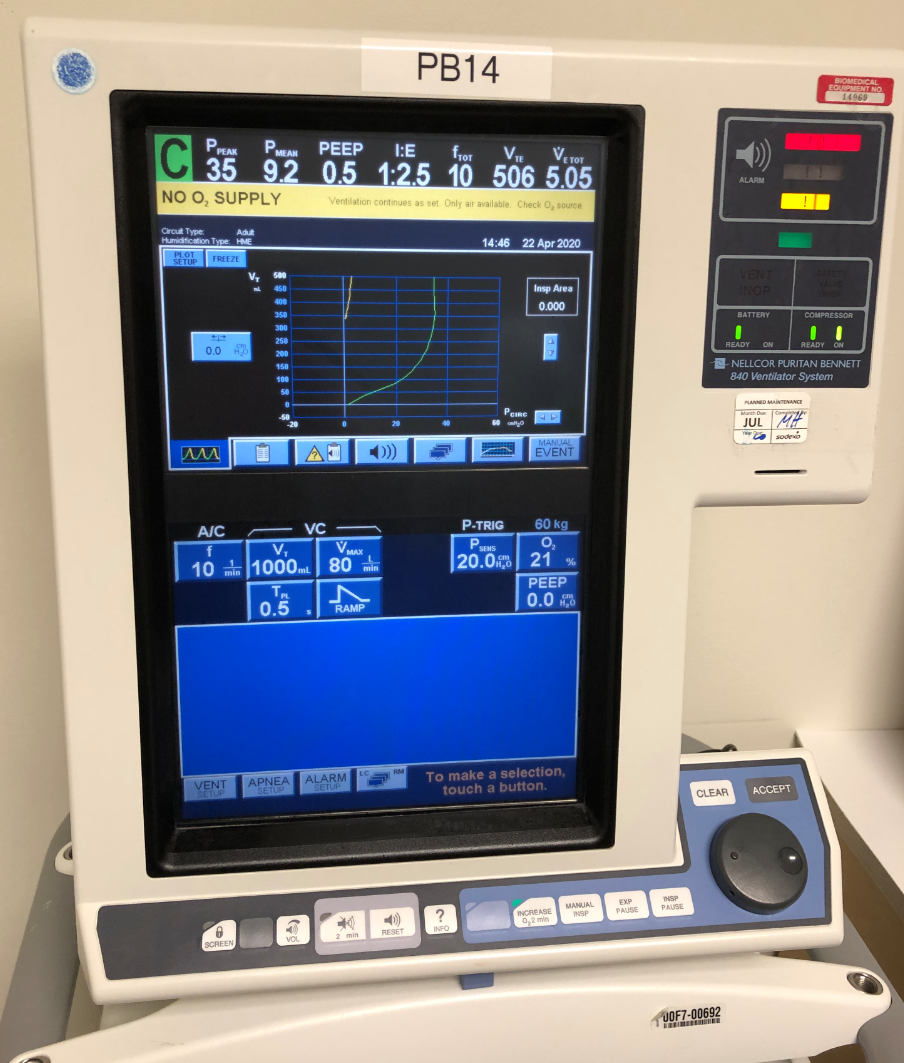
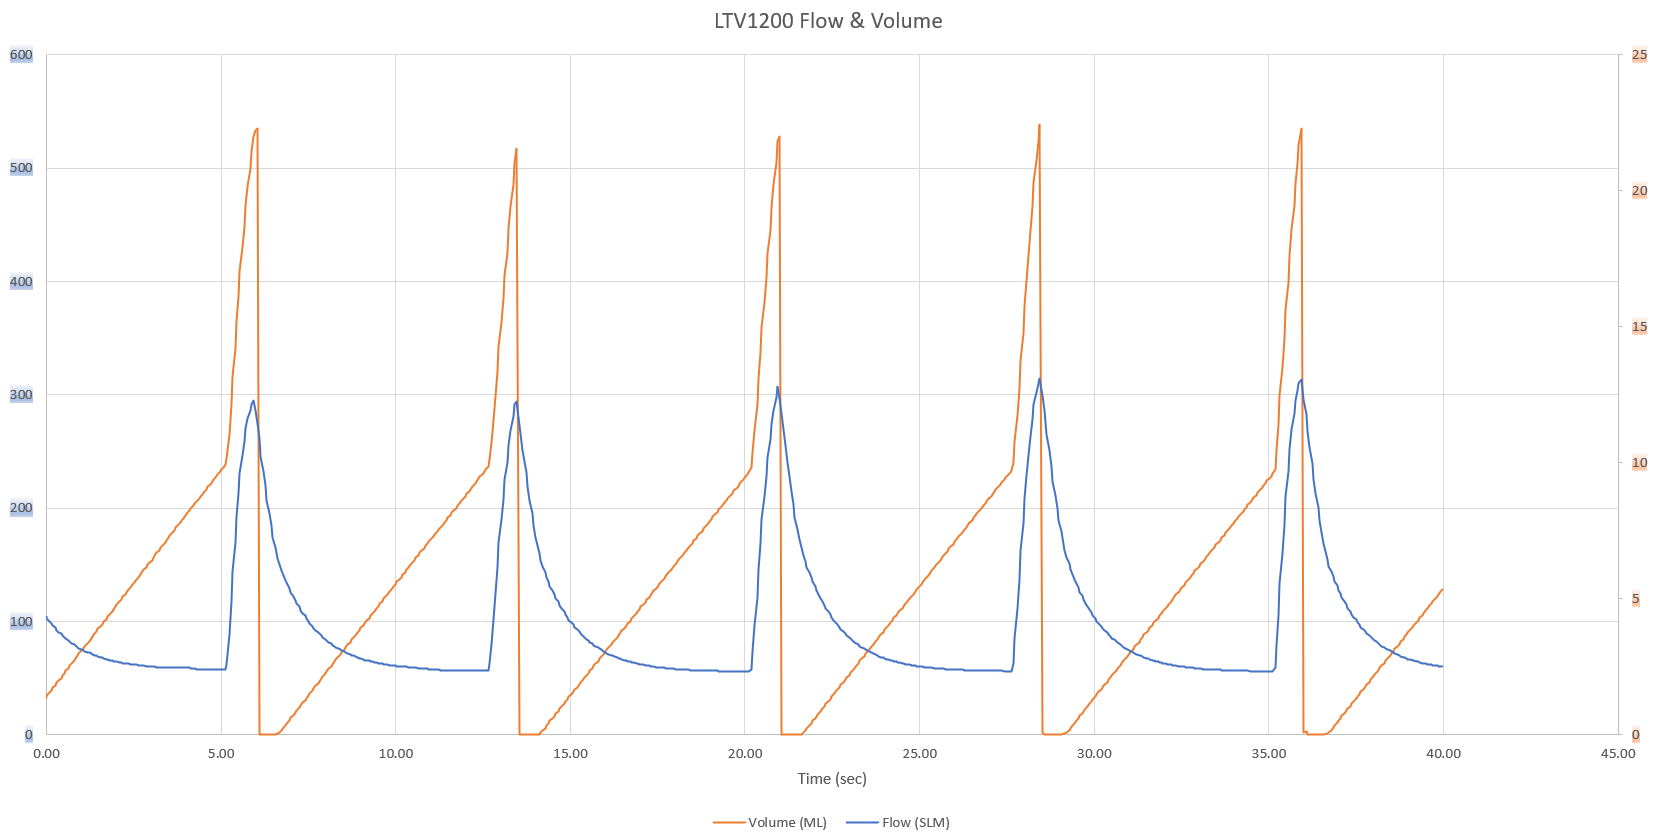
This chart shows typical pressure, flow and volume plots over time in seconds. The waveforms will be different for the settings on the ventilators and likely different for different manufacturers.

Aims:

My focus is to create a TV meter as fast as possible so we can start to test. I eliminated the constraints of measuring pressures, BOM cost, part availability and regulatory compliance so I could create a test device and share knowledge with others, who are working on a similar device that don't ignore these constraints. 

The final design, most likely someone's design, but possibly a fork of this design, will have pressure sensor for PIP & PEEP readout and buzzers and LED for alarms. 

There is no intention on using this device on actual people, we will be testing it in a local lung lab at a medical school. 

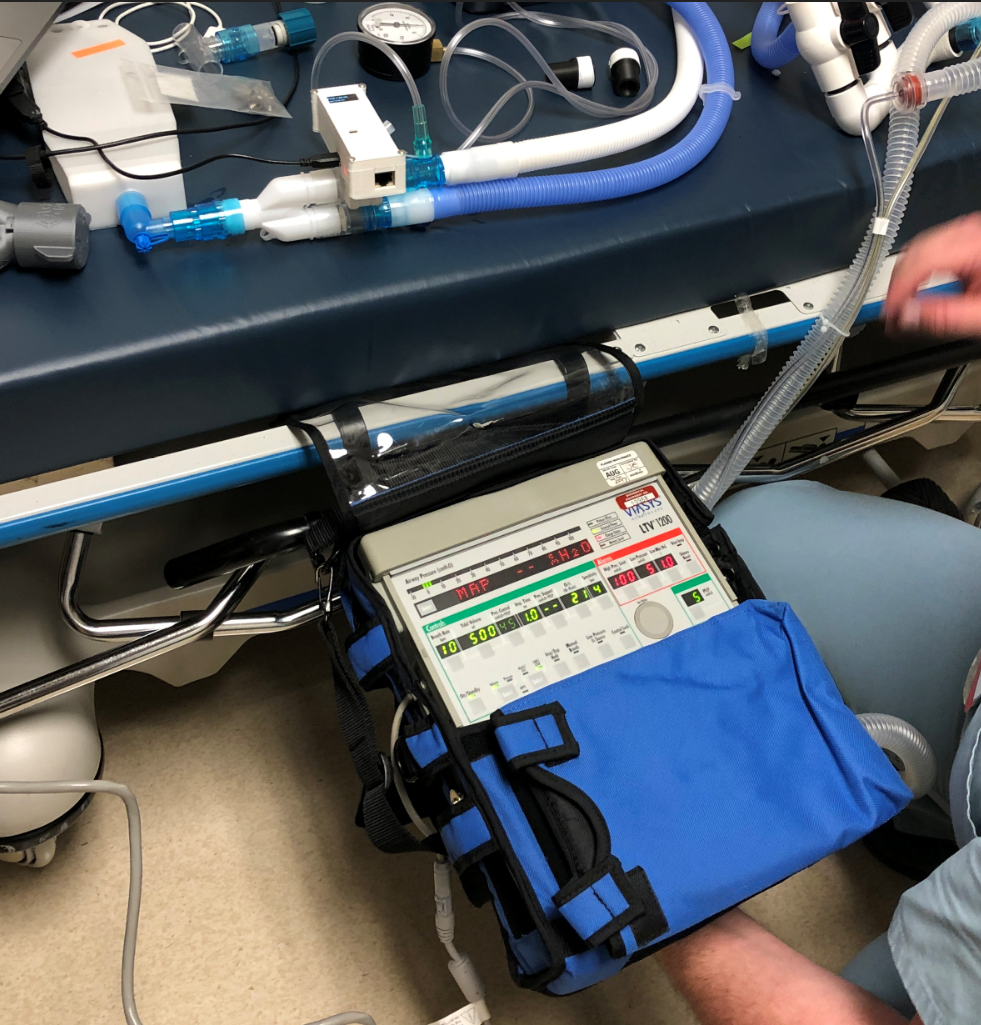
  • Testing with Viasys LTV1200 Ventilator

    Patrick04/27/2020 at 13:28 0 comments

    Up until now, much of our testing has been on a Nellcor Puritan Bennett 840 Ventilator. 

    The goal is to make sure whatever we build works with as many ventilators as possible. Having access to these devices is not easy and we're lucky to have support from medical professionals to provide access and their working knowledge of these systems. 

    The LTV1200 is  more of a portable unit, compared to what you would normally see in use in an ICU. As such, it has less features, or patient protections that an ICU ventilator would have. We tested it with the intention of confirming the ventilator splitting circuits would still work. 

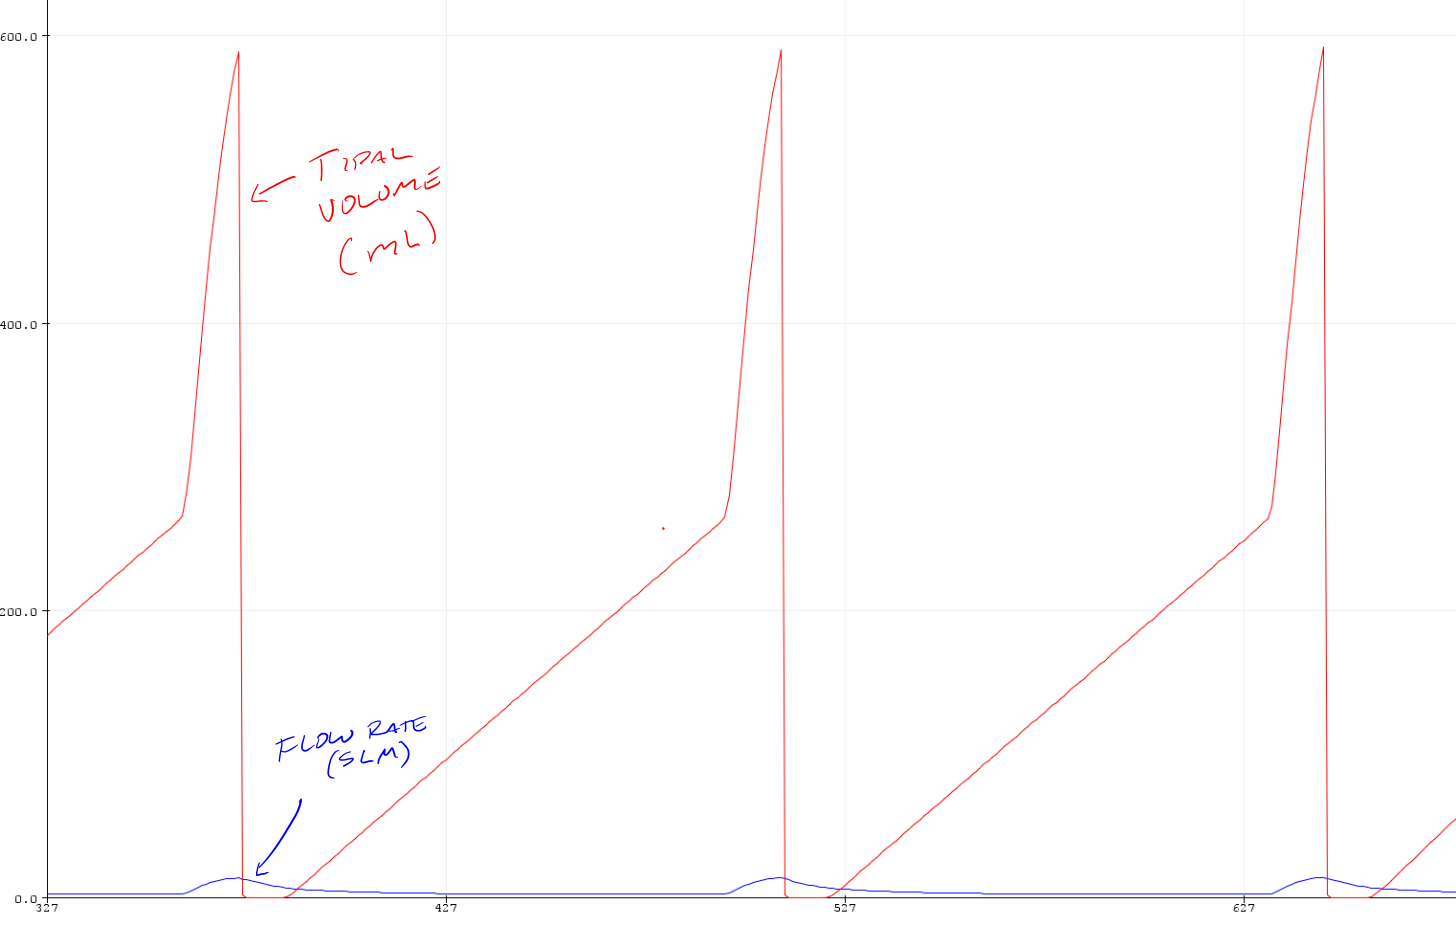
    One thing we learned was the tidal volume measurements were showing very large on my meters. We also noticed that air was always flowing in the breathing circuits. We think this is how the LTV1200 senses any occlusions. 

    Looking at the serial plotter, we see that the flow rate is not zero between breaths and tidal volume is accumulating when it shouldn't.

    Zooming in on the flow, there is a constant minimum flow that drops down to 2.4SLM, but not sharply. I'm likely not seeing a brief spike that goes to zero (or negative) for me to trigger my flow measurement to stop. 

    NOTE: I just realized I had my calibration smoothing code still in play, when I was trying to get smooth flowrate readings off my blower set to fixed rates. It's sampling at 1khz, averaging over 1000 points and plotting every only plotting every 50ms. This is accounting for the slow decay in the flow and needs to be removed for measuring flow waveforms.

    In our meter placement, we're measuring flow rate on the expiratory branch, just after the patient wye. The ventilator controls the flow and pressure in the breathing circuit. So to truly measure the tidal volume, we need to do one of the following

    • Move the flow meter between the wye and the patient, then it will see bidirectional flow and be a true indication of the flow. We are hoping not to do this, to avoid an extra cable running to the patient and concern of patient proximity to the meter (meter rubbing on face, meter getting disconnected)
    • Set the flow trigger to be a bit higher than 2.4SLM, which will result in less accurate tidal volume readings.
    • Add a pressure sensor, then trigger flow measurements when the pressure increases above minimum PEEP for most accurate readings.

  • Testing at USC Keck

    Patrick04/23/2020 at 20:27 0 comments

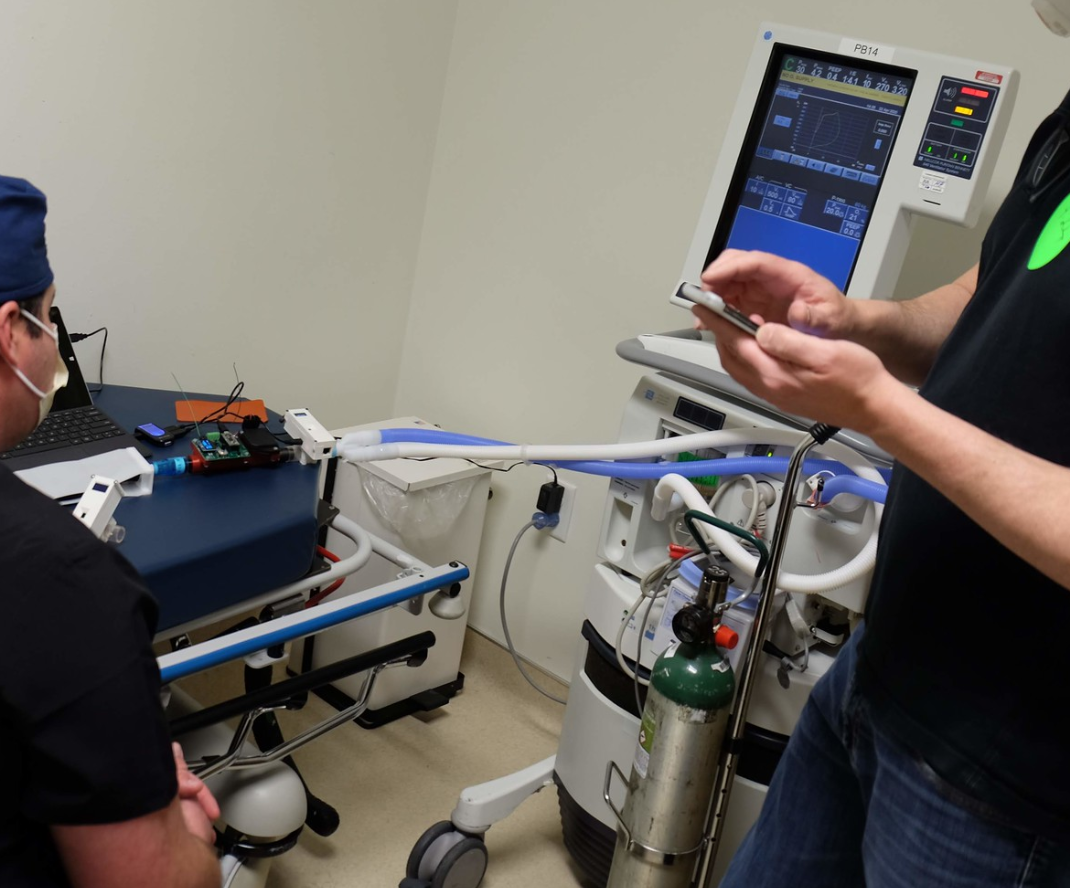
    Yesterday we had another opportunity to spend some time with a ventilator and do some testing.  The goal was to compare the ventilator readings to both my SFM3300 Fast Track Tidal Volume Meter and Thomas Hydronics' Automotive MAF Meter. 

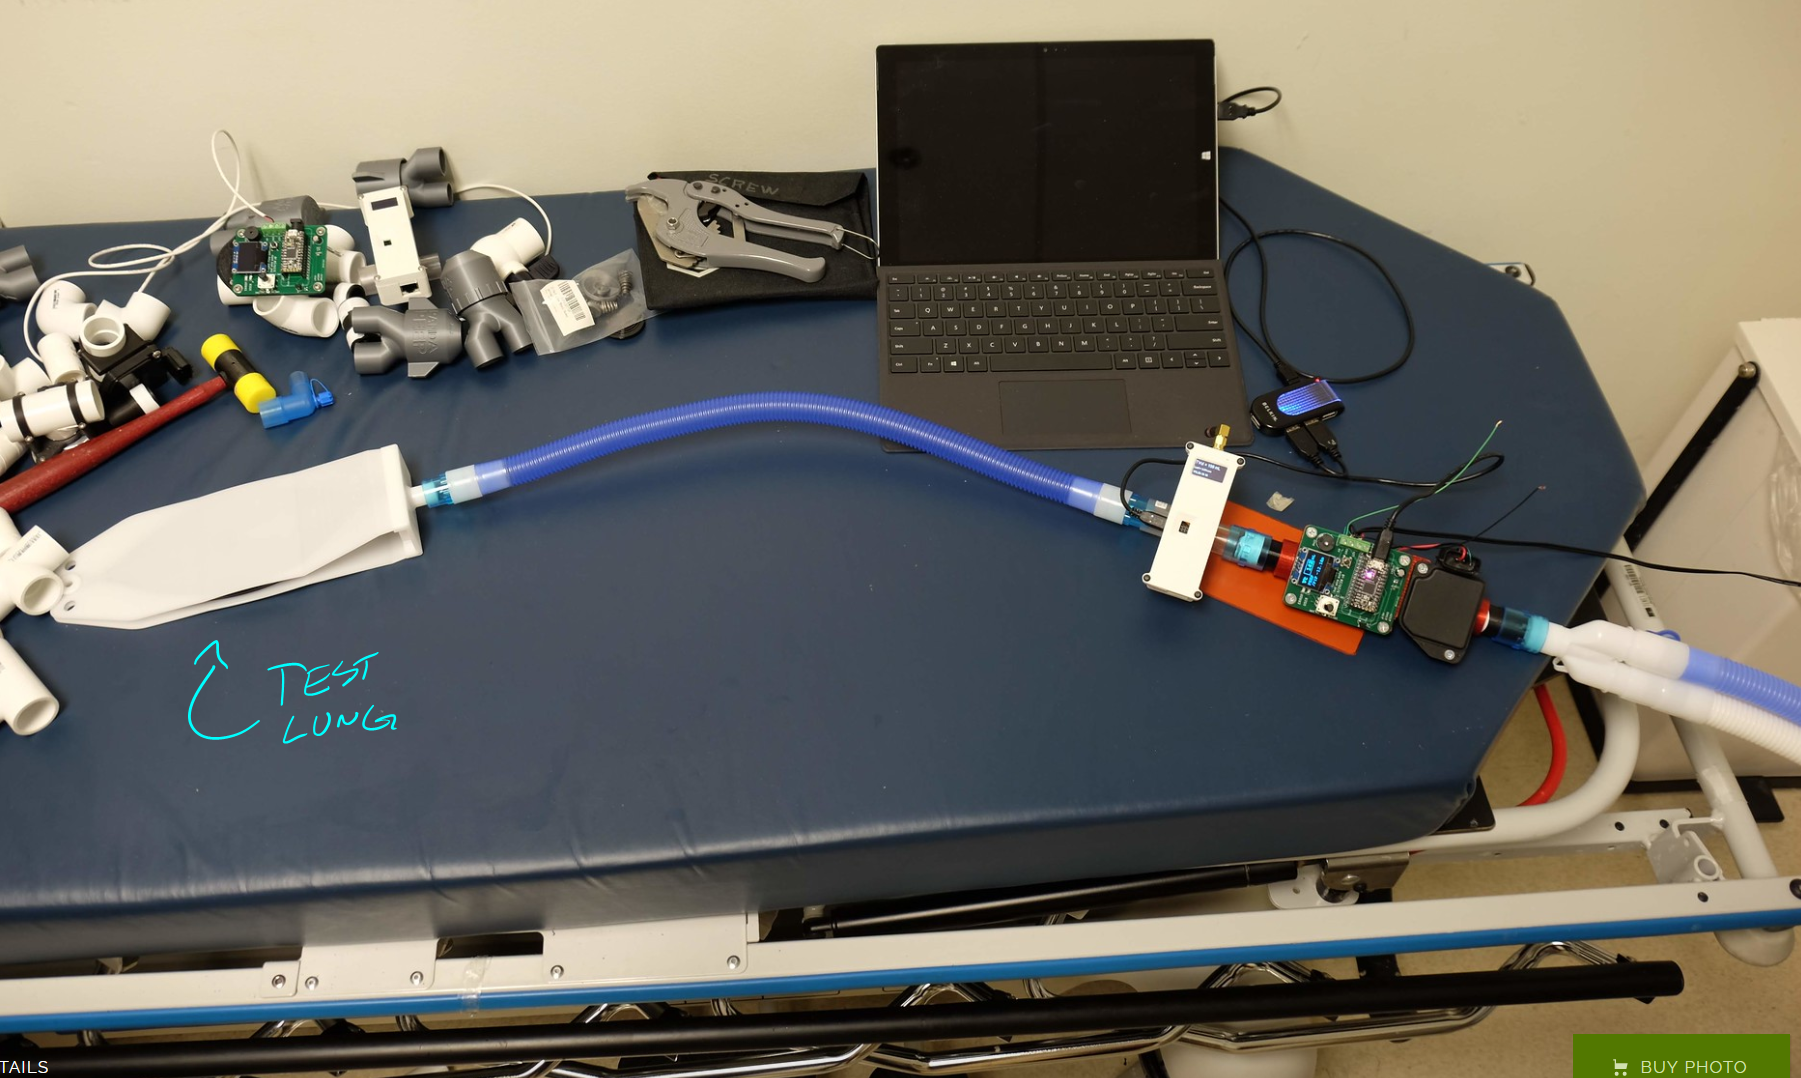
    Using a test lung, we simply added the meter inline. In this setup, the meters saw bi-directional airflow.

    Data was recorded on paper, taped to wall, using sharpie.


    2 setups were run, we changed the order of the meters. 

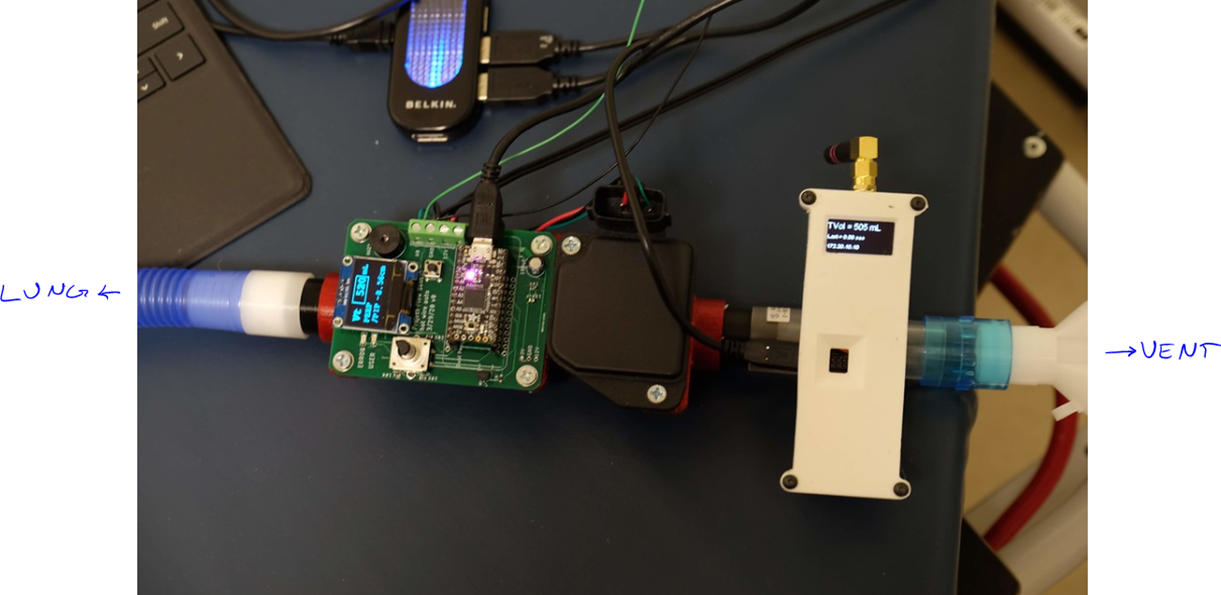
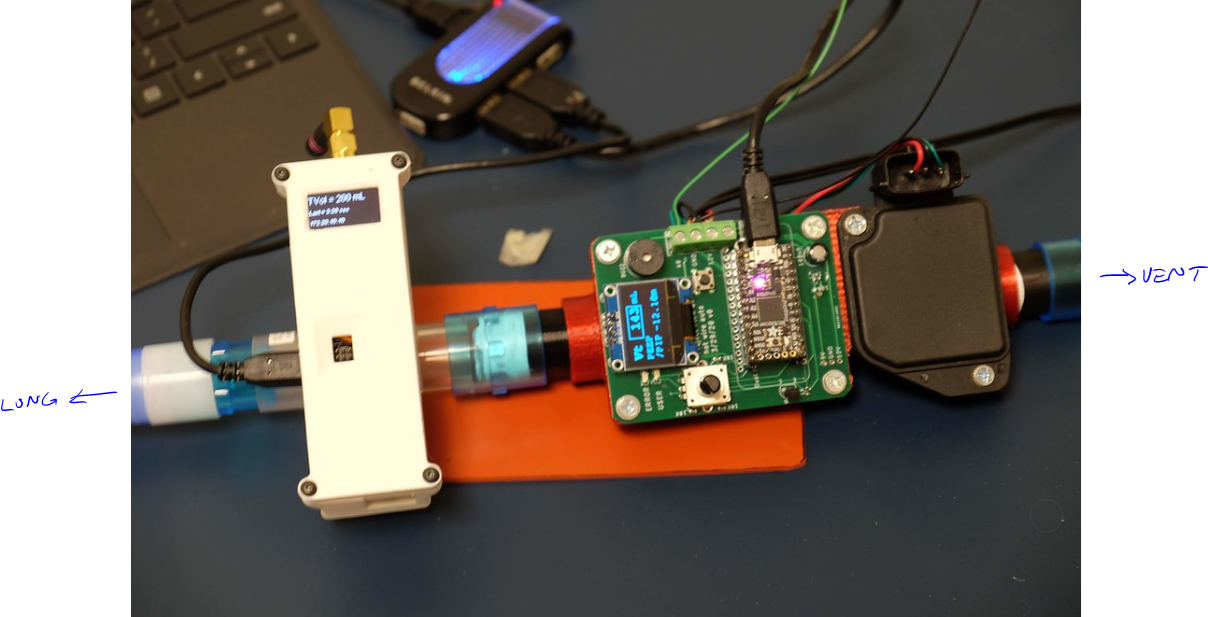
    Setup 1: Vent -> FTTVM -> MAF Meter -> Lung

    Both meters were seeing bidirectional flow and giving readings of expiratory flow (flow from lung back to vent)

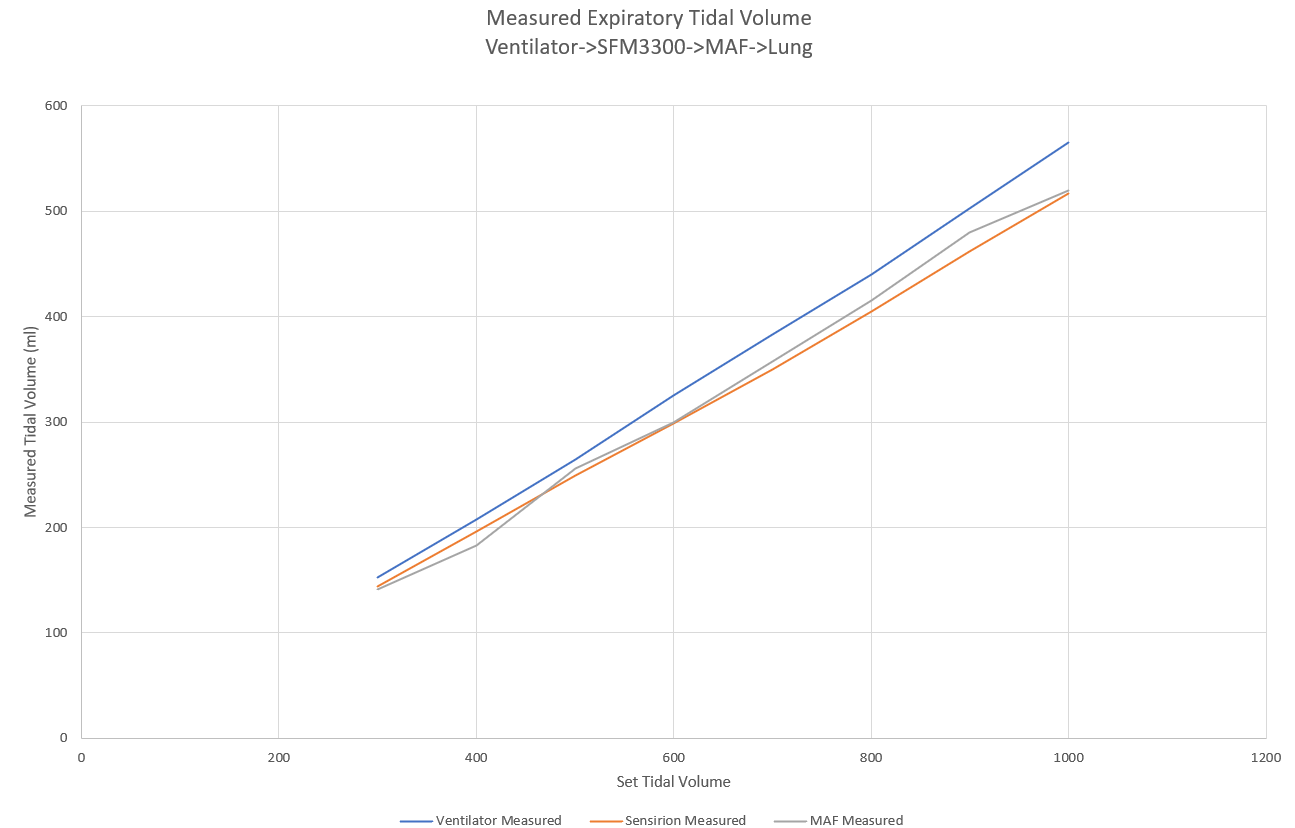
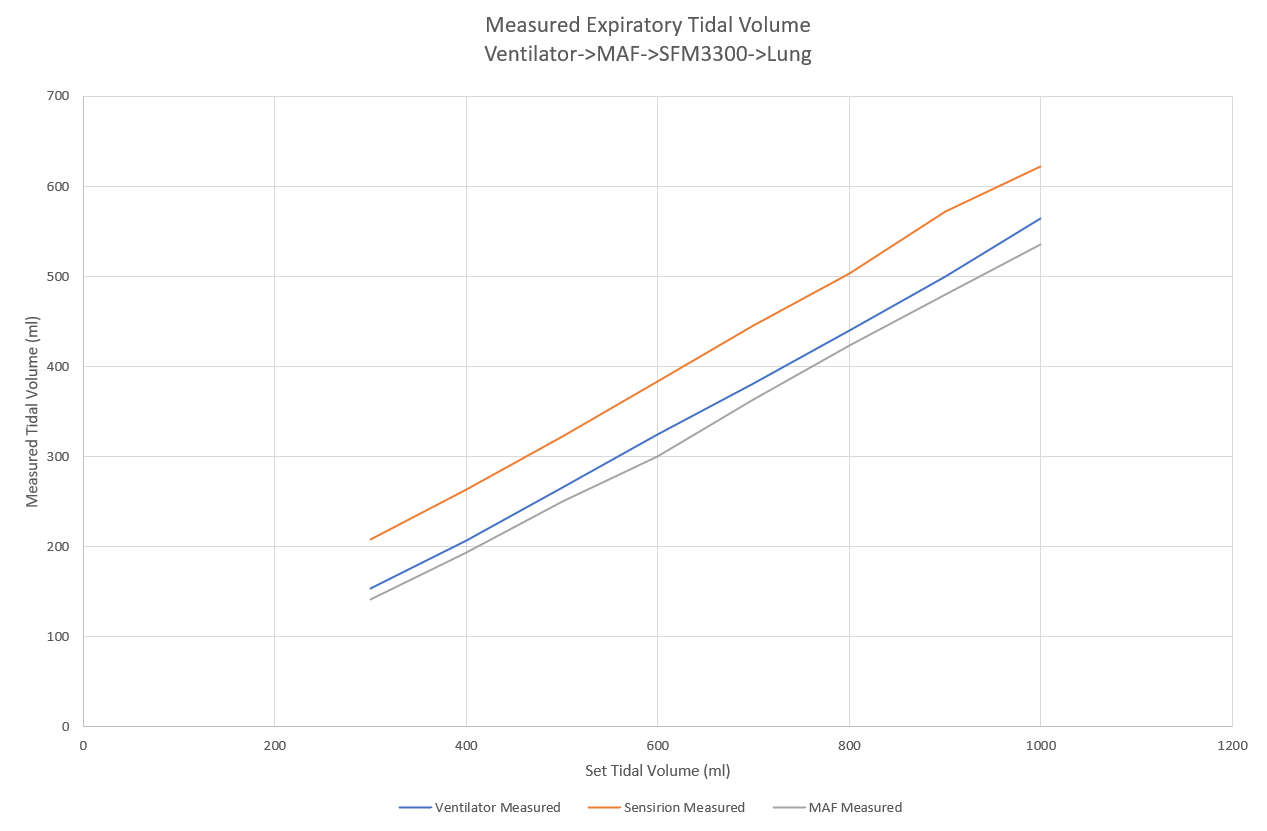
    Here you see the set point on the X axis and Y is actual values. Observations:

    • We ran the ventilator over a range of TVs (in increments of 100 ml) and recorded the actual measurements
    • The set point for TV is controlled by other factors (lung compliance, pressure limits, time limits on breath duration, etc). So actual tidal volume is more of a goal, but not a requirement. You rely on the ventiator's measured volume.
    • The SFM3300 Fast Track Tidal Volume Meter was measuring less, but also as the ml went up, it's error increased. Average error was -27.5ml.
    • The MAF meter was measuring less also, but error was more constant. The average error was -23.6ml. 

    Setup 2 - change the order of the sensors

    Here, the SFM3300 was giving higher readings. The MAF was less affected by this change. 

    • SFM3300 average error was +60.5ml
    • MAF average error was -18.6ml

    Conclusion:

    • By calibrating the MAF, we're able to create acceptable readings. 
    • Need to understand why the order of sensors changed the SFM3300's readings (laminar vs turbulent flow?) and why the MAF didn't really care. 

    Next steps:

    • Duplicate the MAF sensors and start to look at how multiple sensors compare to each other. 
    • Test the MAF under more variations of pressure & time
    • Look at what it would take to get the MAF to read above 100SLM
    • Finalize the MAF housing

    Thank you Daniel Stemen (USC) for his expertise and providing space to test and ventilators to test on.

    Thank you Catherine Yunis (USC) for performing the test, recording and taking photos & video. 

  • Using the Meter to calibrate automotive MAF

    Patrick04/21/2020 at 02:34 0 comments

    Seeing that the Sensirion meters have disappeared from stock and gone into long-leadtime mode, as expected, we had a parallel effort to develop flow meters using other sensors.

    Steve Glow stated working on a venturi design, check out his work here

    Thomas Hydronics started working on an automotive MAF, check out his work here

    Thomas sent me a couple of his sensors for test. The initial thought was to use the Sensirion sensor to calibrate the MAF.  That's what this update is all about.

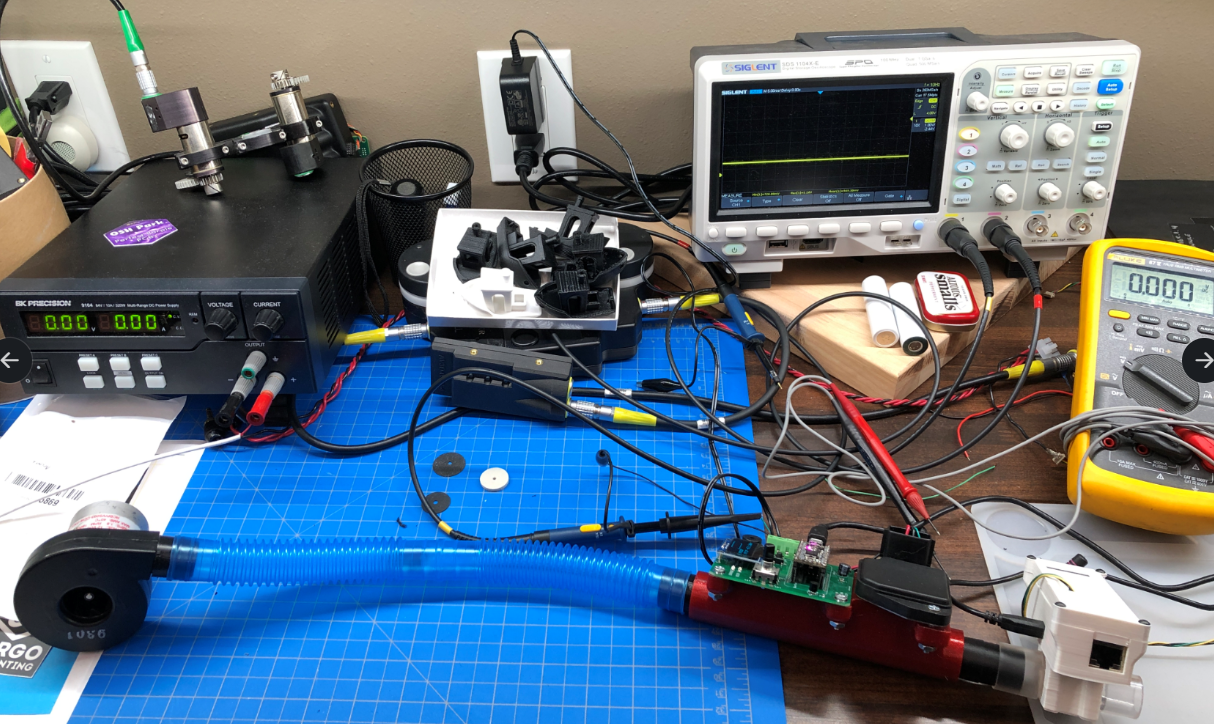
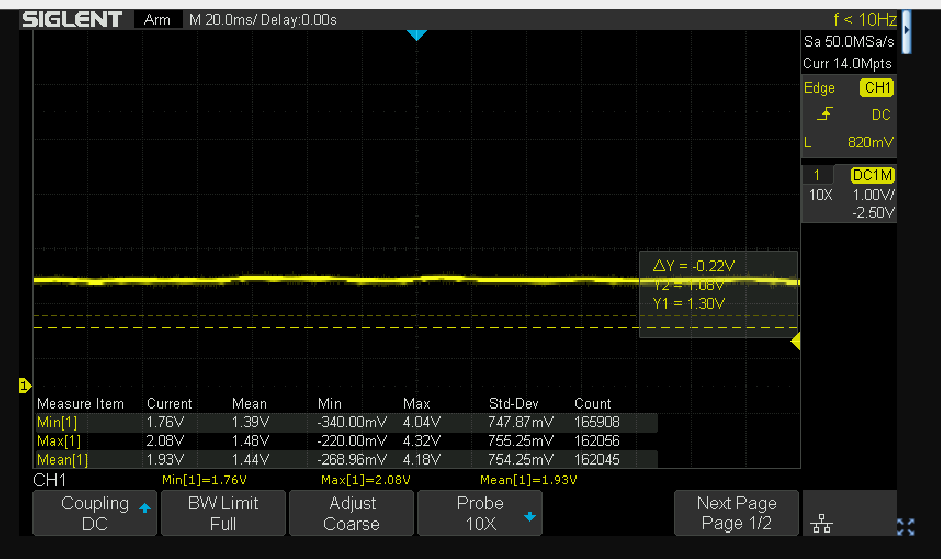
    Here is the test setup: BK Precision Power Supply driving an Ametek Microjammer Blower, MAF connected to Thomas's PCBA, inline with my ESP32 Sensirion SFM3300 meter, reading out average flow in SLM, voltage being read by Siglent SDS1104X-E Scope.

    The blower struggles under 4V, so I used a 3way valve to get readings below 30SLM. The MAF also outputs more than 3.3V, so for measurements, I removed the sensor output wire from the PCB and just connected it to the scope. 

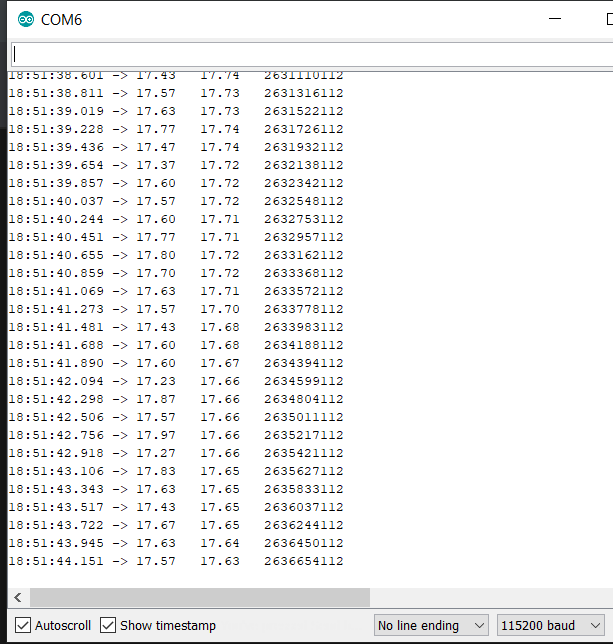
    The ESP code was streaming 2 flow values, one heavily averaged over 1000 readings, the other was latest  sensor value (updated to the serial port every 200ms) , and the time in microseconds. 

    I used the web connection to the scope to read the voltage. I was getting a bunch of noise on the analog output, so I took the Mean[1] reading from the scope as my voltage reading.

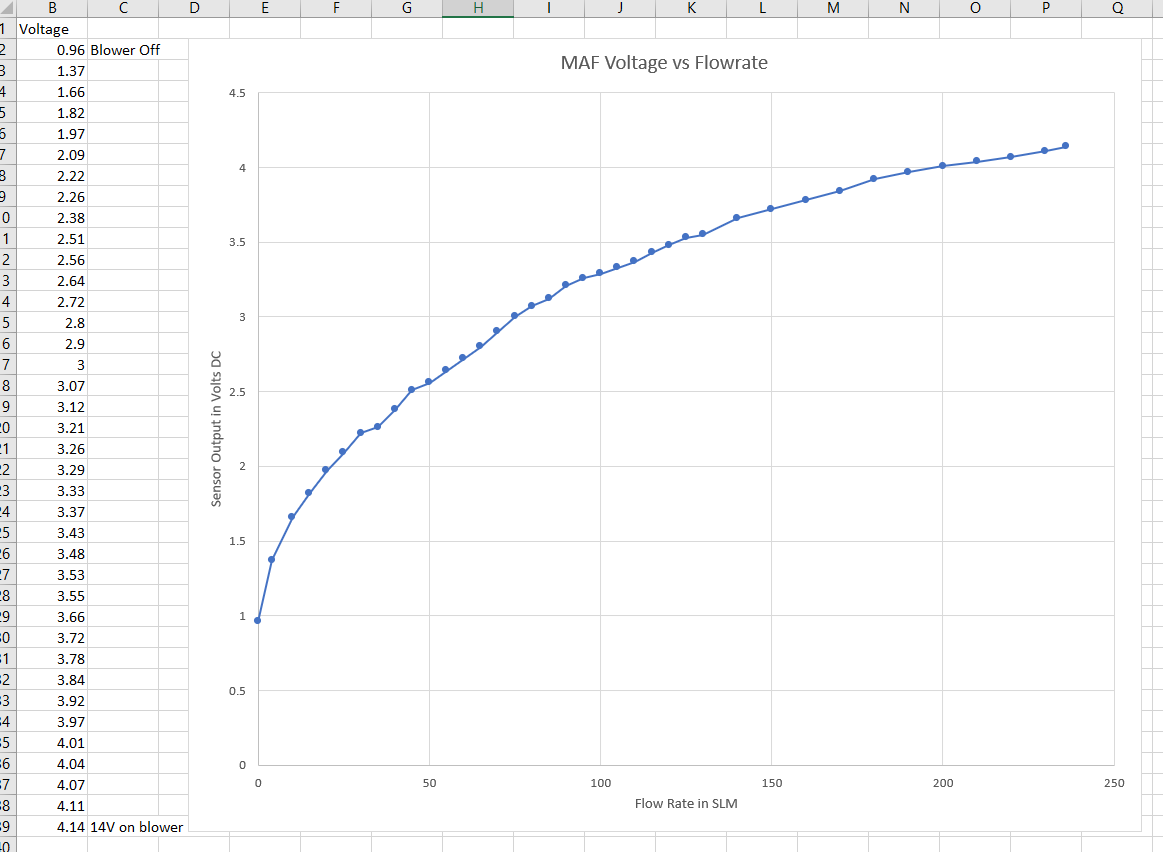
    Then I proceeded to adjust the voltage on the power supply until I hit the desired flow rates, and recorded the voltages. This resulted in this table and XY plot in excel. There are a few bumps in the data, which is due to the airflow data being a bit jumpy and noise on the analog output. 

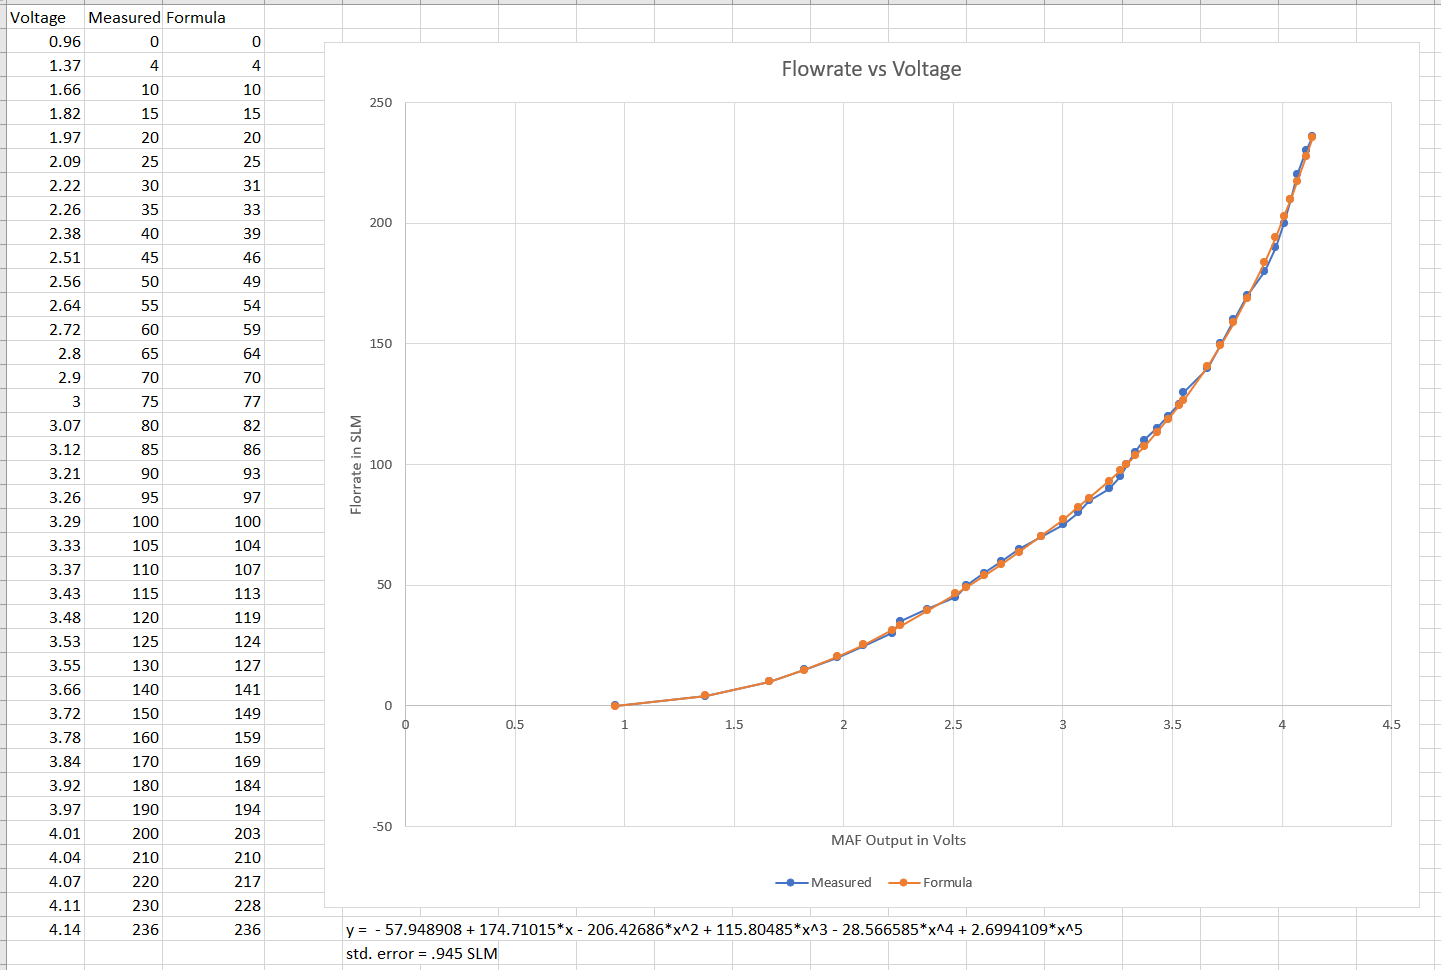
    Next I flipped the axis, as I want to calculate the flowrate based on voltage. Here, I found a 5th order polynomial that fit the data with a standard error of 1.945 SLM. 

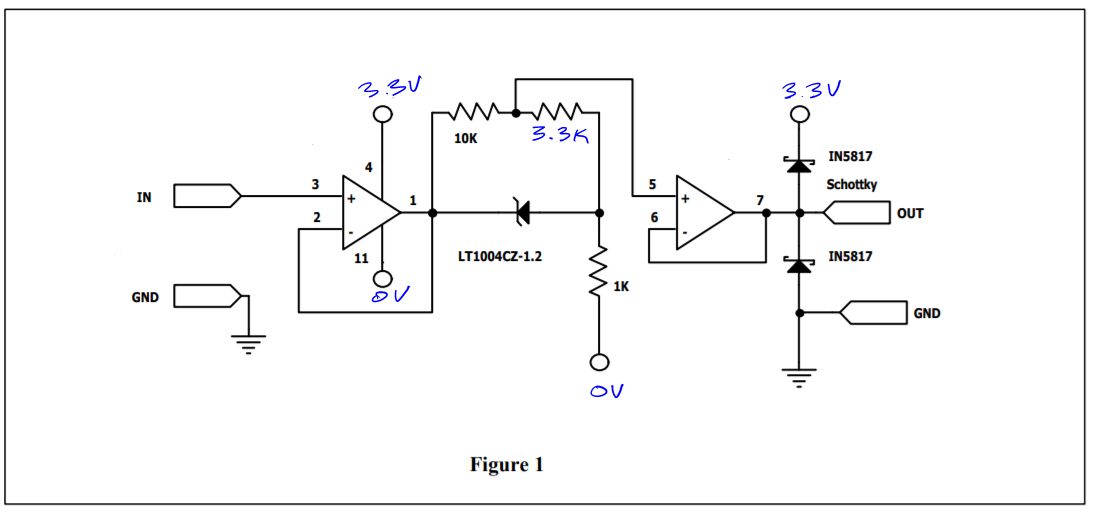
    Since the ADC has a range of 0 - 3.3V, (12 bits) and the sensor has a range of .96V to 4.15V (at one point I observed 4.15 V when overvolting the blower at 244SLM).  

    The sensor will require some signal conditioning if we want to be able to sense the full range and make use of all the available bits on the ADC. This can be accomplished with a .9V analog level shifter, something like this: 

    Being that the ADC can only handle up to 3.3V, I extracted a data set from 0-3.33, converted voltages to ADC values and then curve fit that.

    This resulted in a much cleaner polynomial with a standard error of 1.063 SLM. 

    int SLM = constrain(10.164294 - .021739655 * flowSensorValue + 1.0683699E-5 * sq(flowSensorValue),0,100);

  • Testing at UCLA / VA 4/4/2020

    Patrick04/08/2020 at 00:34 0 comments

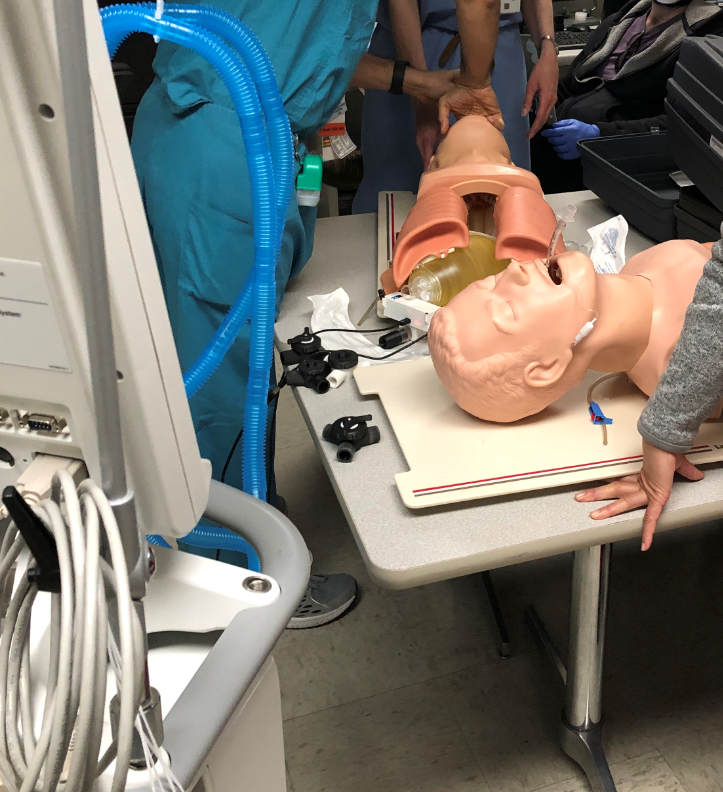
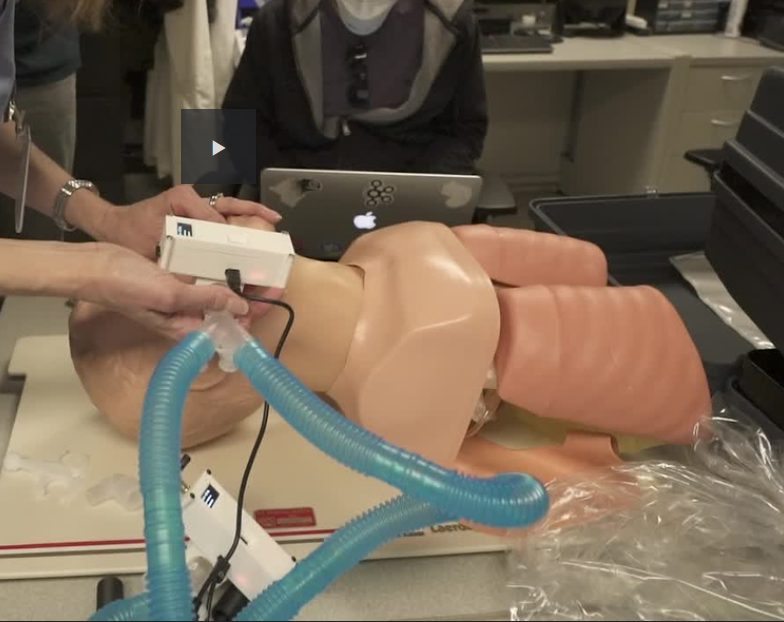
    We were able to test the FastTrackTidalVolumeMeter with a ventilator and 2 mannequins. 

    First, we compared the readings of the ventilator with each meter. The meters ready about 25mL less than the ventilator at 400mL, nobody was concerned with the discrepancy, so we moved on.

    Initially, we were deciding on where best the meter should live, at patient vs at the ventilator. And on the ventilator, we tried it on the expiratory flow and the inspiratory flow. We decided that best to have it on the expiratory branch so that if you have a leak, you might identify the leak condition faster. For most of the testing, we left it at the patient. Challenges there:

    • long power cable to patient, adds to the system complexity
    • ideally you are making flow adjustments while at the ventilator, so you need to be able to see the OLED
      • you can set tidal volume by adjusting the ventilator peak pressure, then dial down the individual flow by adjusting the flow control valve

    My notes from testing

    • A Meter are the patient is not desirable
      • meter resting/rubbing on patient's face is not good
      • meter power wire (USB) running to meter get tangles, possibly unplugged by patient movement
    • Meter at the ventilator is desirable. They need to look at tidal flow values as they adjust ventilator controls, standing at the ventilator
    • Meter at ventilator will only see flow in 1 direction
    • If meter is on the inspiratory flow, it won't see contaminated air
    • Doctor preference was meter on the expiratory flow, to determine any upstream leaks
    • Doctor wants to see a single device instead of individual units. Can be individual displays for each flow
    • Operating the ventilator in volume control mode didn't really work. The control loop got a bit confused with the split breathing circuit
    • Operating the ventilator in pressure control mode worked very well. This is recommended by others.
    • Ventiltator Peak Inspiratory Pressure (PIP) can be adjusted and control the tidal volume for everyone
    • A simple flow restriction adjustment is needed to control the tidal volume on the individual. This can be manual. We tested with 3D printed 3 way valve with some success
    • Doctors don't really care about PIP & PEEP, as the readout on the ventilator will apply to everyone
      • Unless we give them the ability to adjust PEEP on the individual circuit, then PEEP readout would be needed
    • The other individual adjustment they would like to have is FIO2, which is %oxygen to each individual. Not sure how to deliver extra O2, so measuring it is not needed if you can't control it. Likely, everyone would be on same O2 %.
    • Humidity, not required, as ventilator will set that and display it for everyone
    • Need to pay attention to 22mm male and female connections. Everything I brought had male 22mm (22M) and we needed a handful of female to female couplers (22F-22F). They did not have a supply of these and had to open up "kits" just to get one coupler. This is very wasteful as now the kit is unusable. Once unsealed, it's not able to be re-sterilized and reused. And useless since the coupler was missing.
    • FDM 3D printed ISO ports/connectors should be only done vertically. Printing them horizontal will probably leak. The 3 way valve needs to be redesigned so ports are printed vertical.
    • The conical 3 way valve leaked and started to vibrate (very noisy) as the flow was restricted down.
    • Our mannequins were side by side and we had access above them. Usually, they will be in beds, up against the wall. The ventilator attaches to the wall to get supply of fresh air and O2. ICU room layout will never be as good as we had it. Splitting 2 ways is easy, just put the ventilator between the 2 beds along the wall. Going beyond that will require some thought about breathing tube routing

  • Software

    Patrick04/04/2020 at 00:59 0 comments

    Starting with an Olimex ESP32-POE-ISO on hand for a different project, I started prototyping around that. I already had a test board, which broke out the i2c for OLED, CANBUS and RS232 for 2nd serial port. 

    Since I had the pins available, used dual i2c, one for OLED (using SSD1306 library) and one for sensor.

    The SFM3300 had some reference code that I borrowed from here. The CRC-8 function did not work, but I managed to fix that. 

    //CRC
    #define POLYNOMIAL 0x131 //P(x)=x^8+x^5+x^4+1 = 100110001
    
    uint8_t crc8(uint8_t data[], uint8_t nbrOfBytes)  {
      uint8_t crc = 0;
      uint8_t byteCtr;
      //calculates 8-Bit checksum with given polynomial
      for (byteCtr = 0; byteCtr < nbrOfBytes; ++byteCtr) { 
        crc ^= (data[byteCtr]);
        for (uint8_t bit = 8; bit > 0; --bit) { 
          if (crc & 0x80) {
            crc = (crc << 1) ^ POLYNOMIAL;
          }
          else {
            crc = (crc << 1);
          }
        }
      }
      return crc;
    } 

    This sensor outputs in liters per minute, and has a max range of ±250 l/min.

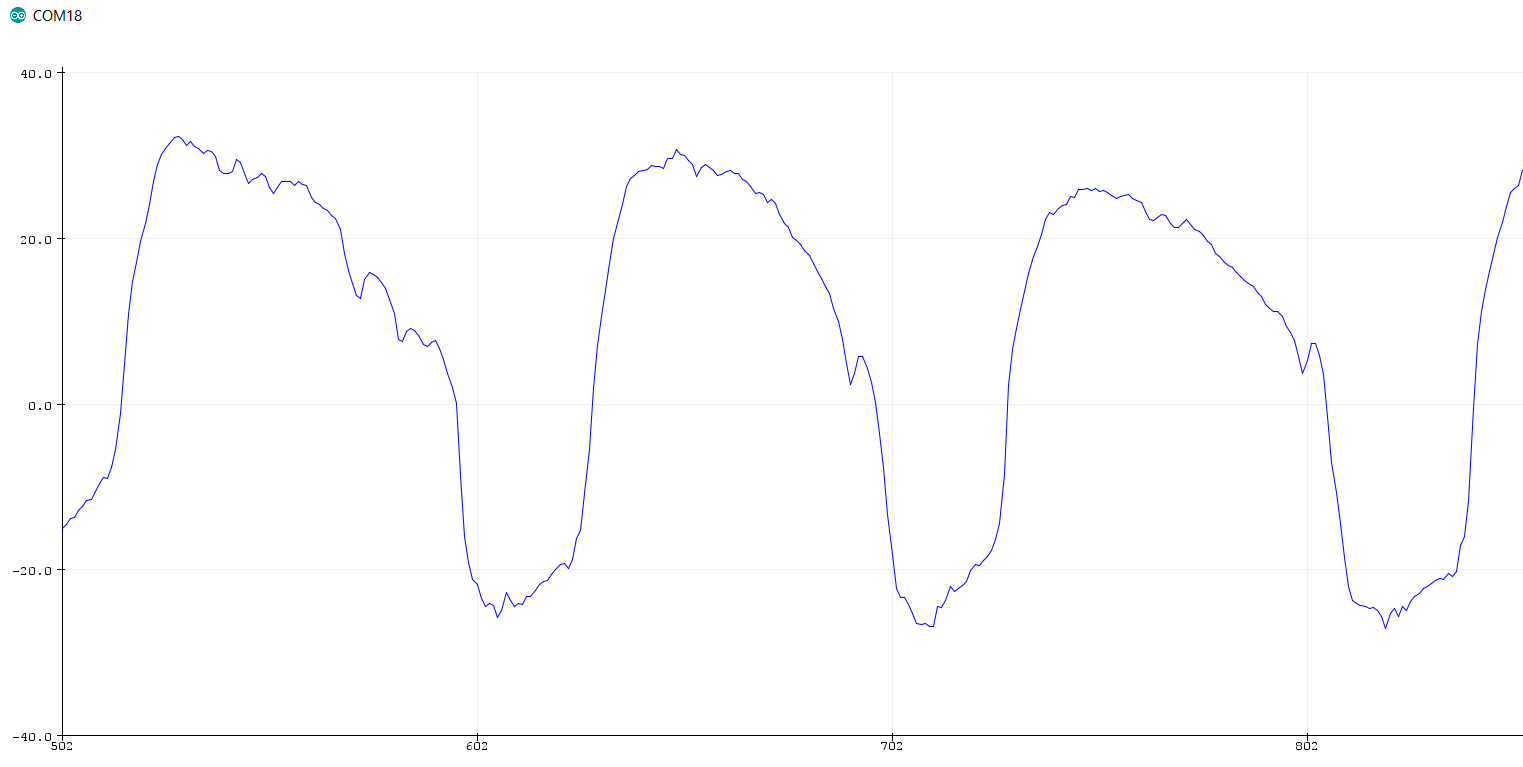
    The above is me breathing into the sensor, inhales are positive, exhales are negative. In discussions with doctors, this device might be placed at the patient, where it will see bidirectional flow like this. Or it could be on the inspiratory or expiratory branch of the breathing circuit, in which case, flow will only be in one direction. 

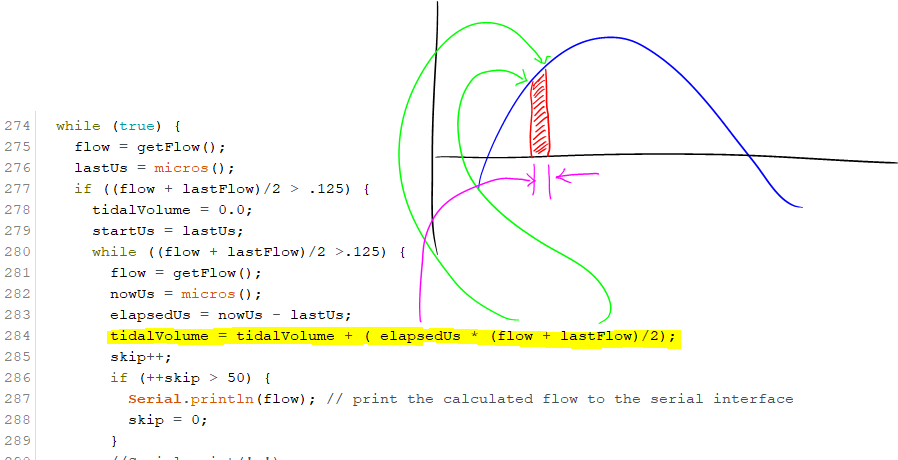
    Inside the loop function, I'm looking for positive flow. When I see 2 readings average above .125l/min, I start the measurement. Basically I'm using the timers in microseconds (µs) to determine elapsed time. Then I average the current measurement with the last and multiply it by the elapsed time. Which is about 1ms. Probably way overkill, but it's my starting point. Every 50ms, I'm shooting the value out the serial port on USB so I can plot it. 

          tidalVolume = tidalVolume / 60000; // volume in mL (factor out microsec & minutes)
          if (tidalVolume > 10.0) {
            lastTidalVolume = tidalVolume;
            lastMilliSec = millis();
            hwSerial.print("Duration = ");
            hwSerial.println((double)(lastUs - startUs)/1000000);
            hwSerial.print("TidalVolume = ");
            hwSerial.println(lastTidalVolume);
            sTidalVolume = String(tidalVolume,0);
            updateDisplay(double(millis() - lastMilliSec)/1000.0);
          }

    When the flow drops down to zero, calculate the tidal volume in mL, by factoring in liters per minute and my microseconds. Code is a bit sloppy here, I know I should be using constants.

    I check it to see if it's a real value, a setpoint of 10 is my current minimum breath value. This filters out the noise if the device is just sitting there with no breath.  I also update the display with the tidal volume. And start keeping track of how long it's been since last breath. 

    The rest of the code is pretty self-explanatory. I borrowed some stuff for the WiFi from https://randomnerdtutorials.com/

    Besides a bit of code cleanup, code is functionally RTG.

  • The build

    Patrick04/03/2020 at 22:59 0 comments

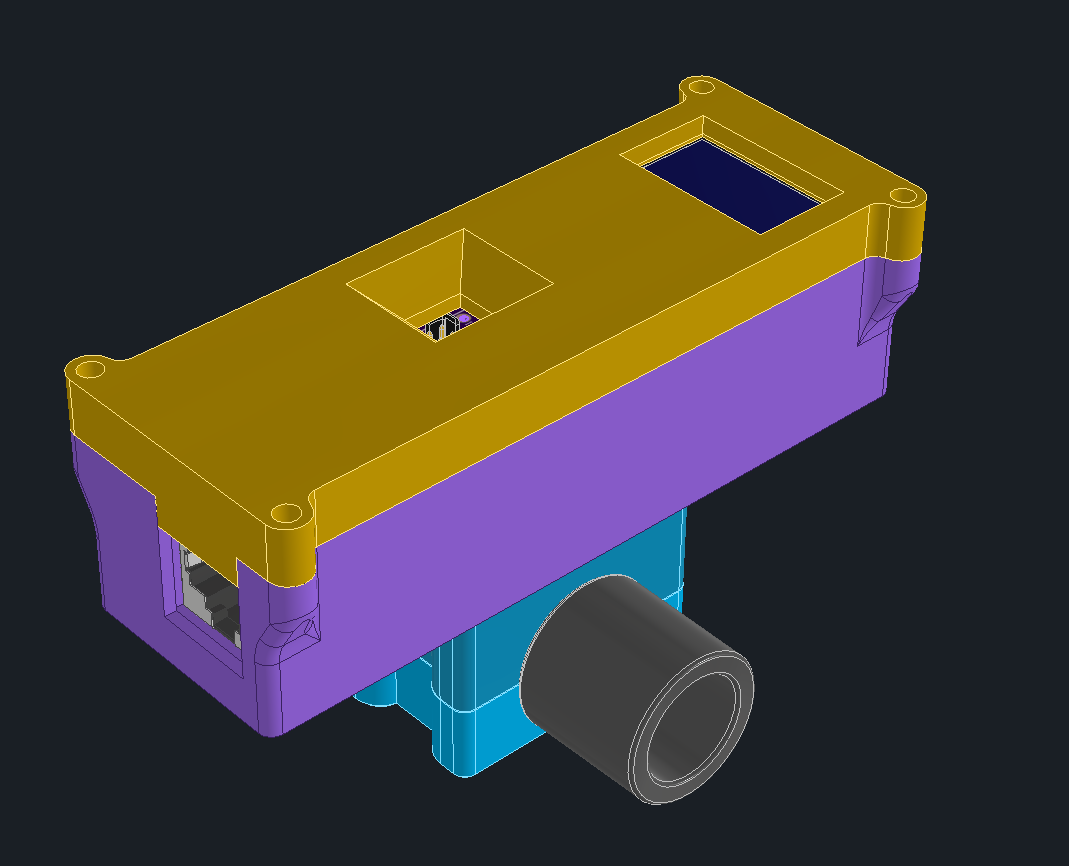
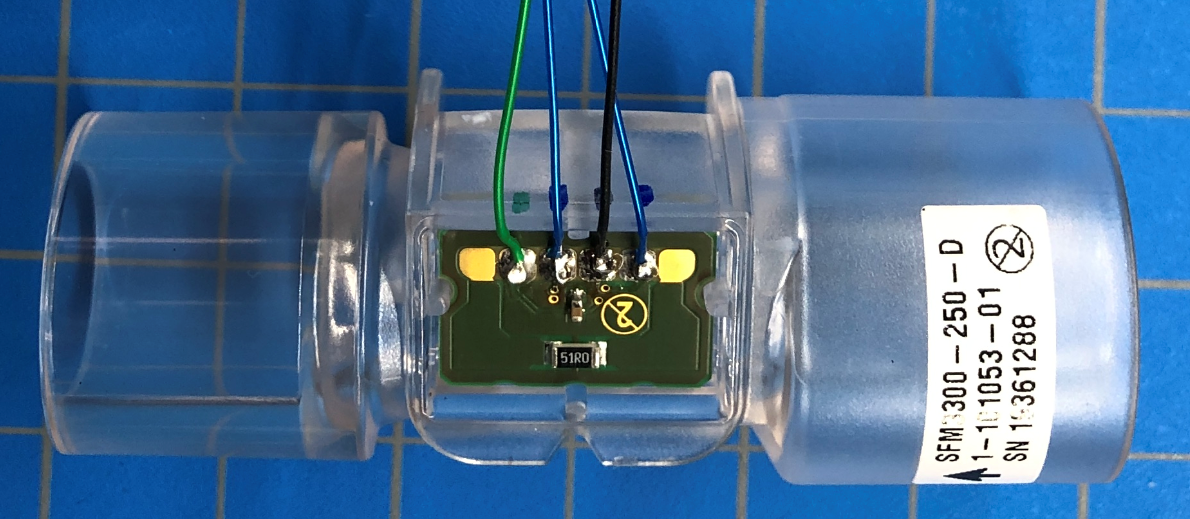
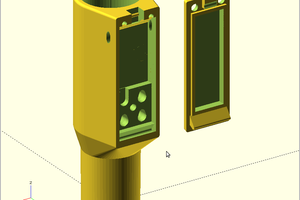
    The design is 4 parts, 3D printed to enclose the electronics and mount the sensors

    The parts are printed using Markforged White Nylon. Parts are tapped and screwed together with #4-40 hardware. 

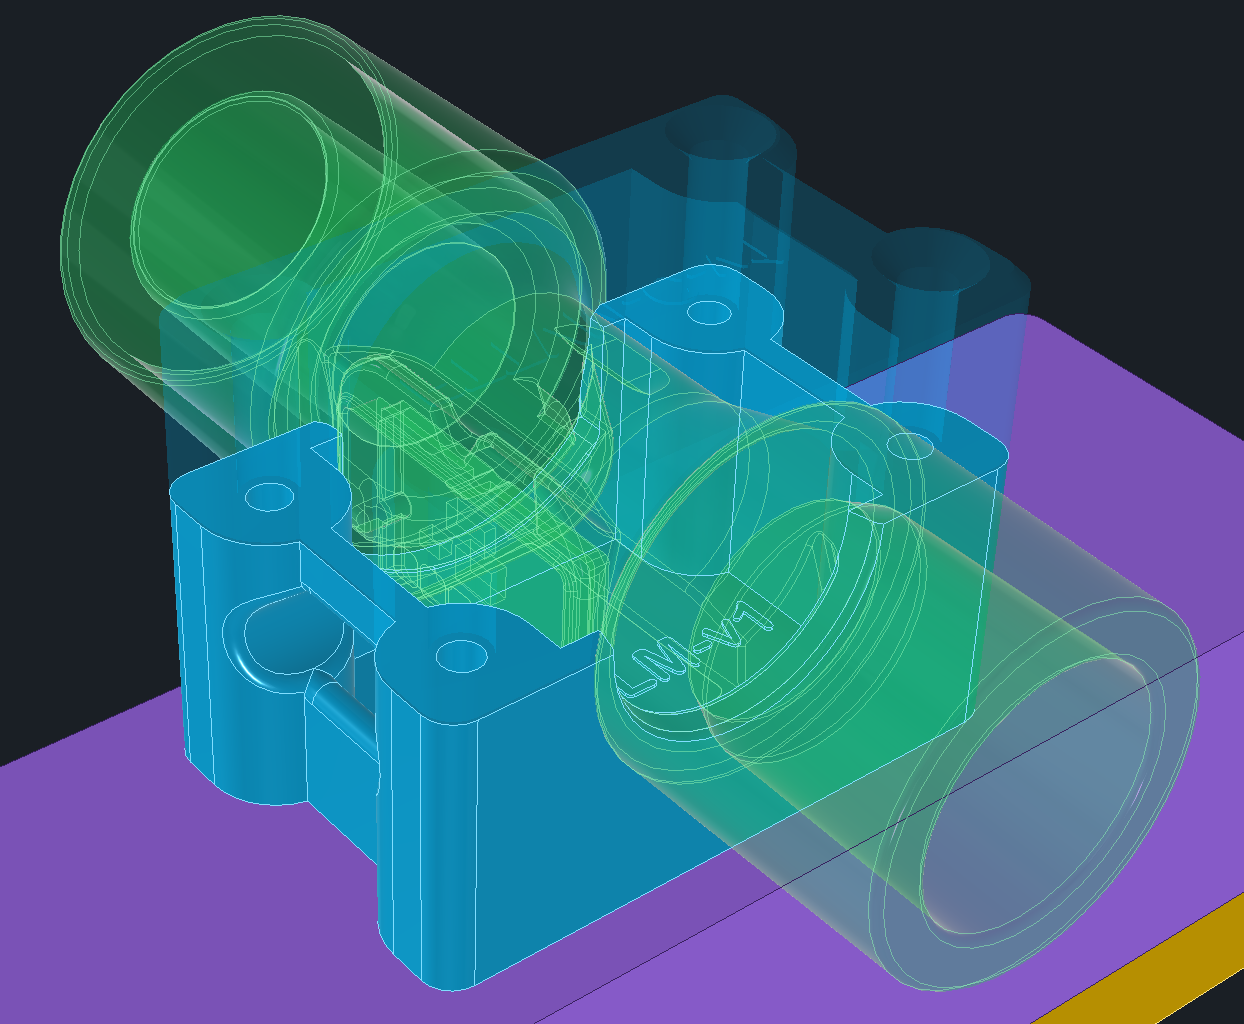
    Sensirion provides a STEP file of the sensor so I created a split clamp design and subtracted the sensor from the clamp for a solid fit.

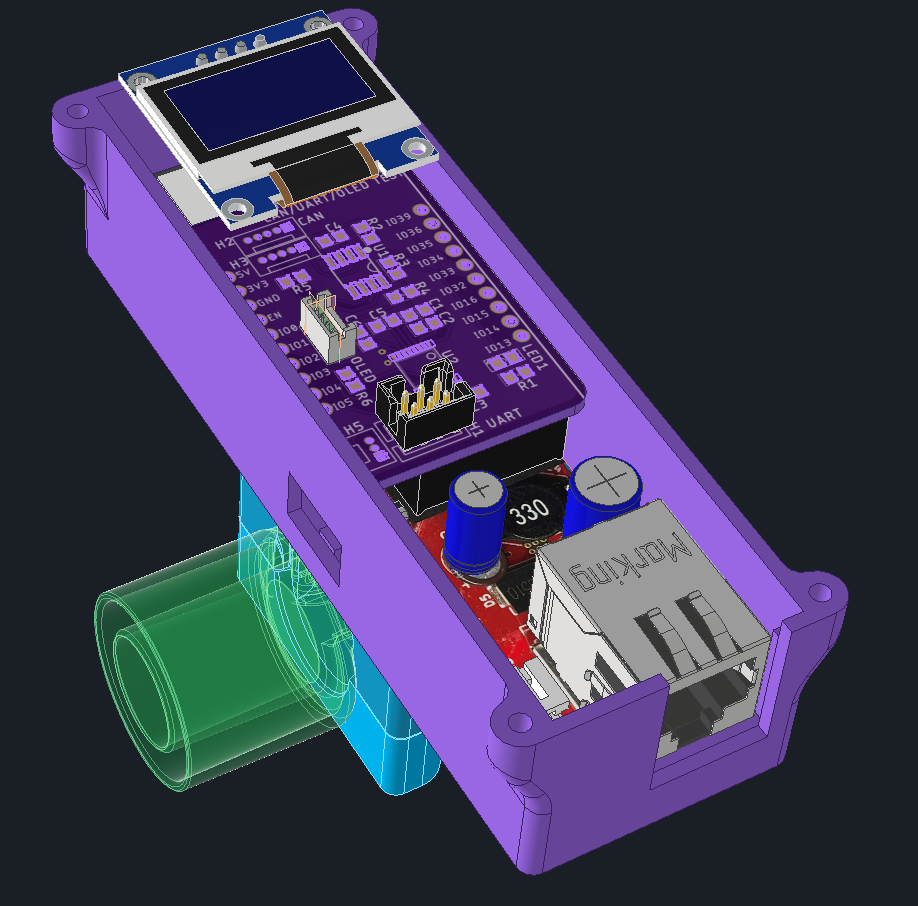
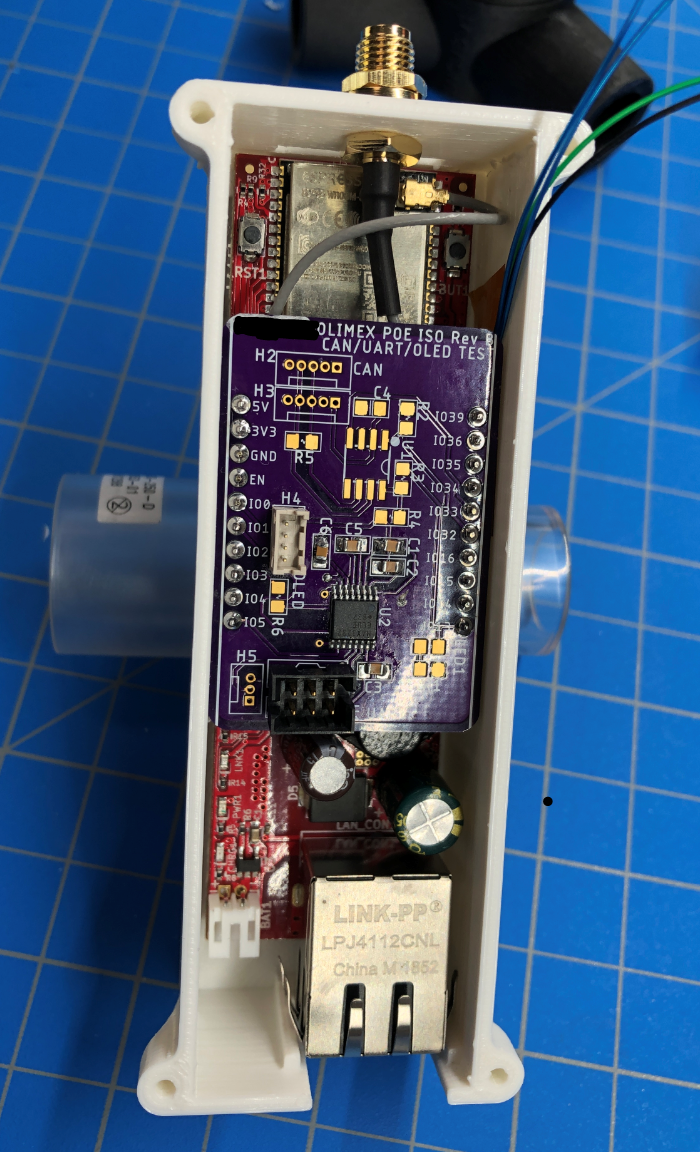
    I had a test board for the Olimex ESP32-POE-ISO on hand, so used that to connect to OLED and UART with a MAX 3232 dual RS232 transceivers. The board has support for CANBUS, but that was for a separate project and not used here. 

    4 wires to the sensor, 5V, GND, SDA & SCL. I had limited colors so green is 5V, black is ground and the 2 x blue are i2c. 

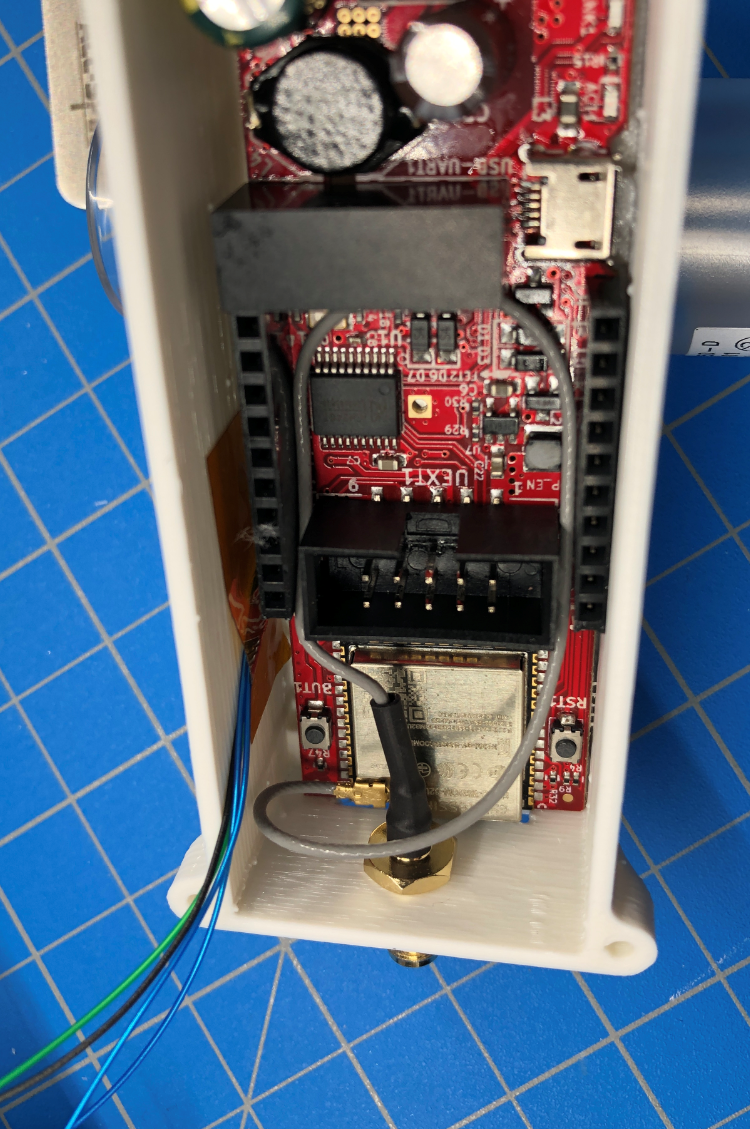
    The wires come from under the Olimex. Taped to side of housing. I had a 2nd olimex with an external antenna, so had to pop in a hole for the antenna mount. Design works with on-board antenna normally. Routing the antenna wire is a bit tight. 

    Here with the OshPark test board I had on hand. 

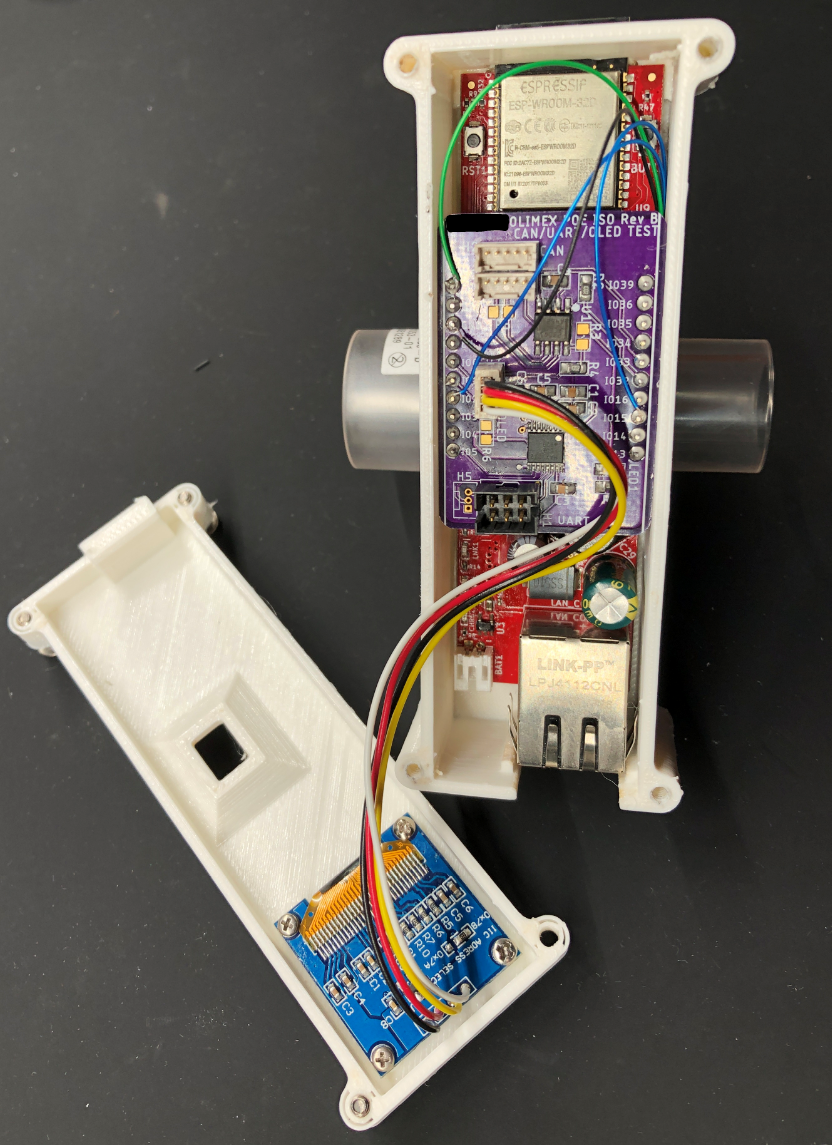
    This is device #1, with the ESP32 with onboard antenna, which sticks thru a slot in the housing. 

    The sensor is wired directly to the pins on top of my test board.  

    • BLK - Gnd
    • GRN - +5VDC
    • BLUE # 1 - SDA GPIO2 
    • BLUE # 2 - SCL GPIO15

    Eagle file for this board on Github.

  • Fast Track Tidal Volume Meter built

    Patrick04/03/2020 at 22:25 0 comments

    The good news is the first one is built and working. Actually, 2 units. 

    The bad news is, the SFM3300 has gone into scarce supply and can't be had.

    But, much can be learned with these units while other projects that don't rely on this sensor can be developed. 

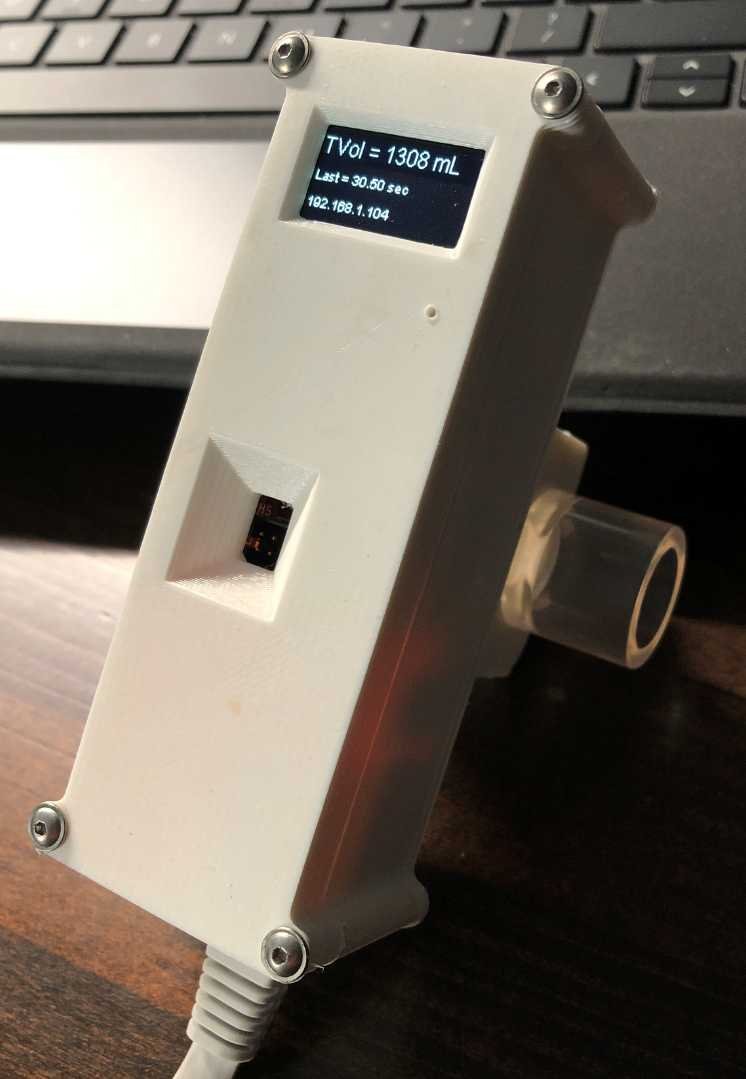
    Here is the 1st working unit. Breathing into the flow sensor, it calculates the tidal volume (volume of inspiratory flow on a single breath). I also display the time since last breath in seconds, this will later drive an alarm if this goes beyond 6 seconds (respiratory rate should be about 12-20 breaths per minute).

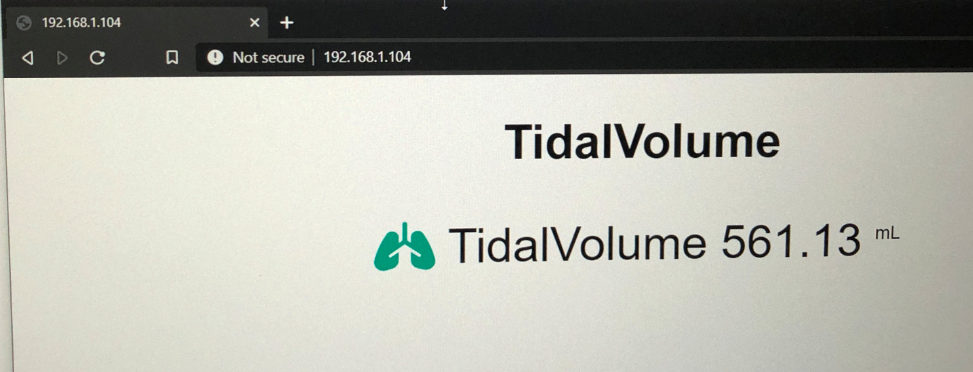
    Since we're using an ESP32, web page shows the same data.

    Missing on this unit are some must-haves

    • Pressure
      • PEEP (Positive end-expiratory pressure)- which is the minimum pressure, monitored and controlled so you don't get lung collapse
      • PIP - (peak inspiratory pressure) - monitored to make sure you don't exceed 28 cmH2O
    • Tidal Volume set point or range
      • Tidal volume (TV) is usually set to 6-8mL/kg PBW (predicted body weight), see table
    • Alarms
      • Device should have audible & visible alarm when the following occurs
        • TV is out of acceptable range (range tbd)
        • TV goes to zero (hose disconnect)
        • PEEP or PIP pressure beyond safe limits

    Features/issues of this design approach

    • Power
      • POE Power (not used in medical environments?)
      • USB 5V Power (connector is not positive locking)
      • Battery backup (only for 3.3V, sensor requires 5.0V)
    • Connectivity
      • Additional RS232 port for debugging/monitoring
        • Allows USB port to be used for serial plotter
      • Remote monitoring over WiFi (requires WiFi access point setup)
      • Remote monitoring over Ethernet (networking challenges)
    • Sensor
      • This sensor is expensive and is not currently available

    Still lots of work to do. Also, there are individuals working on implementing parallel designs, versions using hot wire anemometer, everything from an automotive mass airflow sensor to a transistor based unit. At some point, the prevailing unit (ideally 3.3V powered for my design direction) will be adapted to this design so we can make more. We also have a couple of designs in progress that are based on differential pressure, one with a pitot design and one as a venturi design. 

    Most are using an existing PCB, from STM Blue Pills, ESP32s, Arduino, & feathers. Also, one design is going component level using a STM32. 

    The current plan with these 2 sensors is to do some testing, with simulated lungs. Hopefully in the next couple of days, in a med-school lung lab. 

    We are looking at what this will take to get FDA EAU approval under the PREP act. This will provide liability immunity.

View all 7 project logs

Enjoy this project?

Share

Discussions

Patrick wrote 03/21/2020 at 20:12 point
  Are you sure? yes | no

Michael Möller wrote 03/21/2020 at 09:46 point

"This invite link is no longer active."

  Are you sure? yes | no

Similar Projects

Does this project spark your interest?

Become a member to follow this project and never miss any updates