Joseph Eoff
Rodriguez started as a nameless project I used to make a point in an online discussion about the shape of the current/voltage plot of the base/emitter junction of an NPN transistor.
I started it on a Saturday evening and needed it done quickly, so I could only use the parts I had at hand. That's a pile of passive components, and an Arduino Nano.
The initial version was intended to investigate this circuit:
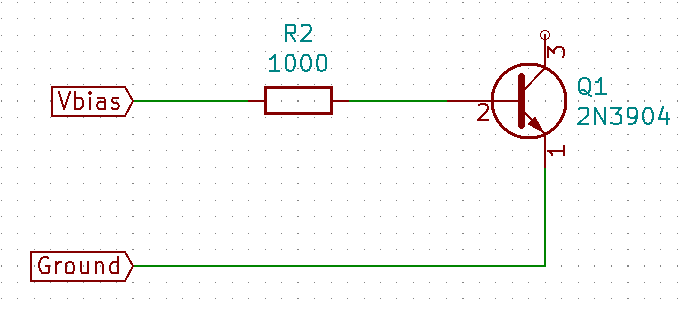
The idea was to plot Vbias against the base current.
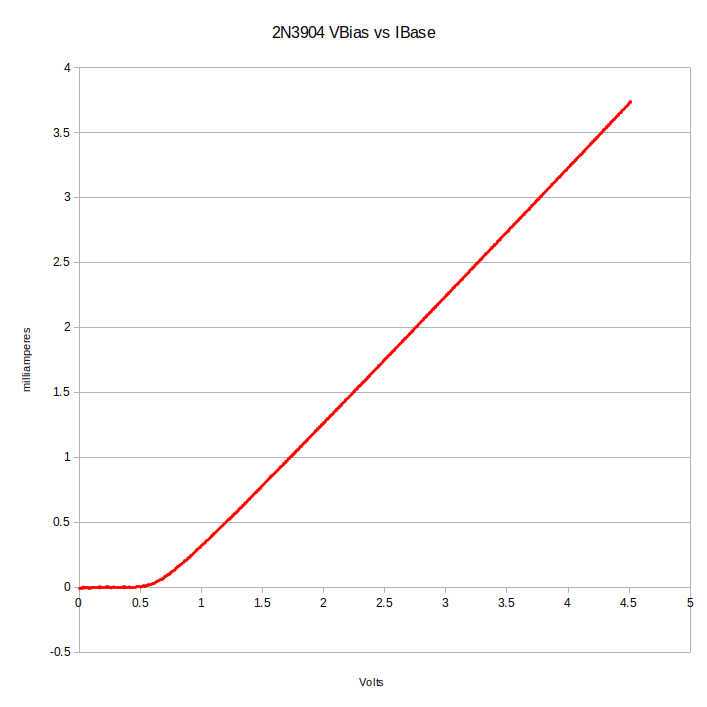
This is the result:
Once I had that working, I realized that I had solved all of the problems involved in making a current/voltage tracer for transistors.
Current/voltage traces are used in designing transistor amplifiers using the load line method of design.
A current/voltage plot of a typical transistor looks like this:

(Note: That's from an earlier version of Rodriguez. The base current display still had some bugs.)
A current/voltage tracer consists of a couple of current sources and some voltmeters.
Arduinos have some low resolution analog to digital converters, and PWM outputs that can be used to generate analog voltages and currents.
Here's the circuit I built for Rodriguez using just a few passive components and an Arduino:
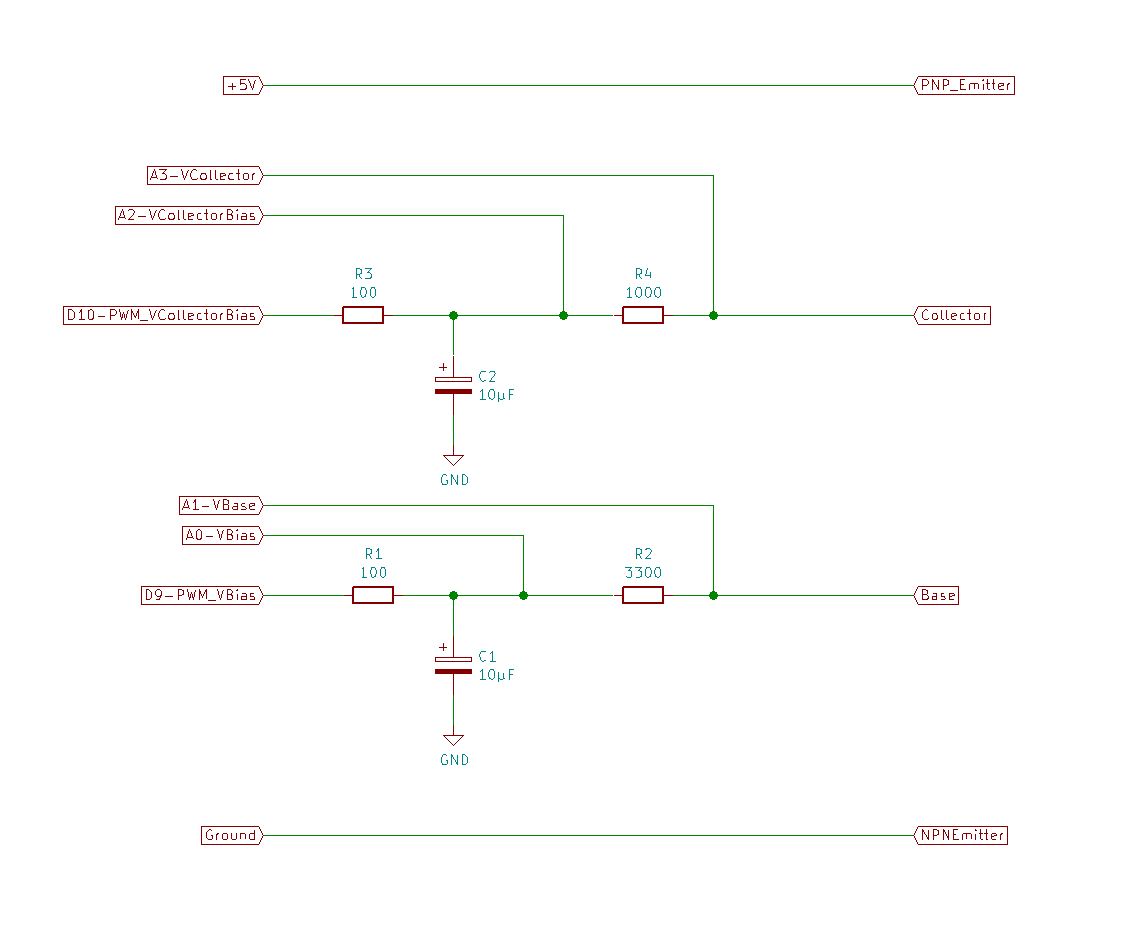
The standard Arduino PWM outputs are rather coarse. They have only 256 steps, and the standard PWM frequency is rather low.
The analog to digital converters are only capable of 10 bits of resolution.
Neither the PWM outputs nor the ADC inputs are up to the job of generating microamperes or measuring millivolts - unless you get clever.
Rodriguez uses a couple of tricks to get usable results out of its very crude hardware.
To get better resolution on the signals generated by the PWM outputs, it uses the Timer1 library. The Timer1 library allows a (pretty much) free choice of the PWM frequency and 10 bits of resolution for the pulse width (that's 1024 steps.) With a PWM frequency of 10kHz, Rodriguez can get by with a very simple low pass filter to make the analog signals. With 1024 steps, the plots are smoother than they would be with just 256 steps.
Rodriguez makes use of oversampling to get the equivalent of 14 bits of resolution out of the 10 bit ADCs. For the really fine measurements of the base current, it goes further and oversamples the oversampling. It oversamples by 256 for most measurements. The base current measurements are oversampled 256 times the regular oversampling.
The oversampling gets Rodriguez enough resolution to be useful, but also makes the program very slow.
A trace using 5 base current levels will take several minutes to complete.
Rodriguez's main "claim to fame" is the simplicity of the circuit.
All you need is two capacitors, 5 resistors, and an Arduino of any flavor.
It can be assembled by anyone using whatever is at hand.
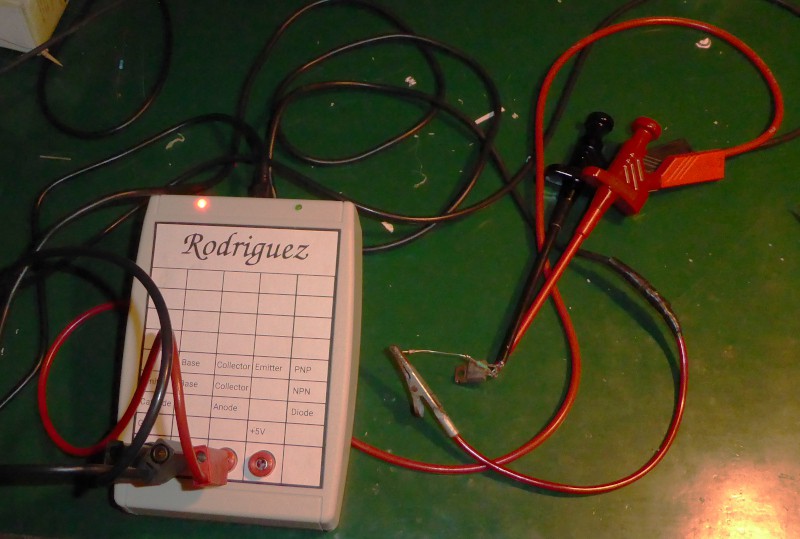
I built mine as a sort of 3D sculpture on the pin header of the Nano. It could just as easily be assembled on a solderless breadboard. Perfboard would work as well. An etched PCB would be rather overkill, but whatever floats your boat.
The software is in a github repository, which also includes a schematic of the required circuit.
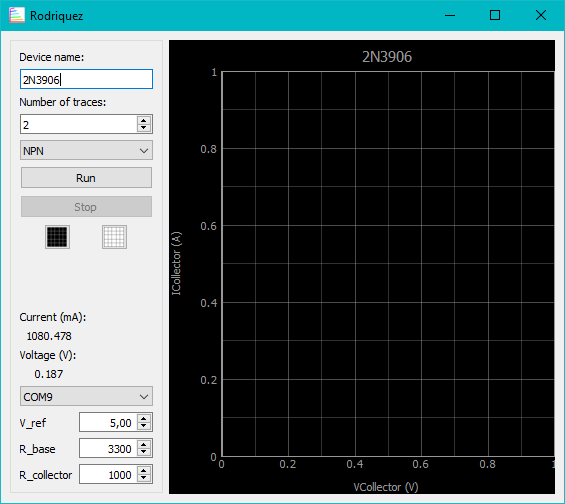
I used Qt and Python on the PC side. The Arduino program is also in the repository.
For now, Rodriguez can make current/voltage plots of bipolar junction transistors and diodes. I've used it on 2N3904, 2N3906, and 2N2222 transistors. I've used it on LEDs of various colors, as well as regular diodes (1N4148, 1N4001.)
This is the lV trace with load line markings that I used to design a simple single transistor amplifier:
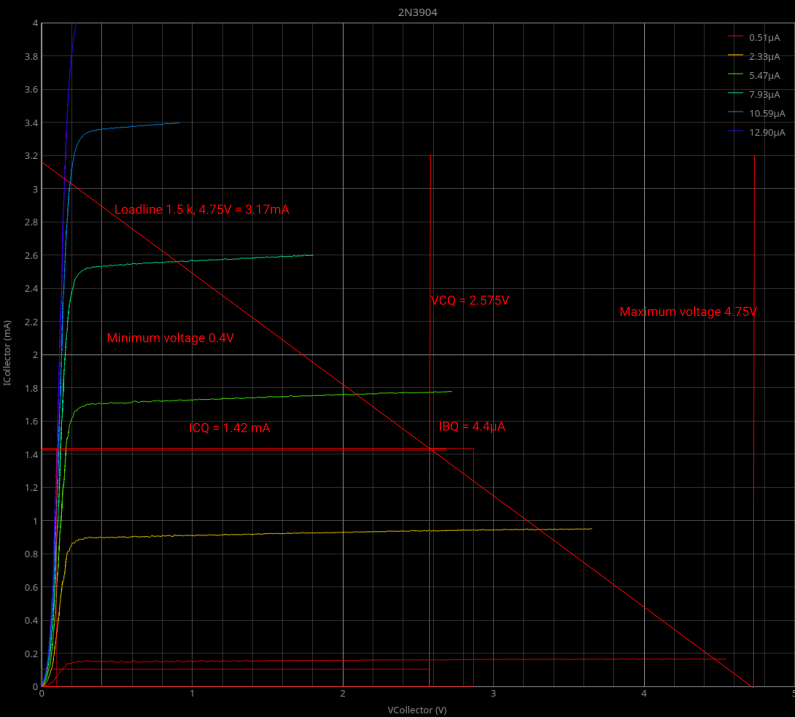
Rodriguez plotted the current and voltage repsonse of the 2N3904 transistor, and I used Inkscape to draw the load line and determine the bias current for the base.
I even went so far as to order some tunnel diodes just to see what would happen. It turns out that Rodriguez can't plot the negative resistance range of the...
Read more »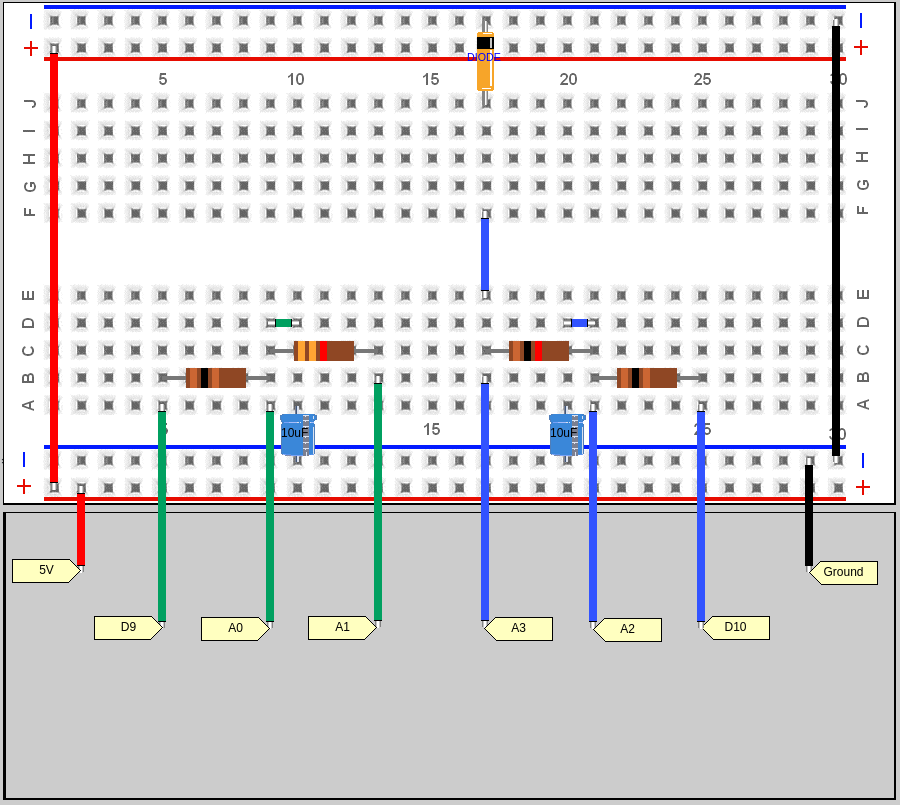


 Yann Guidon / YGDES
 Lithium ION