 Mark Henderson
Why eye2see ?
For decades professional embedded tools have included sophisticated debuggers, typically ones that provide debug data using information from the source code ("symbolic debuggers"). The Arduino universe has enabled millions of people to develop amazing embedded projects, but has never offered robust debugging capabilities (this is changing with some of the newer hardware and IDE versions). But since so many folks are happily using legacy, small, low cost and low performance Arduino-based platforms, we're left without good debug tools!
eye2see (a play on words ;-) ) was developed by me as a way to get debug info out of Arduino projects that were very limited, in terms of pins, memory and ports (like the ATTiny85). Many of my projects (most?) have an I2C bus connecting displays and sensors, or have a free I2C port. So, why not output debug information over those wires?? ZERO additional pins used if you're already using I2C!
Once I started sending debug info out the I2C port, I realized I could use C/C++ macros to get actual symbolic information at run-time (!), and format data for display on a PC. I used an Arduino as an I2C to serial-over-USB bridge, but soon added functionality to this "probe" (hardware and software). eye2see was now a light weight, sophisticated symbolic debugger (with a couple of small limitations).
I've used eye2see for a couple of years, and it's now indispensable for all my projects. It's far superior to using "Serial.print()" debugging, and it frees up the serial port for other duties! I typically add a Qwiic/StemmaQT connector to all my PCBs so connecting the eye2see probe is plug-and-play. Where eye2see is particularly helpful is debugging results of type conversions (different sized integers, signed/unsigned, overflows etc.) as it can display variable values in different bases and formats.
eye2see - Overview
Once you have the eye2see system set up (more on this below), using eye2see is extremely easy! Any time you want to see the value of a variable in your running program, all you need to do is insert a line to call eye2see, with the variable name in the function call:
e2clog(VariableName);
When you upload your program to the target and it starts running, and the line of code you inserted executes, you will see a display like this on the eye2see PC graphical user interface:

ey2see displays a timestamp (each time the variable is updated), the file name of the Arduino source file (aka Arduino IDE tab), the line number of the added line of code, the variable name and the variable value - which can be displayed in user-selectable signed decimal, unsigned decimal, hex or binary formats!
eye2see can also display text strings (like using Serial.print()):
e2cslog("Hello world");
Will display :

You can use eye2see to watch multiple variables, with the most-recently updated value being highlighted in red.
Break Points
In addition to watching variable values, eye2see can also stop execution on the target when a variable is updated ("Break Points"). A red dot indicates the execution has hit a "break", and a "Resume" button allows the target code to resume running:

Break points can be enabled and disabled from the eye2see GUI, and can also be set using the following function call in your code:
e2clogbrk(anint);
eye2see - Limitations
The main limitation of eye2see is that it slows down target execution (a lot). This is due to handshaking that occurs between the eye2see components (running on target, eye2see Probe and the PC).
For many debug cases this is not a big problem (for example, when developing user interfaces etc.). In some cases it doesn't impact programs that interact with the real world (for example, reading a sensor), but in some cases it will impact operation of the target (for example, motor control). In some cases it's possible to record variable values to global variables in...
Read more »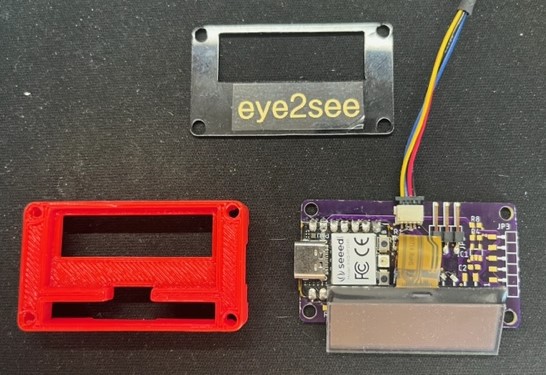
 Peter
Peter
 Alastair Young
 Ken Yap