Mario Frei
We want to perform measurements in remote locations with various sensors. Existing solutions seem to be expensive, offer a limited selection of sensors and require too much expertise with a specific solution from the user. That is why we propose (yet another) solution to overcome the existing limitations.
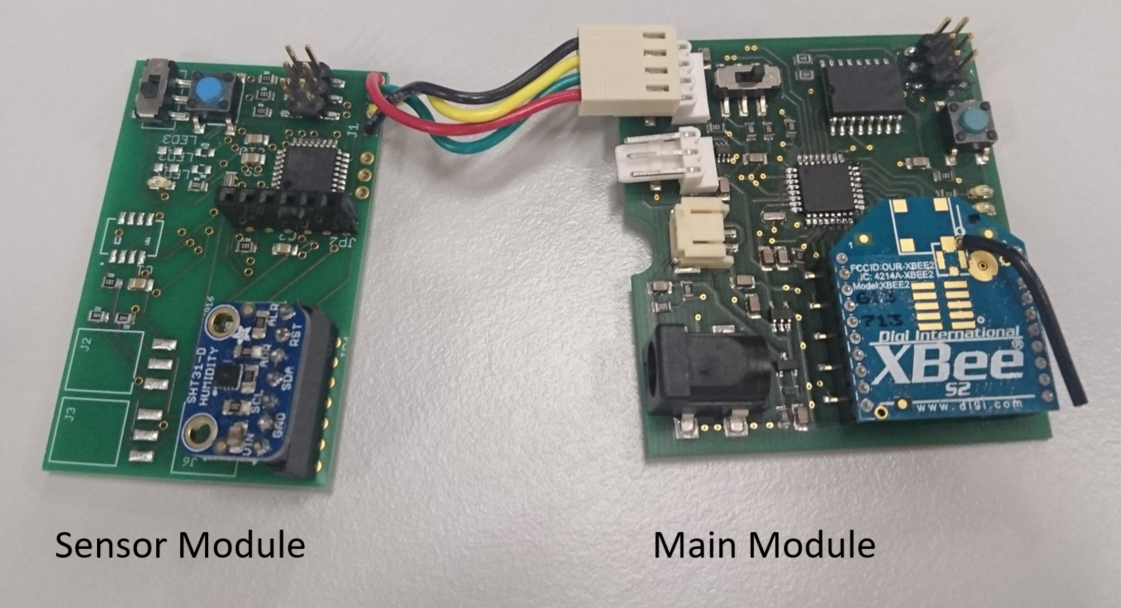
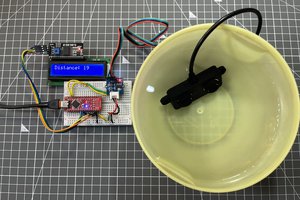
Our sensor nodes consist of two main complimentary components: a sensor module and a communication module.
The communication module manages the power, triggers the measurement and stores the data (locally and/or on a web server). The sensor module hosts all sensors, reads the sensors and sends the measured data to the communication module. Both modules feature a microcontroller.
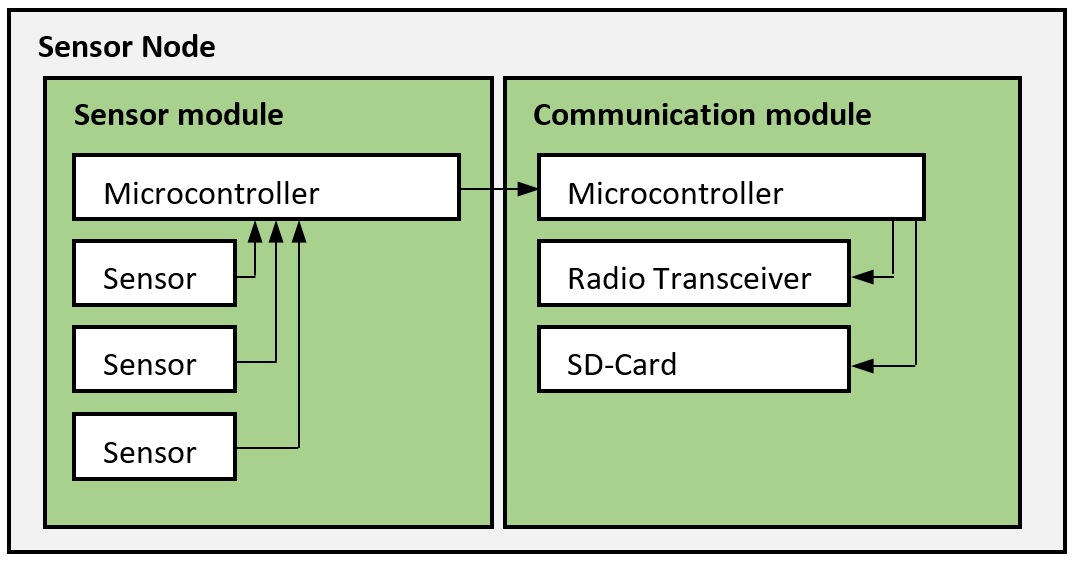
The splitting of the sensor node into two parts brings some advantages:
- Independent development of sensor modules and communication modules
- Different communication modules are possible, e.g. local logger, various wireless solutions, etc.
- Sensor specific data can be stored on the sensor module and stays with the sensor, e.g. calibration data
- Overall smaller footprint of electronics compared to an Arduino + shields configuration
- If only one module is updated, the other can be reused
The disadvantages are:
- Higher cost due to the presence of two microcontrollers
- Reduced flexibility compared to Arduino + shields configuration
Goals
- We want to measure with a sampling rate of one measurement every 5 minutes.
- Continuous operation of a sensor kit for 6 month without the need of maintenance.
- Untrained people should be able to deploy sensor kits.
- People with little training can modify the WSN.
- Reusability of modules
- Exchangeability of modules
- Suitable for people with different skill levels in different domains.
- The deployment of a sensor kit should take less than 2 hours
There are many IoT platforms and data loggers that provide similar functionality and much more. However, we have the impression that the multitude of features comes with complexity and high costs. We want to perform a lot of measurements with many different sensors in remote places. That is all. We believe that we can reduce the cost and the required skill level by limiting the range of features and by reusing some components for different measurement campaigns. We hope that the modularity and simplicity of our proposed platform invites people from different domains to profit from our work and enrich the platform with modules that suit their needs.
Spoiler
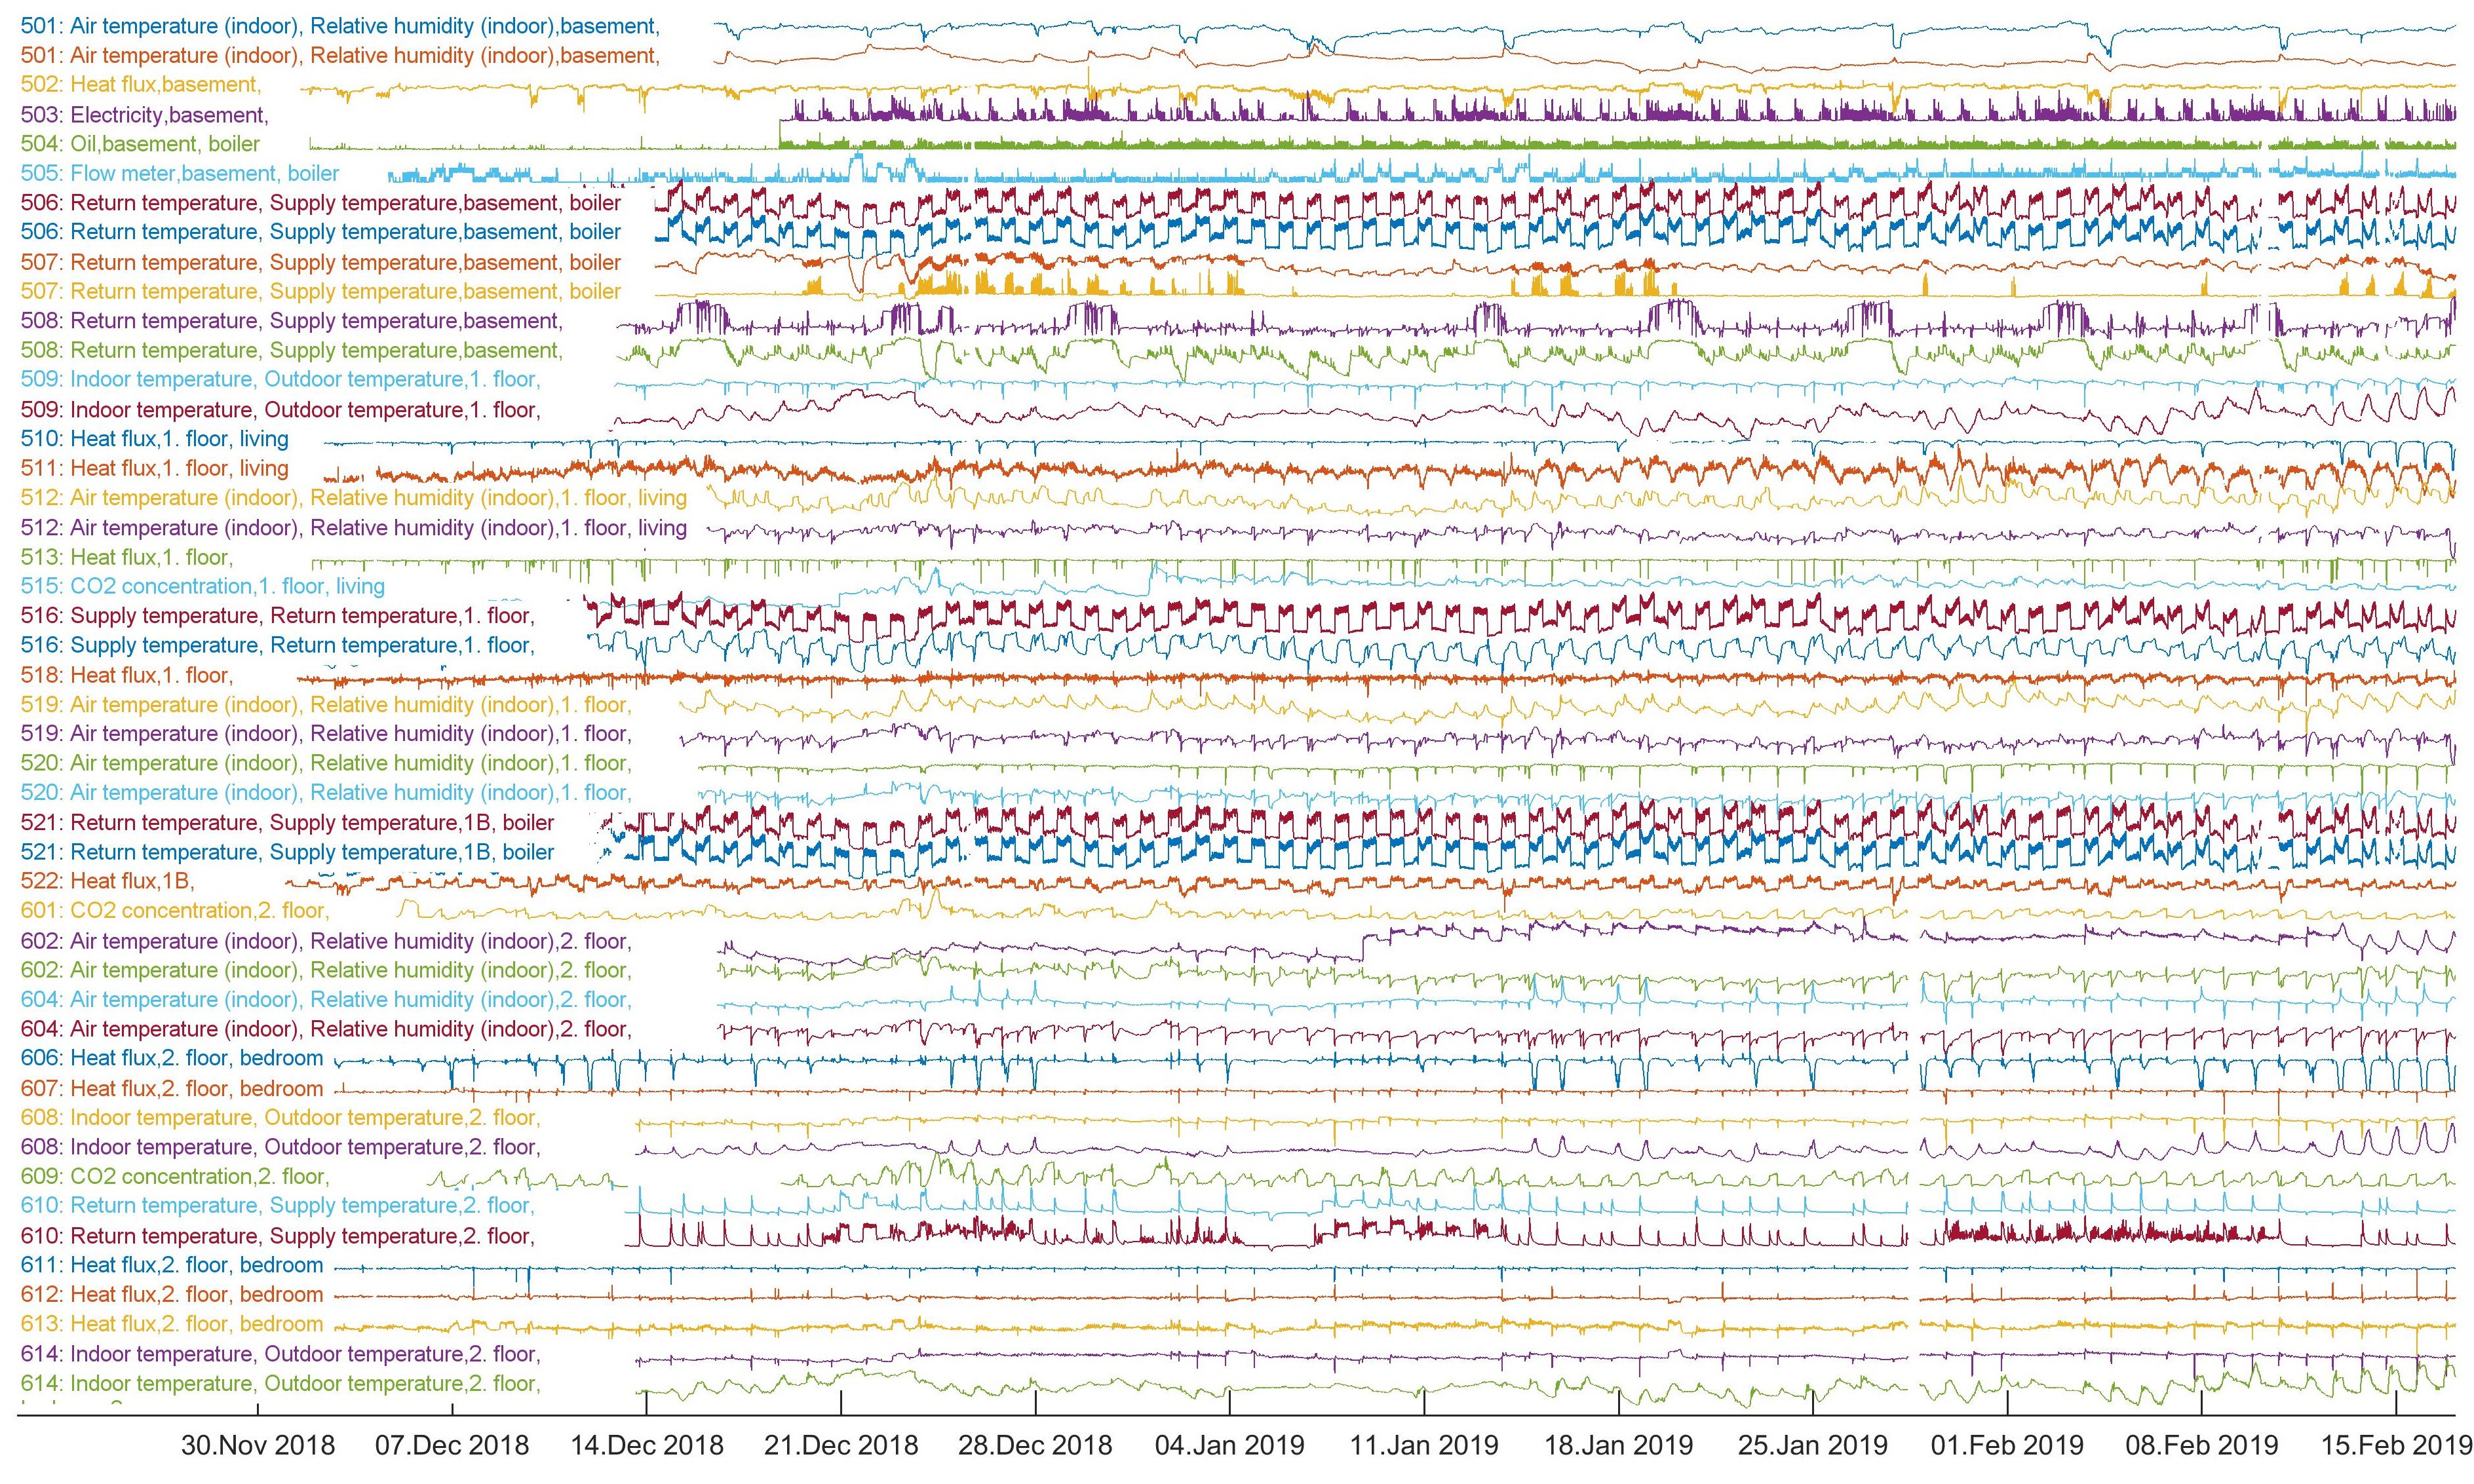
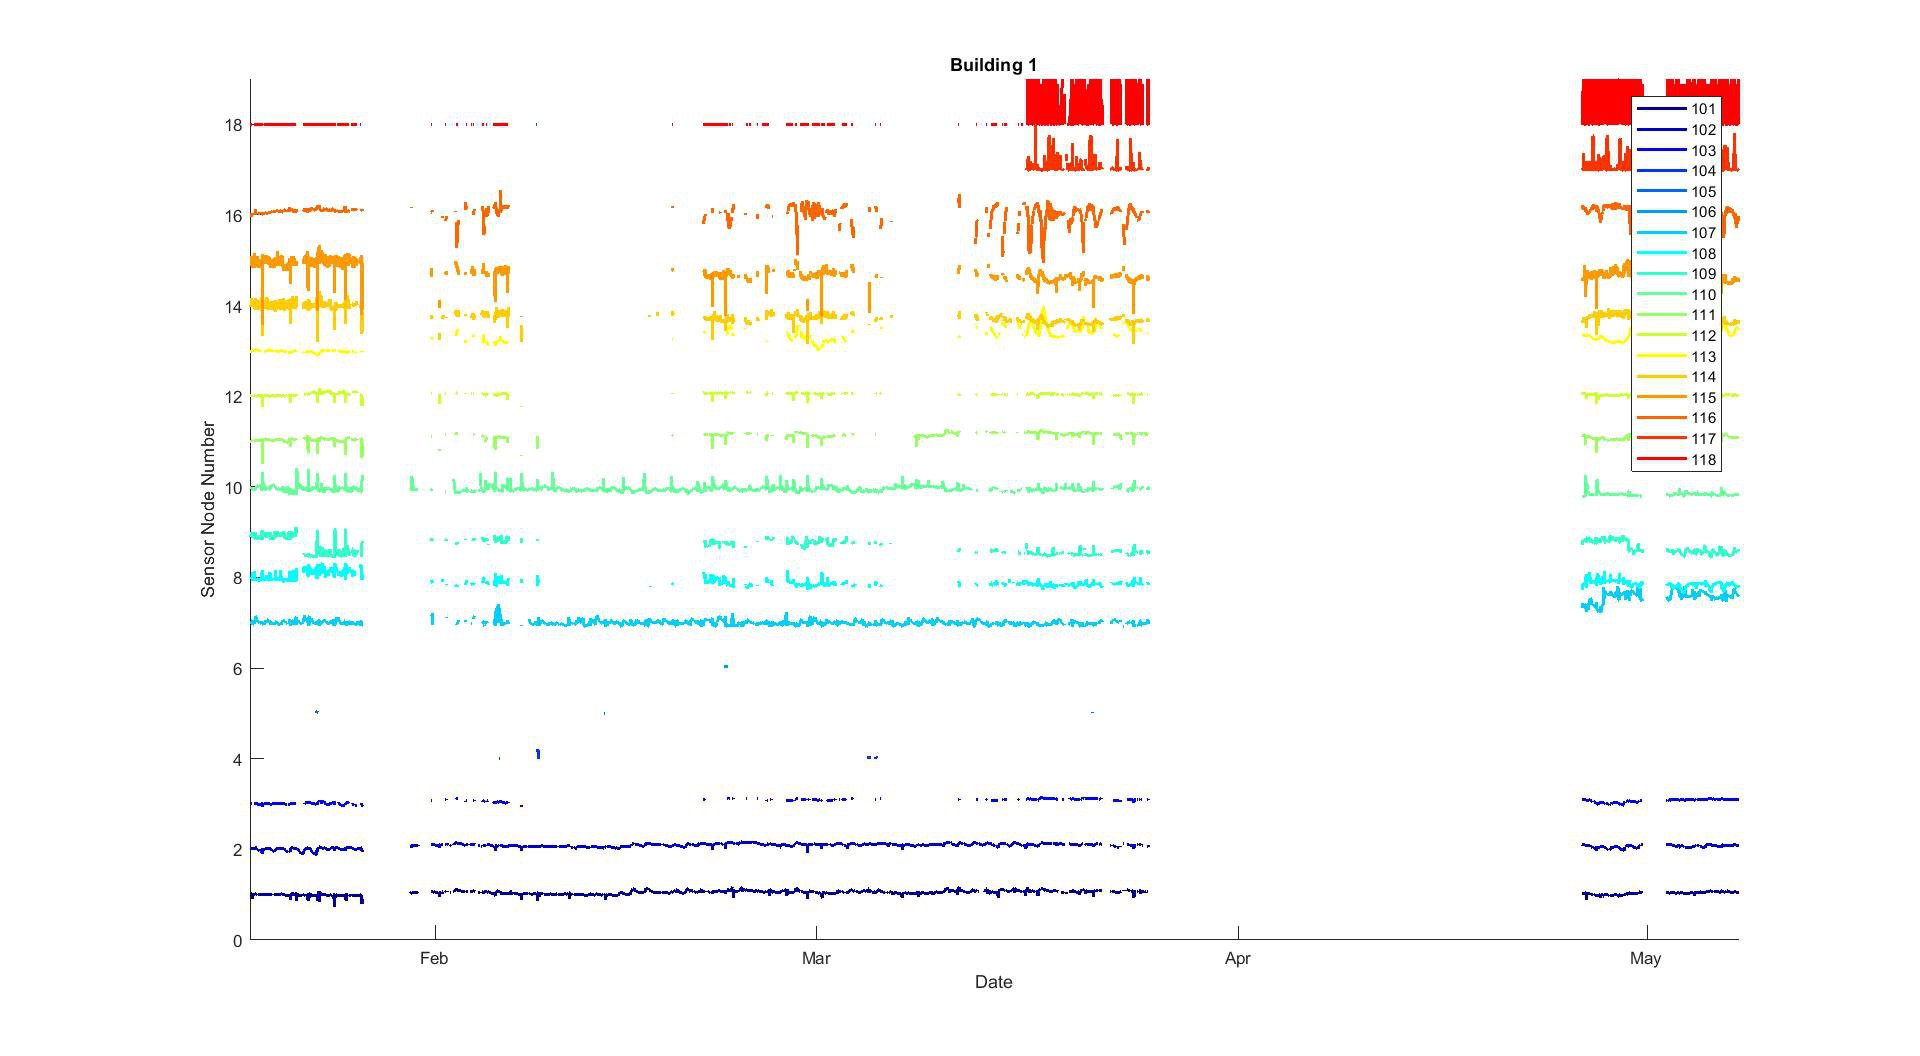
We developed a communication module featuring an Xbee radio transceiver, an RTC and an SD-card for local storage. Further, we developed about 7 different sensor modules. We manufactured 8 sensor kits, each consisting of 18 sensor nodes, 5 router nodes and 1 cellular gateway. The measured data is sent to an online MySQL database. The sensor kits were deployed in eight buildings. In this project blog, we are going to share our experience developing, manufacturing and deploying the sensor kits in occupied buildings. We are looking forward to your feedback.
 ElectroBoy
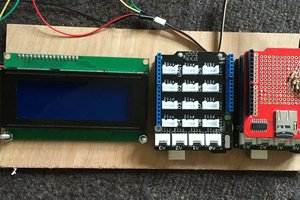
 Craig
Craig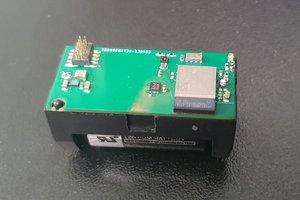
 Edward