Close
0%
0%

Insole Pressure System for Mass Customised Shoes

Insole gait analysis system for the design of mass customised 3D printed shoes

Similar projects worth following
In 2012 a US national survey (GROUP, NPD, 2012) commissioned by the IPFH (Institute for preventive foot health) revealed that nearly 80% of the population above 21 years have had at least one foot related. Within this group, 59% stated that they had gone to see a specialist for treatment. These statistics serve as an insight into the scale of the problem, it should be noted that the causation is also just as broad, whether it be the lifestyle or the environment of the user. This brings up a question which is at the core of this project; Can there be a cost effective and symptom-specific solution between a standardised orthotic insole and one crafted by an orthotist?

This project is part of my MSc Computational Architecture thesis at the Bartlett School of Architecture (UCL) in London.

If you have any suggestions or questions about the project please feel free to write a comment.

For any enquiries regarding this project please use this email: Design@

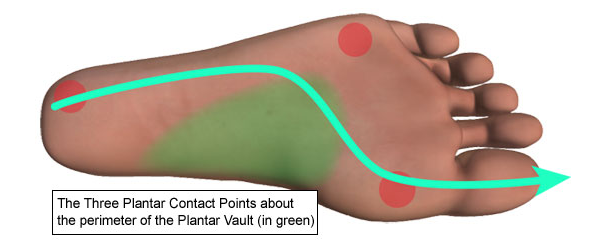
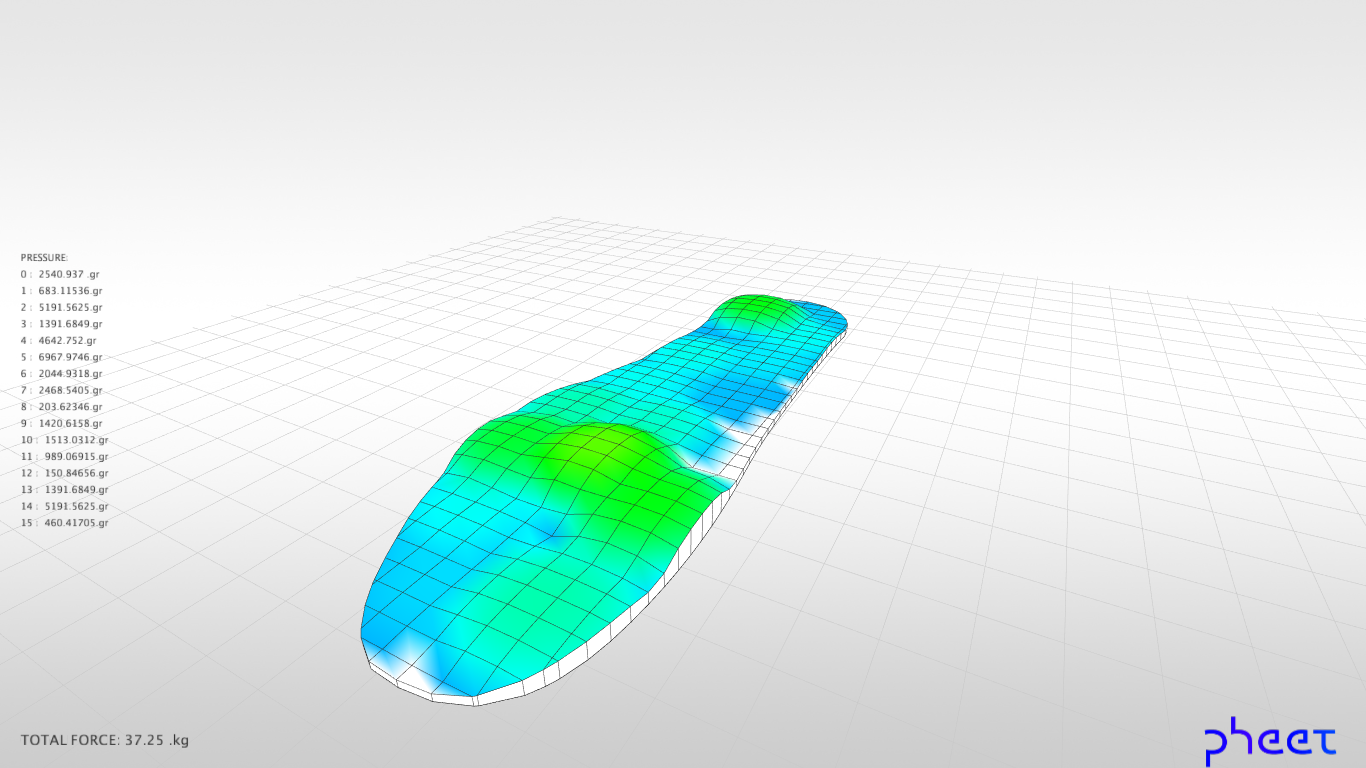
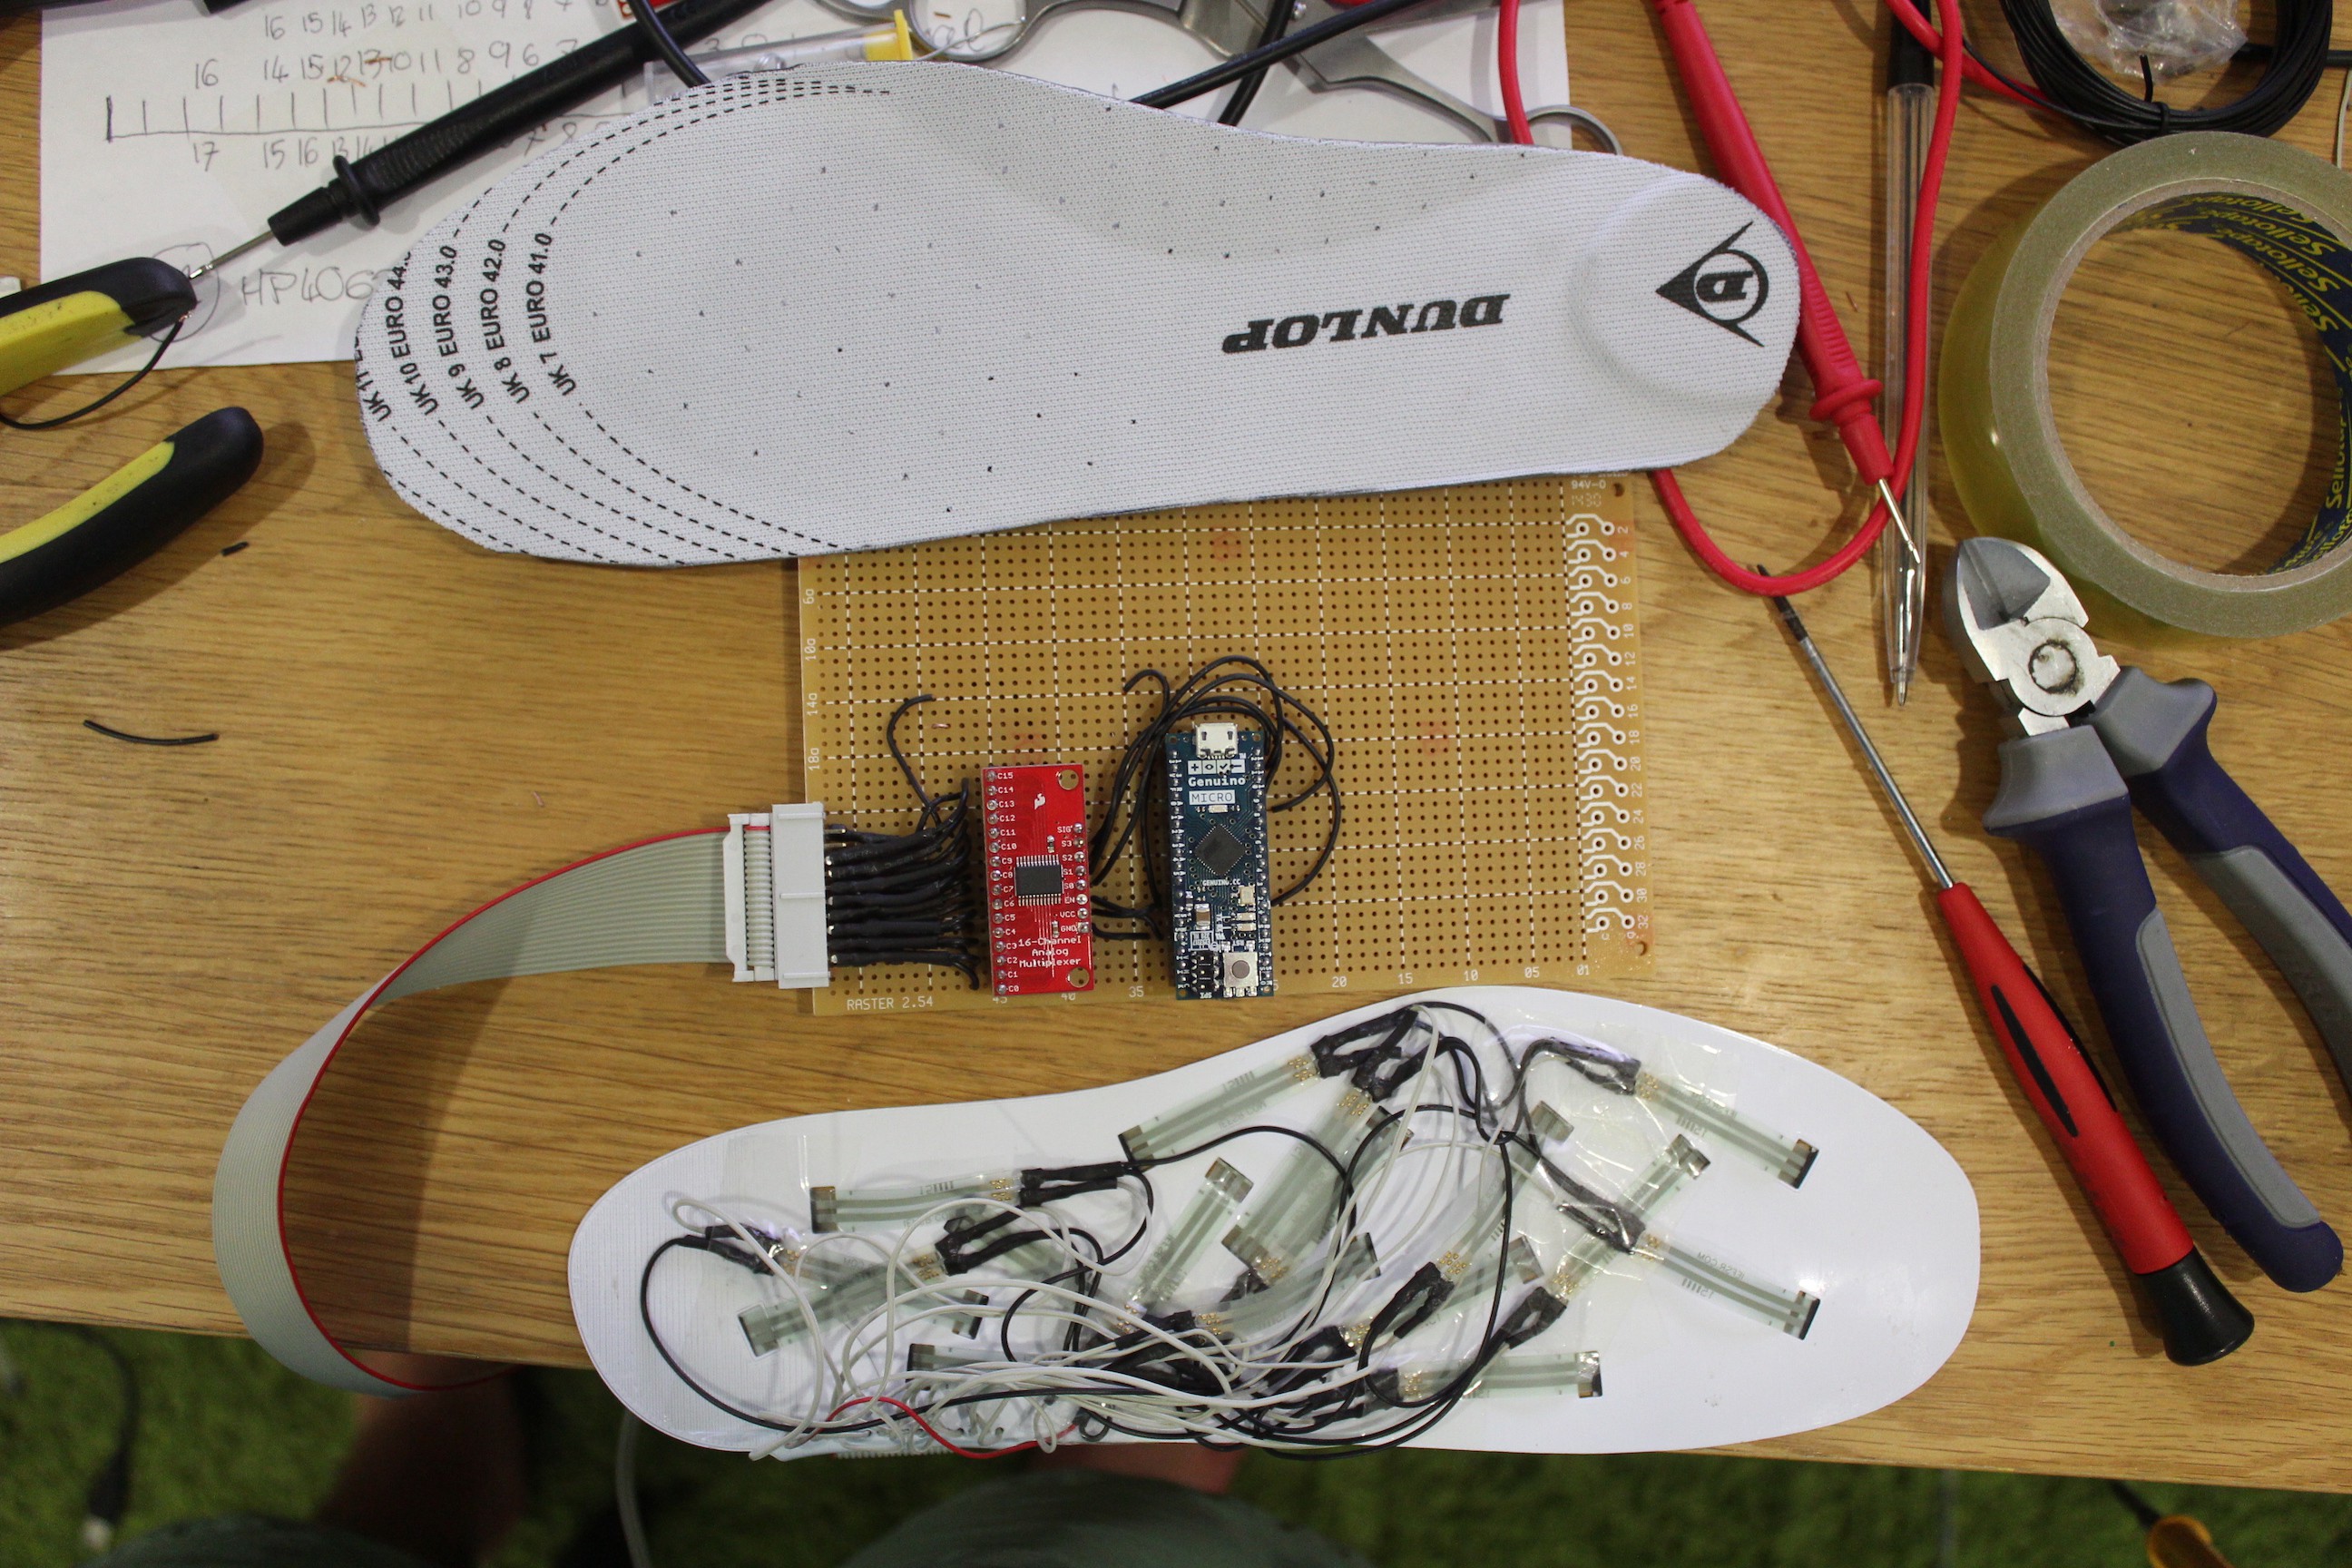
A NOTE ON SAMPLE RATE: My initial goal was to transfer the data from the insole via Bluetooth directly to the computer, however I've decided to first get it working as it should via a 20 way ribbon cable. This is because the sample rate in this project is crucial (<40ms), any loss of data via Bluetooth will reduce the quality. To understand why this is the case, it is important to know what a Gait Line is; the pressure distribution through time. I suggest you take a look at the PDF called CharlesFried which shows the heatmap through time and gait line of my feet. This was carried out on a top of the range RScan platform at my local Orthotist.

Now you might ask, well what is the point of the insole if you have the data from the RScan? This is at the very core of the project; first and foremost pressure peaks are much higher during periods of activity. Additionally, there is a tendency for people to subconsciously change the way they walk whilst under the observation of a Orthotist thus giving false data.

insole_V2_1.STL

Insole 3D model

Standard Tesselated Geometry - 383.58 kB - 06/20/2016 at 12:48

Download

CharlesFried.pdf

Gait Analysis carried out on a top of the range RScan platform.

Adobe Portable Document Format - 4.68 MB - 06/20/2016 at 11:28

Preview
Download

View all 7 components

  • Understanding the Anatomy

    Charles Fried07/18/2016 at 23:32 1 comment

    The following log is my humble attempt at understanding the bio-mechanics of the foot. The image above is a 3D print of an anatomically correct foot skeleton, consisting of 26 bones. It is also over 25% of your body's total musculo-skeletal anatomy, hitting the ground every time you walk or run! This really demonstrates the complexity and beauty of the system which we use for transport. I find the geometry fascinating, it seems the volume distribution relates directly to function, becoming thinner in the middle and thicker at the extremities.

    I stumbled upon this article which I thought was very informative, it describes the foot as a vault, which has three main weight bearing focal points. If we consider a bio-mechanical ideal gait then the pressure distribution is as illustrated below. By averaging these points we can then obtain the gaitline, it is by calculating this line from the 16 sensors that we can diagnose the patient.

    Once diagnosed the methodology to create the insole is not so clear and subject to much contraction within the field. I am starting to build my own process but I'll refrain to elaborate until I've done more research and testing.

    To end this log I just wanted to share a quick update on the hardware, it most definitely took much longer than it should but it's now working properly. You can see below the insoles inserted in an old pair nike. The target sample rate of 40ms was achieved, I've even managed to get it down to 20ms which could come in useful in certain sports.

    Finally, a brief real time replay in the software, even though there is much work to be done on the analytical side I think it's interesting to see the prominence of the three main weight bearing points.

  • Software v1.2

    Charles Fried06/27/2016 at 15:18 0 comments

    In preparation for a presentation I thought I would spend a little more time visualising the data. It seemed like a nice idea to have the in-sole in 3D with the pressure mapped to the Z height.

    I started by modelling a mockup grid in grasshopper and exported the points as csv files which are easy to handle on the processing side. However because not every cell has four sides I had to find a way to 'embed' the tree structure in a csv, you can the number of side concatenated as the first variable in grasshopper circled in red.. Be sure to check the order of the points before exporting, I found that GH had somehow mixed them round.

    In the previous log I described a process of interpolation on a pixel basis which turned out to be extremely inefficient, running at 8fps on mac book air. So I decided to split the shape into a grid and calculate the force only at the corners of each cell.

    The gradient function stayed the same, by playing with the exponent (y) we can control the fall off. It's just a common remapping formula with an additional force scalar at the end. We also say that for any sensor we won't look beyond a certain distance, this is only for the purpose of visualisation so the exact absorbance 'radius' does not matter too much.

    Float zHeight = (lowTo + ((distance^y) - lowFrom) * (highTo - lowTo) 
    / (highFrom^y) - lowFrom) * force
    

    The sketch now runs at smoothly at 45fps which leaves plenty of room for further calculations.

    Todo list:

    - Distribution through time

    - Center of gravity

    - Per Sensor time/pressure graph

    - Sensor Calibration

    - User Software Calibration

  • Software Prototype Development

    Charles Fried06/21/2016 at 20:06 0 comments

    I though it would be worth making a short log on writing the code to visualise the data. Please note that I have not yet linked it with the sensors. The visualisation below was made in Processing using random perlin noise for the development.

    The trick here is to interpolate the readings between each sensors. In order to rationalise the problem we must first decide to what level of accuracy we want to be making the calculations. In this example this was done on the scale of one pixel, meaning that for every pixel we calculate the its colour relative to the strongest force. To re-iterate, if the force from the closest sensor for any given pixel is lesser than the second closest sensor then we ignore the latter and register the former.

    Now we've covered the basic logic we must create a function that will give us the gradient we're looking for. The following code will only work as expected if you've already carried out the calculations necessary for a linear force/resistance relationship.

    // The distances for from every pixel to each sensor is calculated and stored in setup()
    int [][][] distances = new int [sensor_Num] [mask.width] [mask.height]
    
    // We need a temporary matrix to store the forces until we draw then
    // Must be initialised
    float [][] temp_matrix; 
    
    // A function which take the masks and returns the heatmap as a PImage
    PImage dispHeat(PImage mask) {
      
      // Create and load the output image  
      PImage pout = createImage(mask.width, mask.height, HSB);
      pout.loadPixels();
      
      // Save the max and min for final remap
      float max =-1 ;
      float min = 10^4; // Start with an arbitrary high value
      
      // Max force for any sensor in gr, obtained in calibration
      int max_force = 8354;
    
      for (int i = 0; i < sensor_csv.length; i++) { // For every sensor
        for (int  x = 0; x < pout.width; x ++ ) { // For every pixel in width
          for (int  y = 0; y < pout.height; y++ ) { // For every pixel in height
    
    
            if (mask.pixels[x+(mask.width*y)] == color(0, 0, 0)) { // If the pixel on the mask is back then proceed
              
              // Changing the exponent will change the sharpness of the gradient
              float pressure = map(pow(distances[i][x][y], 3), 0, pow(max_force, 3), 0.1, 0) * raw_sensor[i] ; 
    
              
              if (pressure > temp_matrix[x][y]) { // If new pressure is greater than last then update
                temp_matrix[x][y] = pressure;
              }
    
    
              if (pressure > max) max = pressure; // Save max and min
              if (pressure < min) min = pressure;
            }
          }
        }
      }
    
    
      heatmap.loadPixels();
    
    
      for (int i = 0; i < pout.width*pout.height; i++) {
    
    
        int x = i%pout.width; // Find XY coordinate
        int y = i/pout.width;
    
    
        if (mask.pixels[x+(mask.width*y)] == color(0, 0, 0)) { // If the pixel on the mask is back
          float col = map(temp_matrix[x][y], min, max, 180, 0); // Then draw the result
          pout.pixels[i] = color(col, 255, 255);
        }
      }
      pout.updatePixels();
      
      return pout;
    }

    Mask used as the input to the function

    Mask image used as an input to the displayHeat() function

    On my macbook air 1.6 GHz Intel Core i5, 4 GB DDR3 the program runs at 20fps which isn't surprising considering it's iterating through 40,000 pixels every cycle. However as we won't be visualising the data at the same time as recording it, it won't be a problem for the final sample rate.

    There's a lot more to say about the software but I'll keep that for a future log once I've stream lined the process.


  • First Hardware Prototype

    Charles Fried06/20/2016 at 12:47 0 comments

    1. Hardware Choice

    The choice of hardware was all fairly straight forward except for the sensors. In the image you can see a range of sensor which I've tested, ranging from £22.50 to £0.70. The piezo sensors (metal backing) which were the cheapest performed surprisingly well, however I settled for the FSR 400 series for three reasons. They're flexible, much cheaper than the Flexiforce and has very good documentation on the calculations needed to get a linear relationship between force and resistance. As for the rest of the hardware I don't think it's worth elaborating, I chose the Arduino Micro for it's small form factor and the HC4067 because it read all 16 sensors from one chip, pretty handy right?


    2. Insole 3D Modelling

    So now we've got the hardware sorted I want to explain the 3D modelling process, which was carried out in Solidworks. There's nothing particularly complicated about it but what needs consideration is the placement of the sensors and cable management.

    Prior to starting the project I read a number of papers around Bio-mechanics, Orthopedics and the design process of footwear. This is where I found the picture below (foot anatomical points) which I used to distribute the sensors. However the size of the sensor itself is too large to be placed on every point, therefore it took some interpretation.

    In the second version (pictured below) I added a stress relief for the cable. Once printed the part is left to cool down to room temperature, after which it was removed from the bed. We then place it back on the bed and heat up to 60° which allows to bend the tab perpendicular to the sole. NOTES: Once printed it must first be removed from the bed otherwise the part will stretch whilst bending due to it sticking | Temperatures are only valid for PLA

    You can find the 3D model (.stl) in the files project named insole_V2.1

    3. Assembly

    The top side turned out fairly well, I used electrical tape to keep the sensor in place for now, bear in mind this is a temporary prototype so nothing is fixed permanently.

    Even after a pedantic cable management planning process the first prototype is rather disastrous. The overlapping cables will probably cause the connections to fail during exercise, so I haven't and won't be testing this prototype during exercise. To solve this I'm looking at etching a PCB for the second prototype, if you're reading this and have a better solution please comment. :)


    3. Extra

    As a last note for this first update I thought I would also share an experiment which I won't be using but is interesting. The first version of the printed prototype was molded by re-heating it to 65°, placing in the shoe and putting my foot on it until cooled. It produced a very nice result however I decided against it for two reasons. For the data to be as accurate as possible the shoe must be as neutral as possible (flat), additionally the sensors are prone to giving false values when bent.

    Furthermore, all the lowest points on this insole (high pressure) have a sensor located more or less in the middle, which confirms they are correctly placed. However, these insole are designed for anyone to wear during diagnosis which makes for another reason not to mold them.


    Finally here's a picture of the controller itself, it's not as small as I want it to be but hopefully that can be improved in the second iteration. NOTE: the resistors in the picture below are hidden behind the HC4067Because the wiring of the FSR sensor is very well documented I won't be going into it, however I've made a quick schematic of the wiring of one sensor which can easily be scaled up.

View all 4 project logs

Enjoy this project?

Share

Discussions

icwemi52 wrote 10/04/2021 at 07:55 point

What a great idea to introduce this type of insole pressure system for mass shoes you can also visit how to fix underpronation to learn more about it.

  Are you sure? yes | no

horaso9958 wrote 05/25/2021 at 07:15 point

Great to see this post I like your idea really its impressive you can see my bestcleatsreviews project it has so mush similarities with this project.

  Are you sure? yes | no

Yonghua Tai MD wrote 02/09/2020 at 15:18 point

Charles, you are doing very interesting work. I would like to speak with you. YonghuaTai@gmail.com

  Are you sure? yes | no

Cy wrote 11/28/2018 at 11:06 point

Hi Charles!
Really cool project!

Thank you in advance! 

This project is almost the same as my thesis that I am currently working on.

 Would it possible to upload or send me the full code for the processing? 

I can be contacted in jooyeondream@naver.com

  Are you sure? yes | no

stama1605 wrote 04/29/2018 at 20:48 point

Hi Charles! This project is almost the same as my thesis that I am currently working on. Would it possible to upload or send me the full code for the processing? Thank you in advance! I can be contacted in stama1605@gmail.com

  Are you sure? yes | no

vpthoma wrote 07/03/2016 at 01:16 point

It would be useful to have the bibliography of the sources you found most useful. Thanks

  Are you sure? yes | no

Charles Fried wrote 07/03/2016 at 20:21 point

I didn't think anyone would be interested but I'll post some references in future logs. Let me know if there's anything in particular you want.

  Are you sure? yes | no

Ryan Bailey wrote 07/02/2016 at 16:09 point

Really cool project! I'm very interested in orthopedics and gait monitoring technology so this project really caught my eye. I like that you attempted to cram more sensors into the system in a more thoughtful pattern than other examples I have seen (Pubmed link: http://www.ncbi.nlm.nih.gov/pubmed/?term=pmc4541895). I agree with your comments about the wireless functionality - better to perfect the core functionality first. That being said, I estimate your data rate with 16 sensors at better than 40ms sampling period at 12(?) bits resolution to be well inside of what bluetooth can handle.

Your sensor array might be a good candidate for a flexible PCB. These tend to be very expensive, but there are some services out there that do these at an impressively low cost (compared to the thousands of dollars it was years ago). Otherwise, there are some well-documented guides out there (including on HaD) that describe how to etch your own.

  Are you sure? yes | no

Charles Fried wrote 07/03/2016 at 20:57 point

Thanks, I did pay careful attention to sensor positioning but with hindsight I'm missing some in the arch area which I'll correct in V2. 

I think you're right about the transfer rate but the limited range of bluetooth isn't ideal, perhaps Xbee is better suited for this application. Interestingly even the high end insole from Moticon doesn't allow for streaming in recording mode.

As for the PCB, according to the manufacturer of the FSR they need to be mounted on a solid surface so if I used a flexible PCB it would have to be mounted on the printed part. I have designed the circuit which I'd like to etch on some Pyralex (Kapton + Copper) according to this guide. http://www.instructables.com/id/DIY-Flexible-Printed-Circuits/

Moticon : http://www.moticon.de/

  Are you sure? yes | no

Similar Projects

Does this project spark your interest?

Become a member to follow this project and never miss any updates