Close
0%
0%

Automated LED/Laser Diode Analysis and Modeling

Analyze LEDs and LDs to create electrical (SPICE) and optical models.

Similar projects worth following
In this project, I'm building a system to automatically characterize LEDs and Laser Diodes. Datasheets often don't have the all the figures a designer might need, especially when using parts for "off-label" applications, and SPICE models are rarely included. Notably absent from almost all of them are relative efficiency curves - a requirement for driving LEDs for lowest power consumption at a given light output. In other cases (surplus, scavenged, or ebay'ed parts), datasheets may not be available at all. This system will automatically measure the I/V curves, corresponding optical output, and angular beam characteristics. From this, the system can derive relative efficiency curves and lasing and damage threshold currents (for LD's). Additionally it can create a simple SPICE model for simulation (DC analysis).

I recently found myself needing to measure response curves for LEDs for one project, and laser diodes for another. Whenever I've done this kind of measurement before, I've always wondered about building a system to automate the painstaking data collection process. So, faced with having to take a bunch of tedious measurements, I'm naturally going to spend twice as long building a system to do it automatically :-)

The system described here will capture the following data:

  • I/V curves for LEDs and Laser diodes over currents from 100uA to 1A full-scale ranges
  • Relative optical output vs current and forward voltage
  • Angular light output distribution
  • Lasing threshold (LDs only)

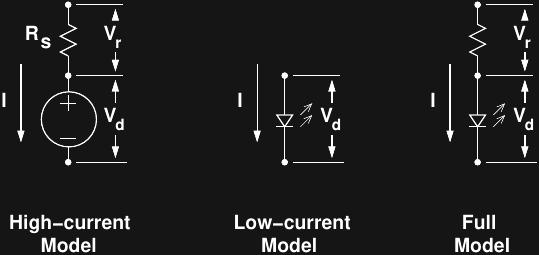
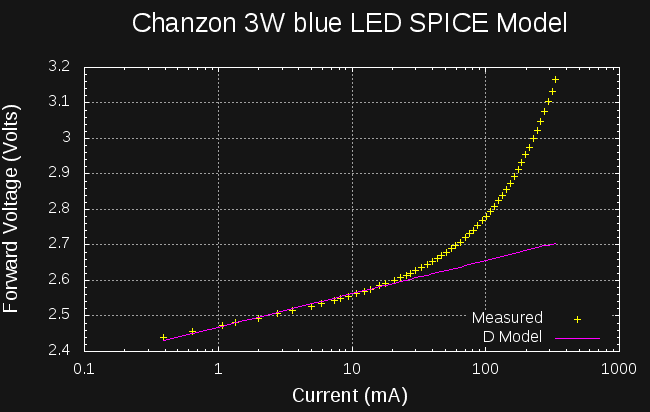
From these measurements, the system can fit the parameters of the Shockley diode equation to generate a SPICE model suitable for DC analysis (although AC and high-speed transient analysis is unlikely to be accurate, since the system won't measure capacitive effects in the diode junction). This data is also sufficient to determine the relative efficiency of devices at different current levels - required if you are trying to build very efficient lighting systems, but rarely, if ever, found on datasheets. Of course, this system could be used to characterize other (non-optical) diodes as well.

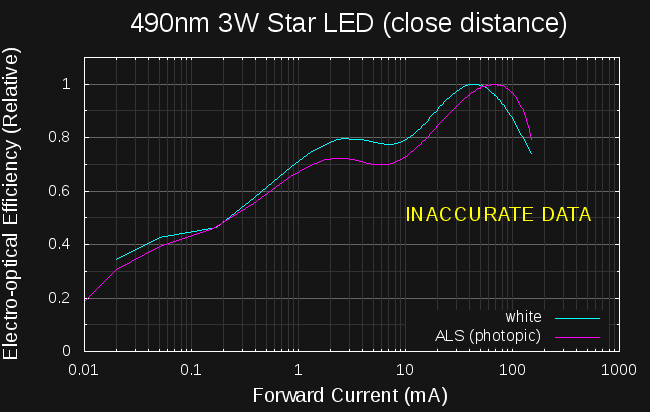
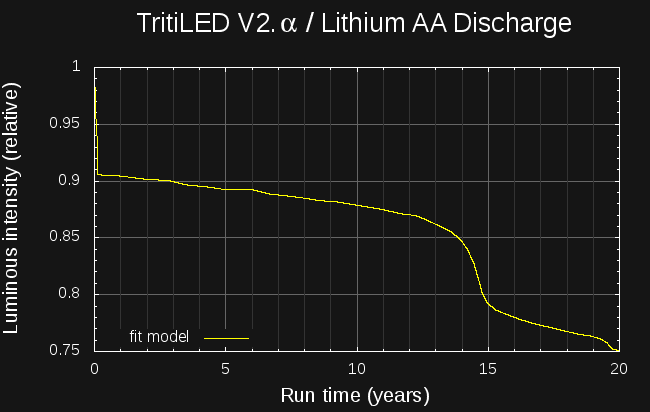
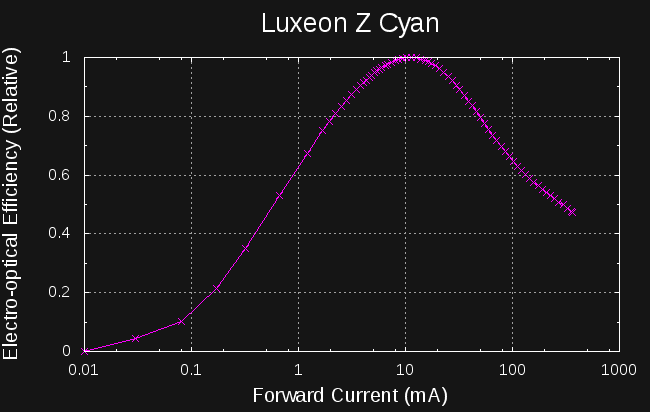
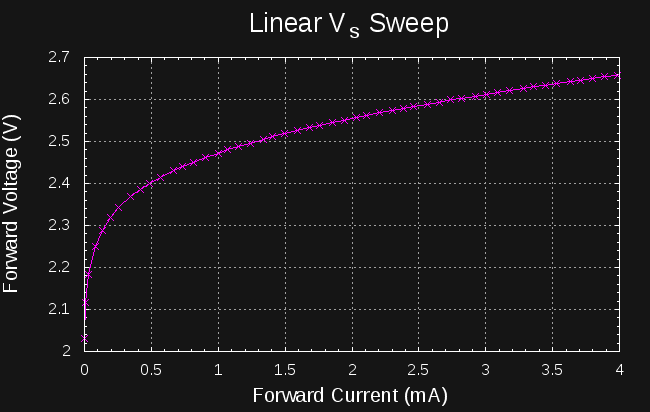
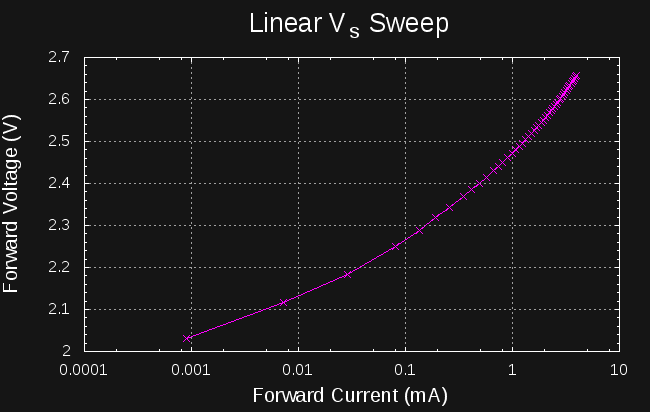
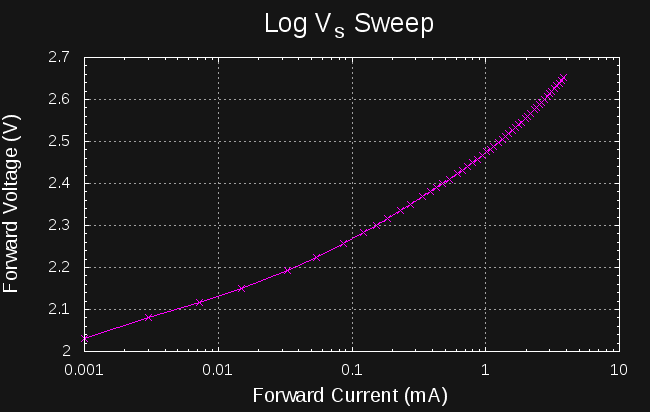
Here are two examples of the type of data I want to automatically collect:

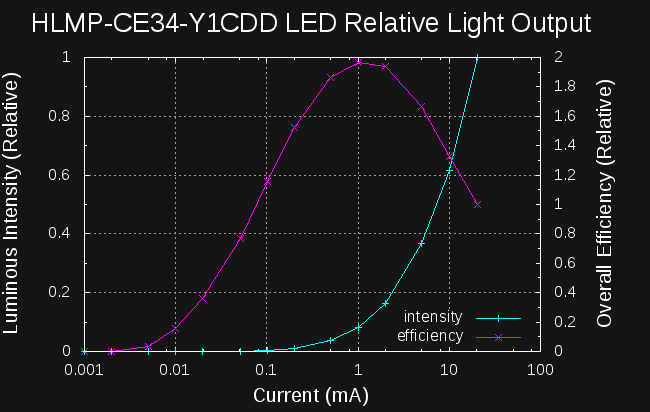
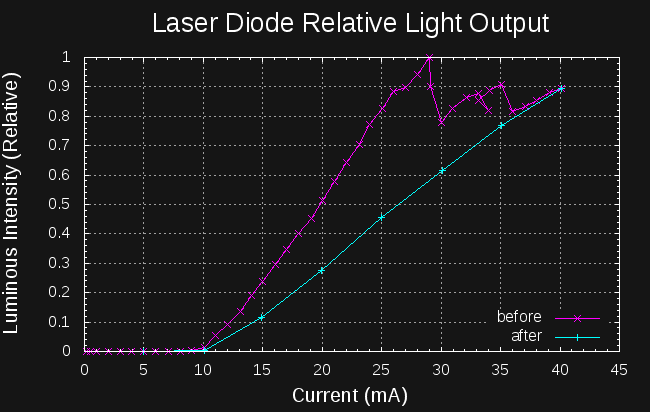
These show data collected manually using the light sensor board: on the left, the peak efficiency point for a cyan LED is easily found (2X as efficient as the recommended operating conditions), while on the right, the lasing threshold and maximum power (before and after over-stress damage) for a destructively-tested cheap ebay laser module is shown. This data is invaluable to a thorough design using these parts, but manual collection of the required data points is extremely tedious; the perfect thing for automatic test equipment.

The missing piece I'd eventually like to include is spectral measurements, but I've decided to postpone this for now.

System Design

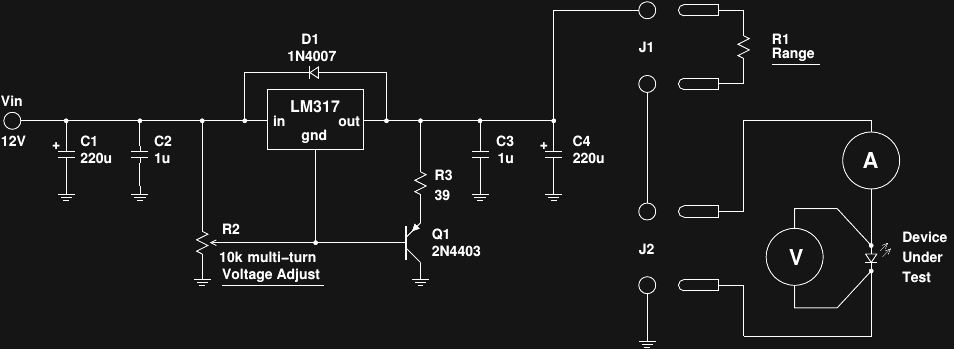
Here's a top-level block diagram for the system:

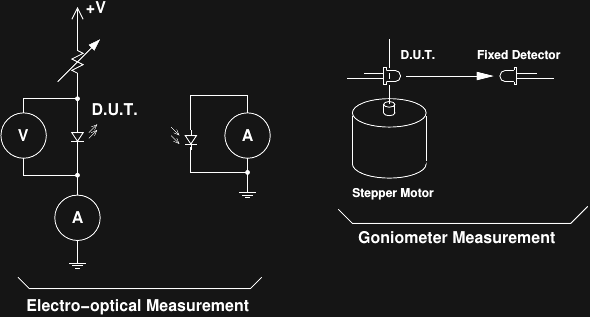
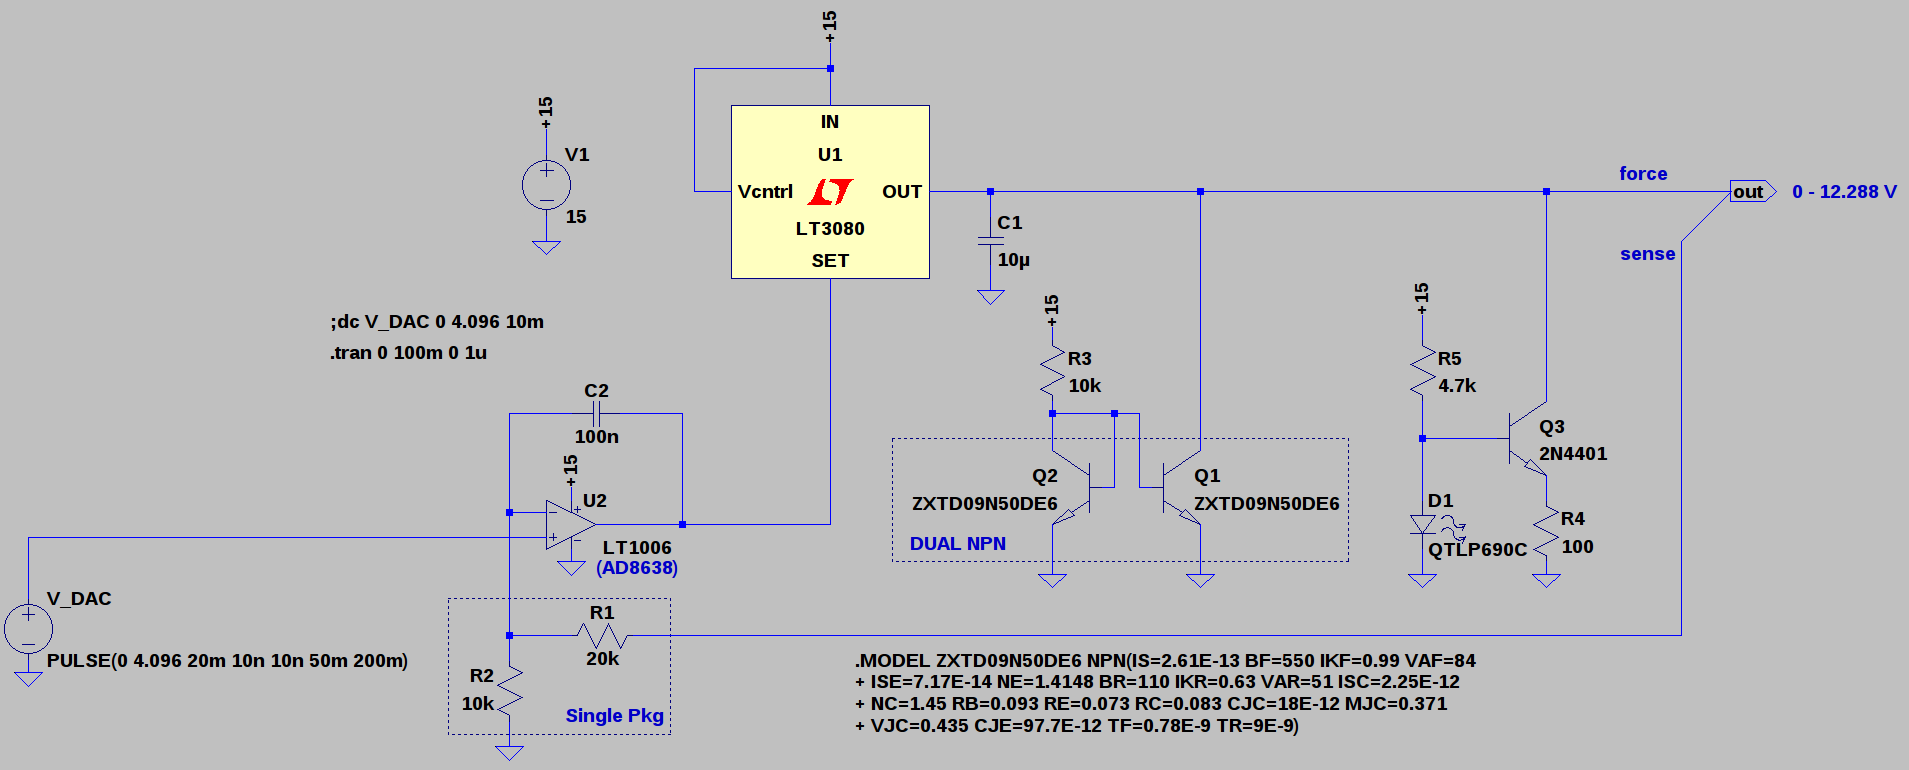
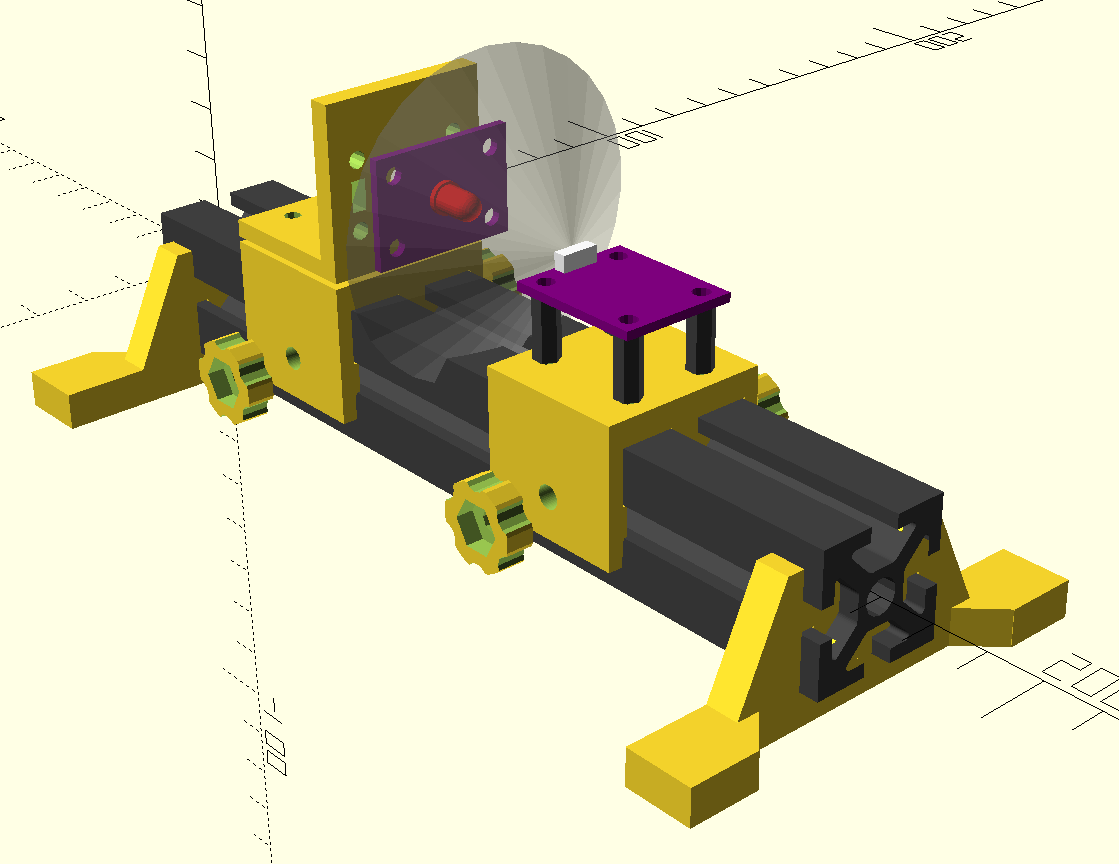
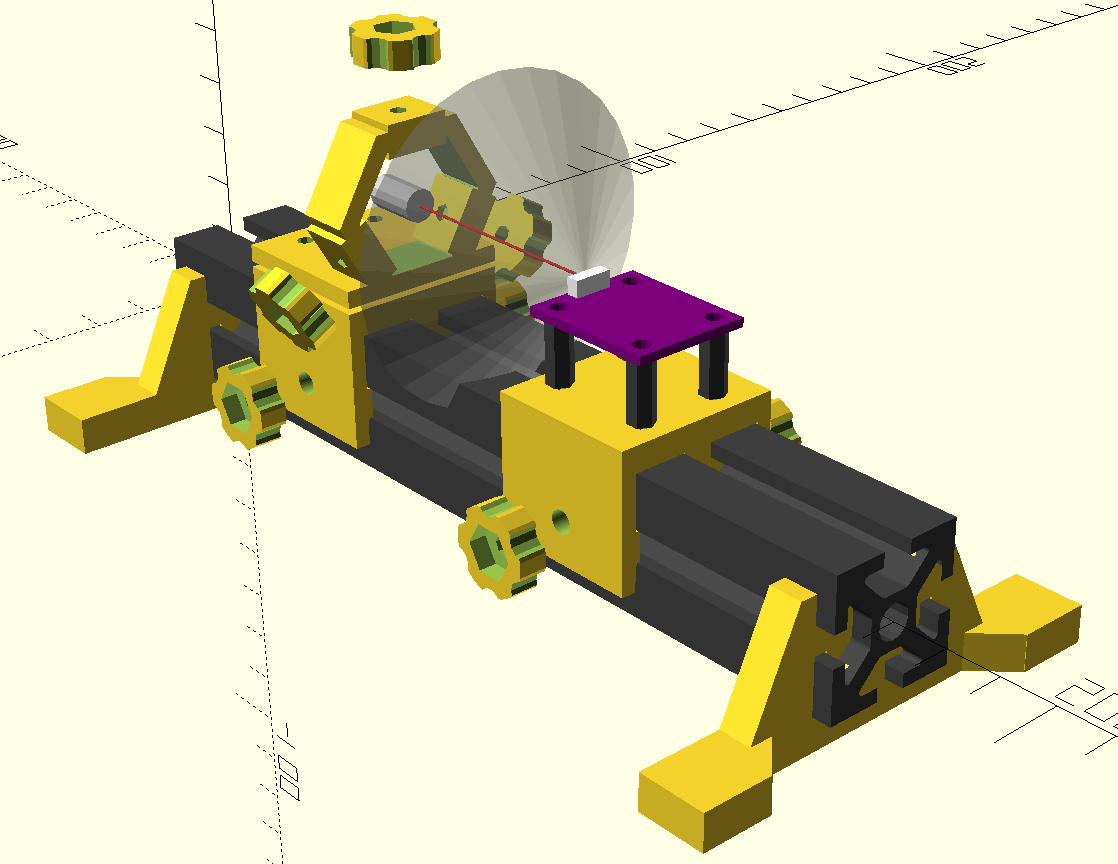
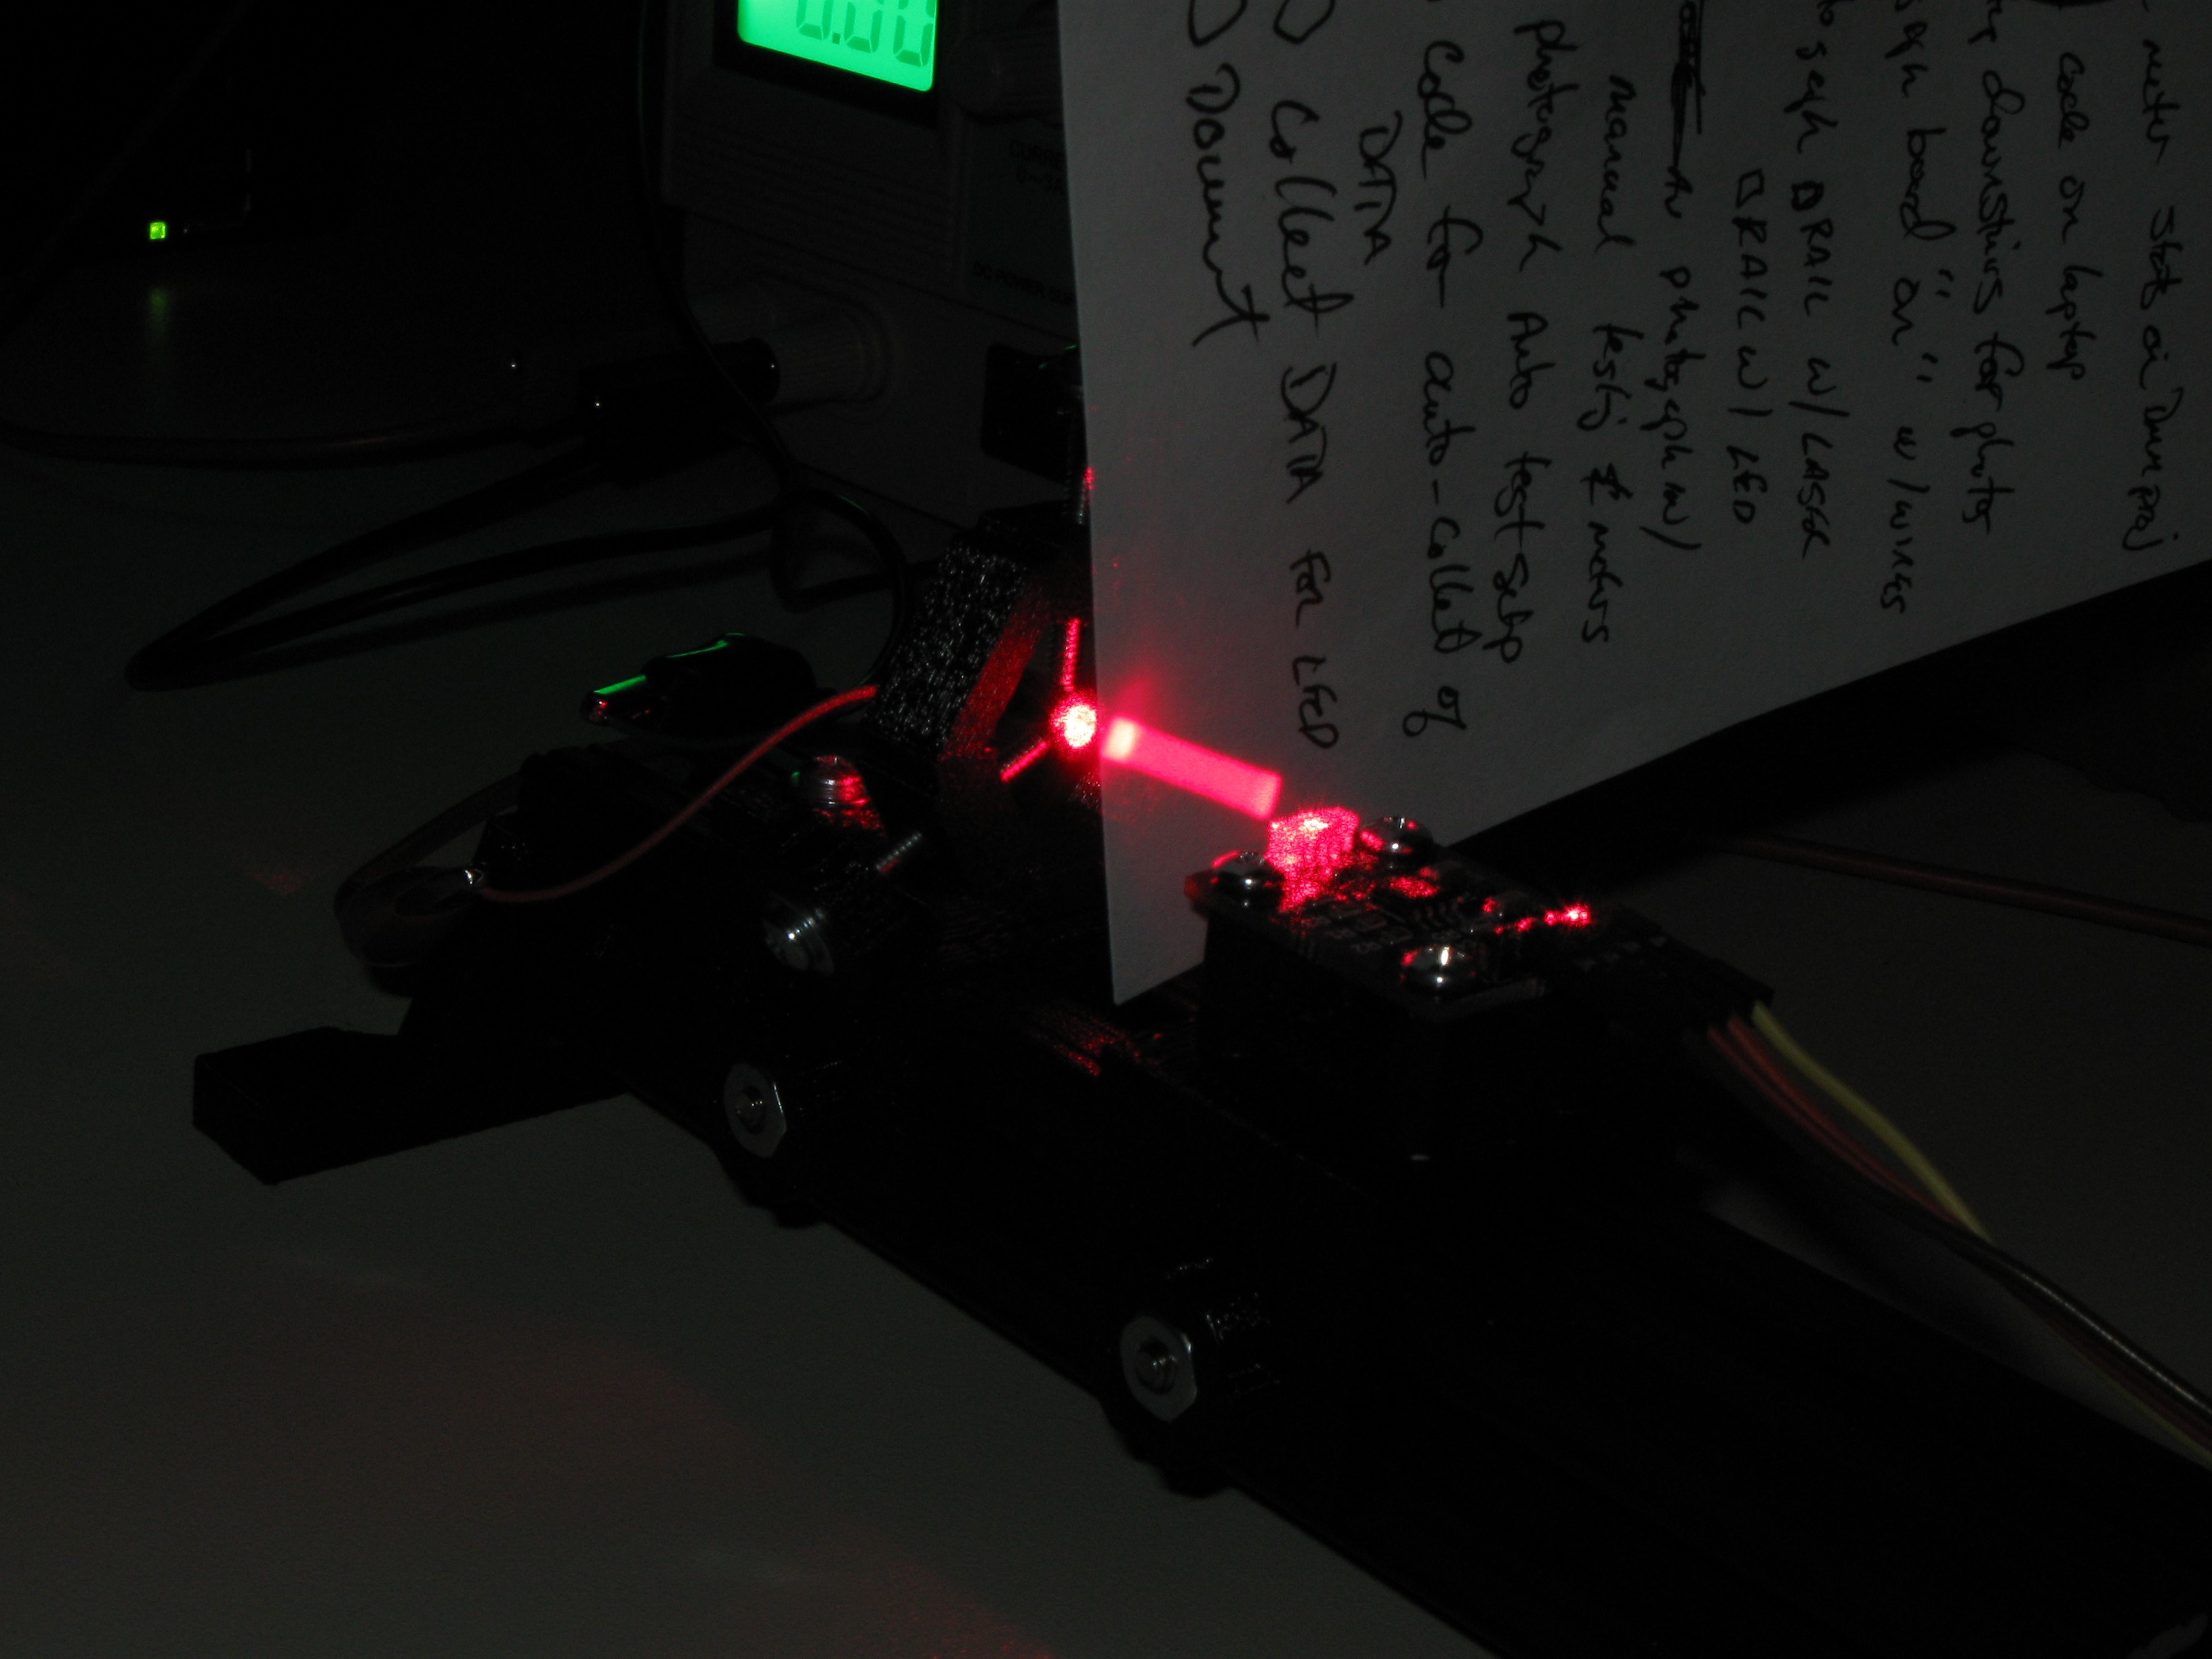
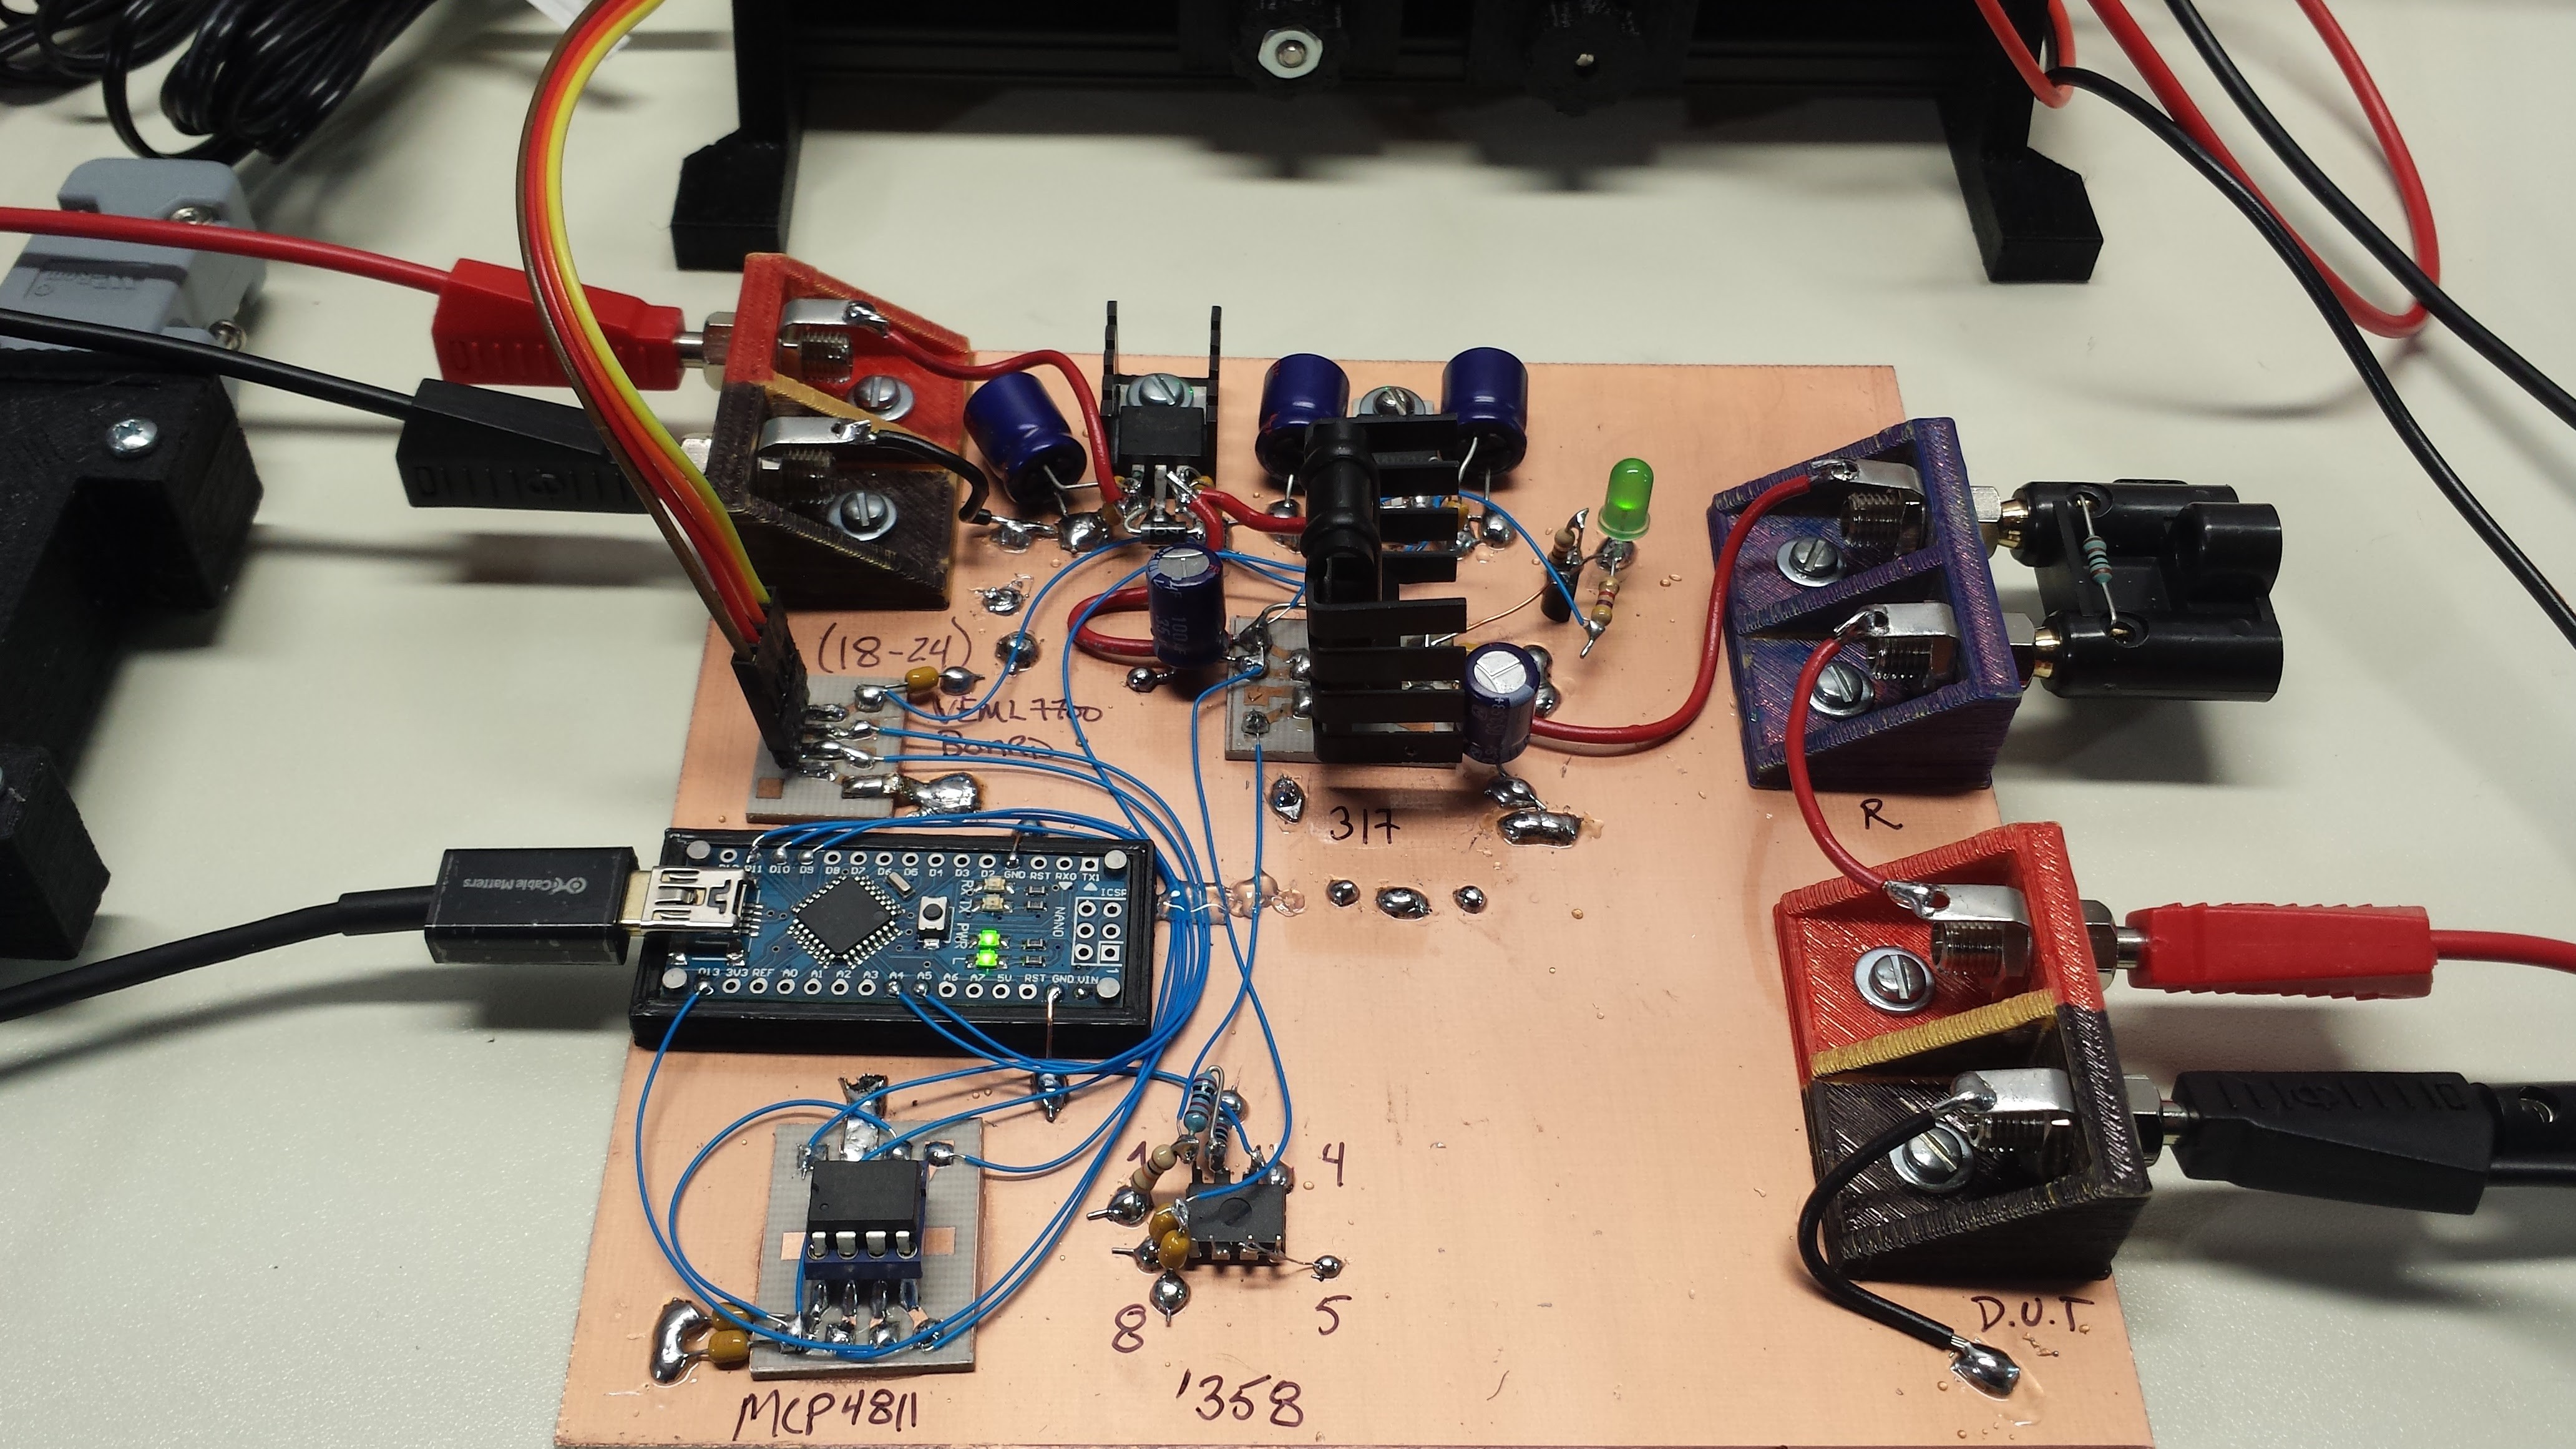
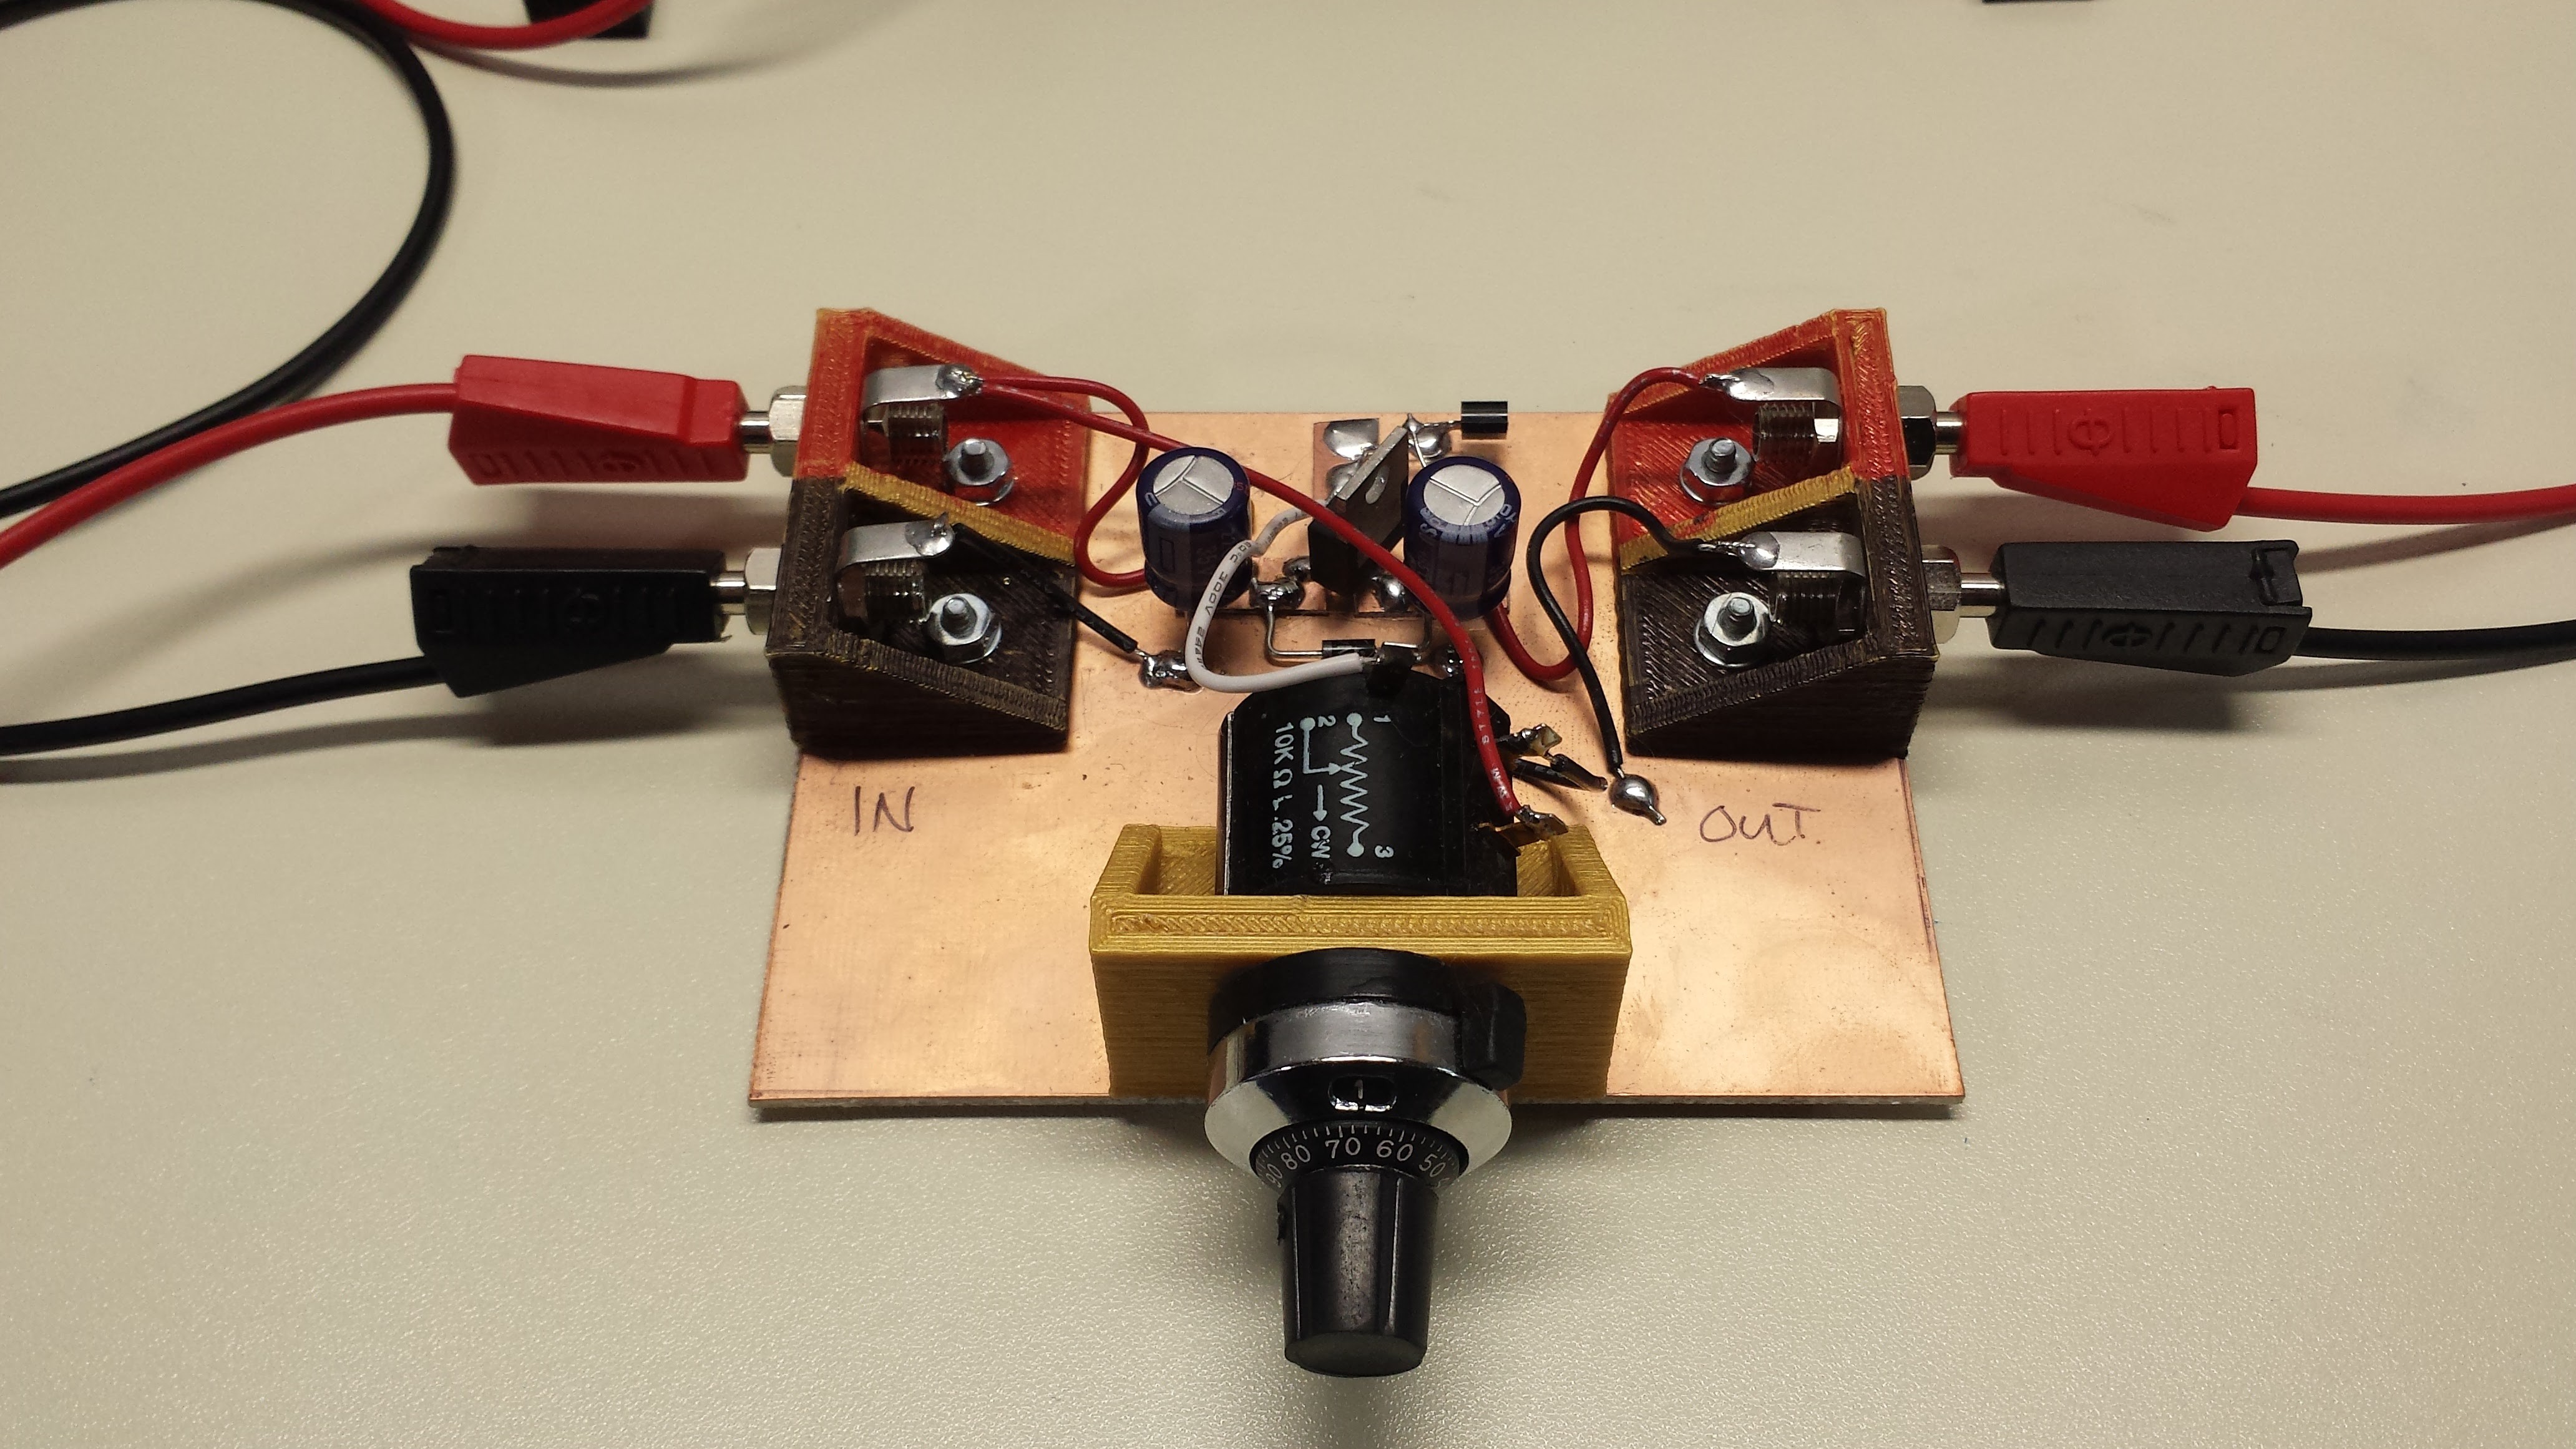
The device-under-test (DUT) is driven by a pseudo current source consisting of a variable voltage and fixed resistor (shown in the diagram as a fixed voltage and variable resistor). The DUT is optically coupled to a linear-response photometer which measures relative light output. As the current through the DUT is swept over adjustable ranges, the exact current through the DUT, the forward voltage drop, and the optical output are recorded. To capture the angular light distribution, a simple goniometer made from an inexpensive geared stepper sweeps the DUT through a series of angles while the received output is recorded. The simple 1-D goniometer planned here will work well for DUTs with radially symmetric output distributions, which covers most devices. For devices with asymmetric output, the DUT can be rotated 90 degreed to capture the distribution along a second axis, which is probably sufficient for most uses. A full 2D goniometer seems too complex for the amount of use it would see in this application.
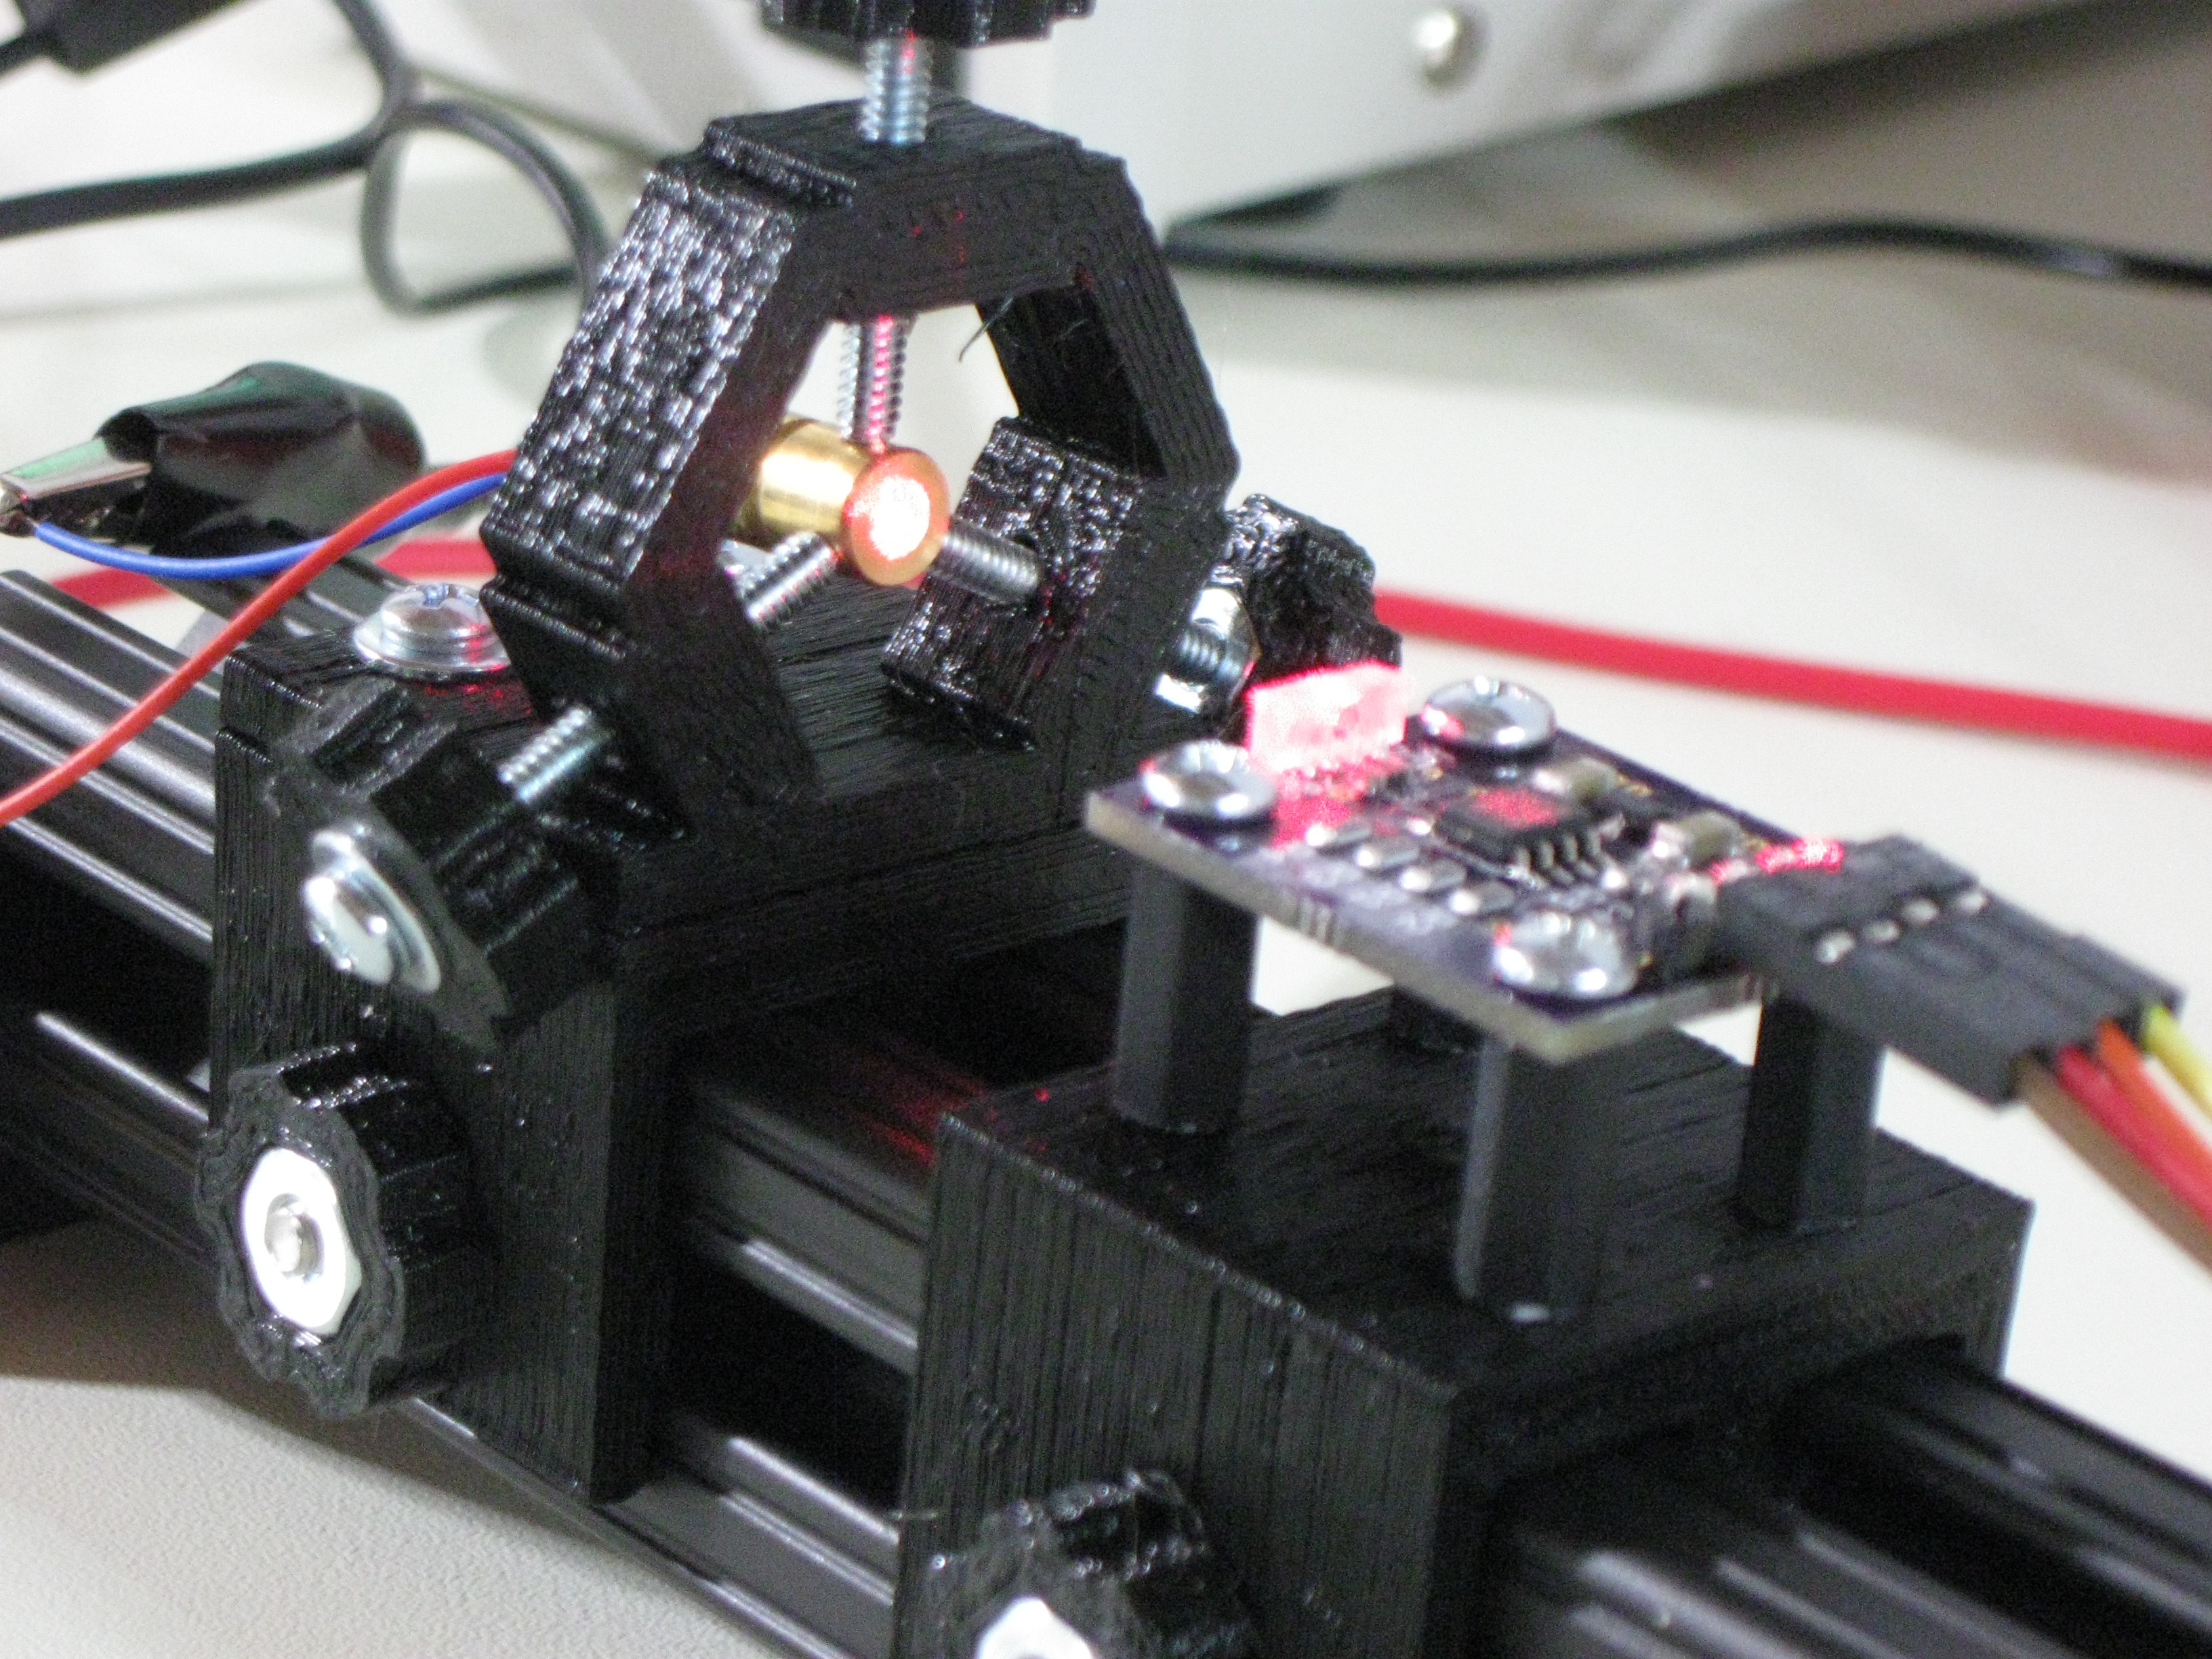
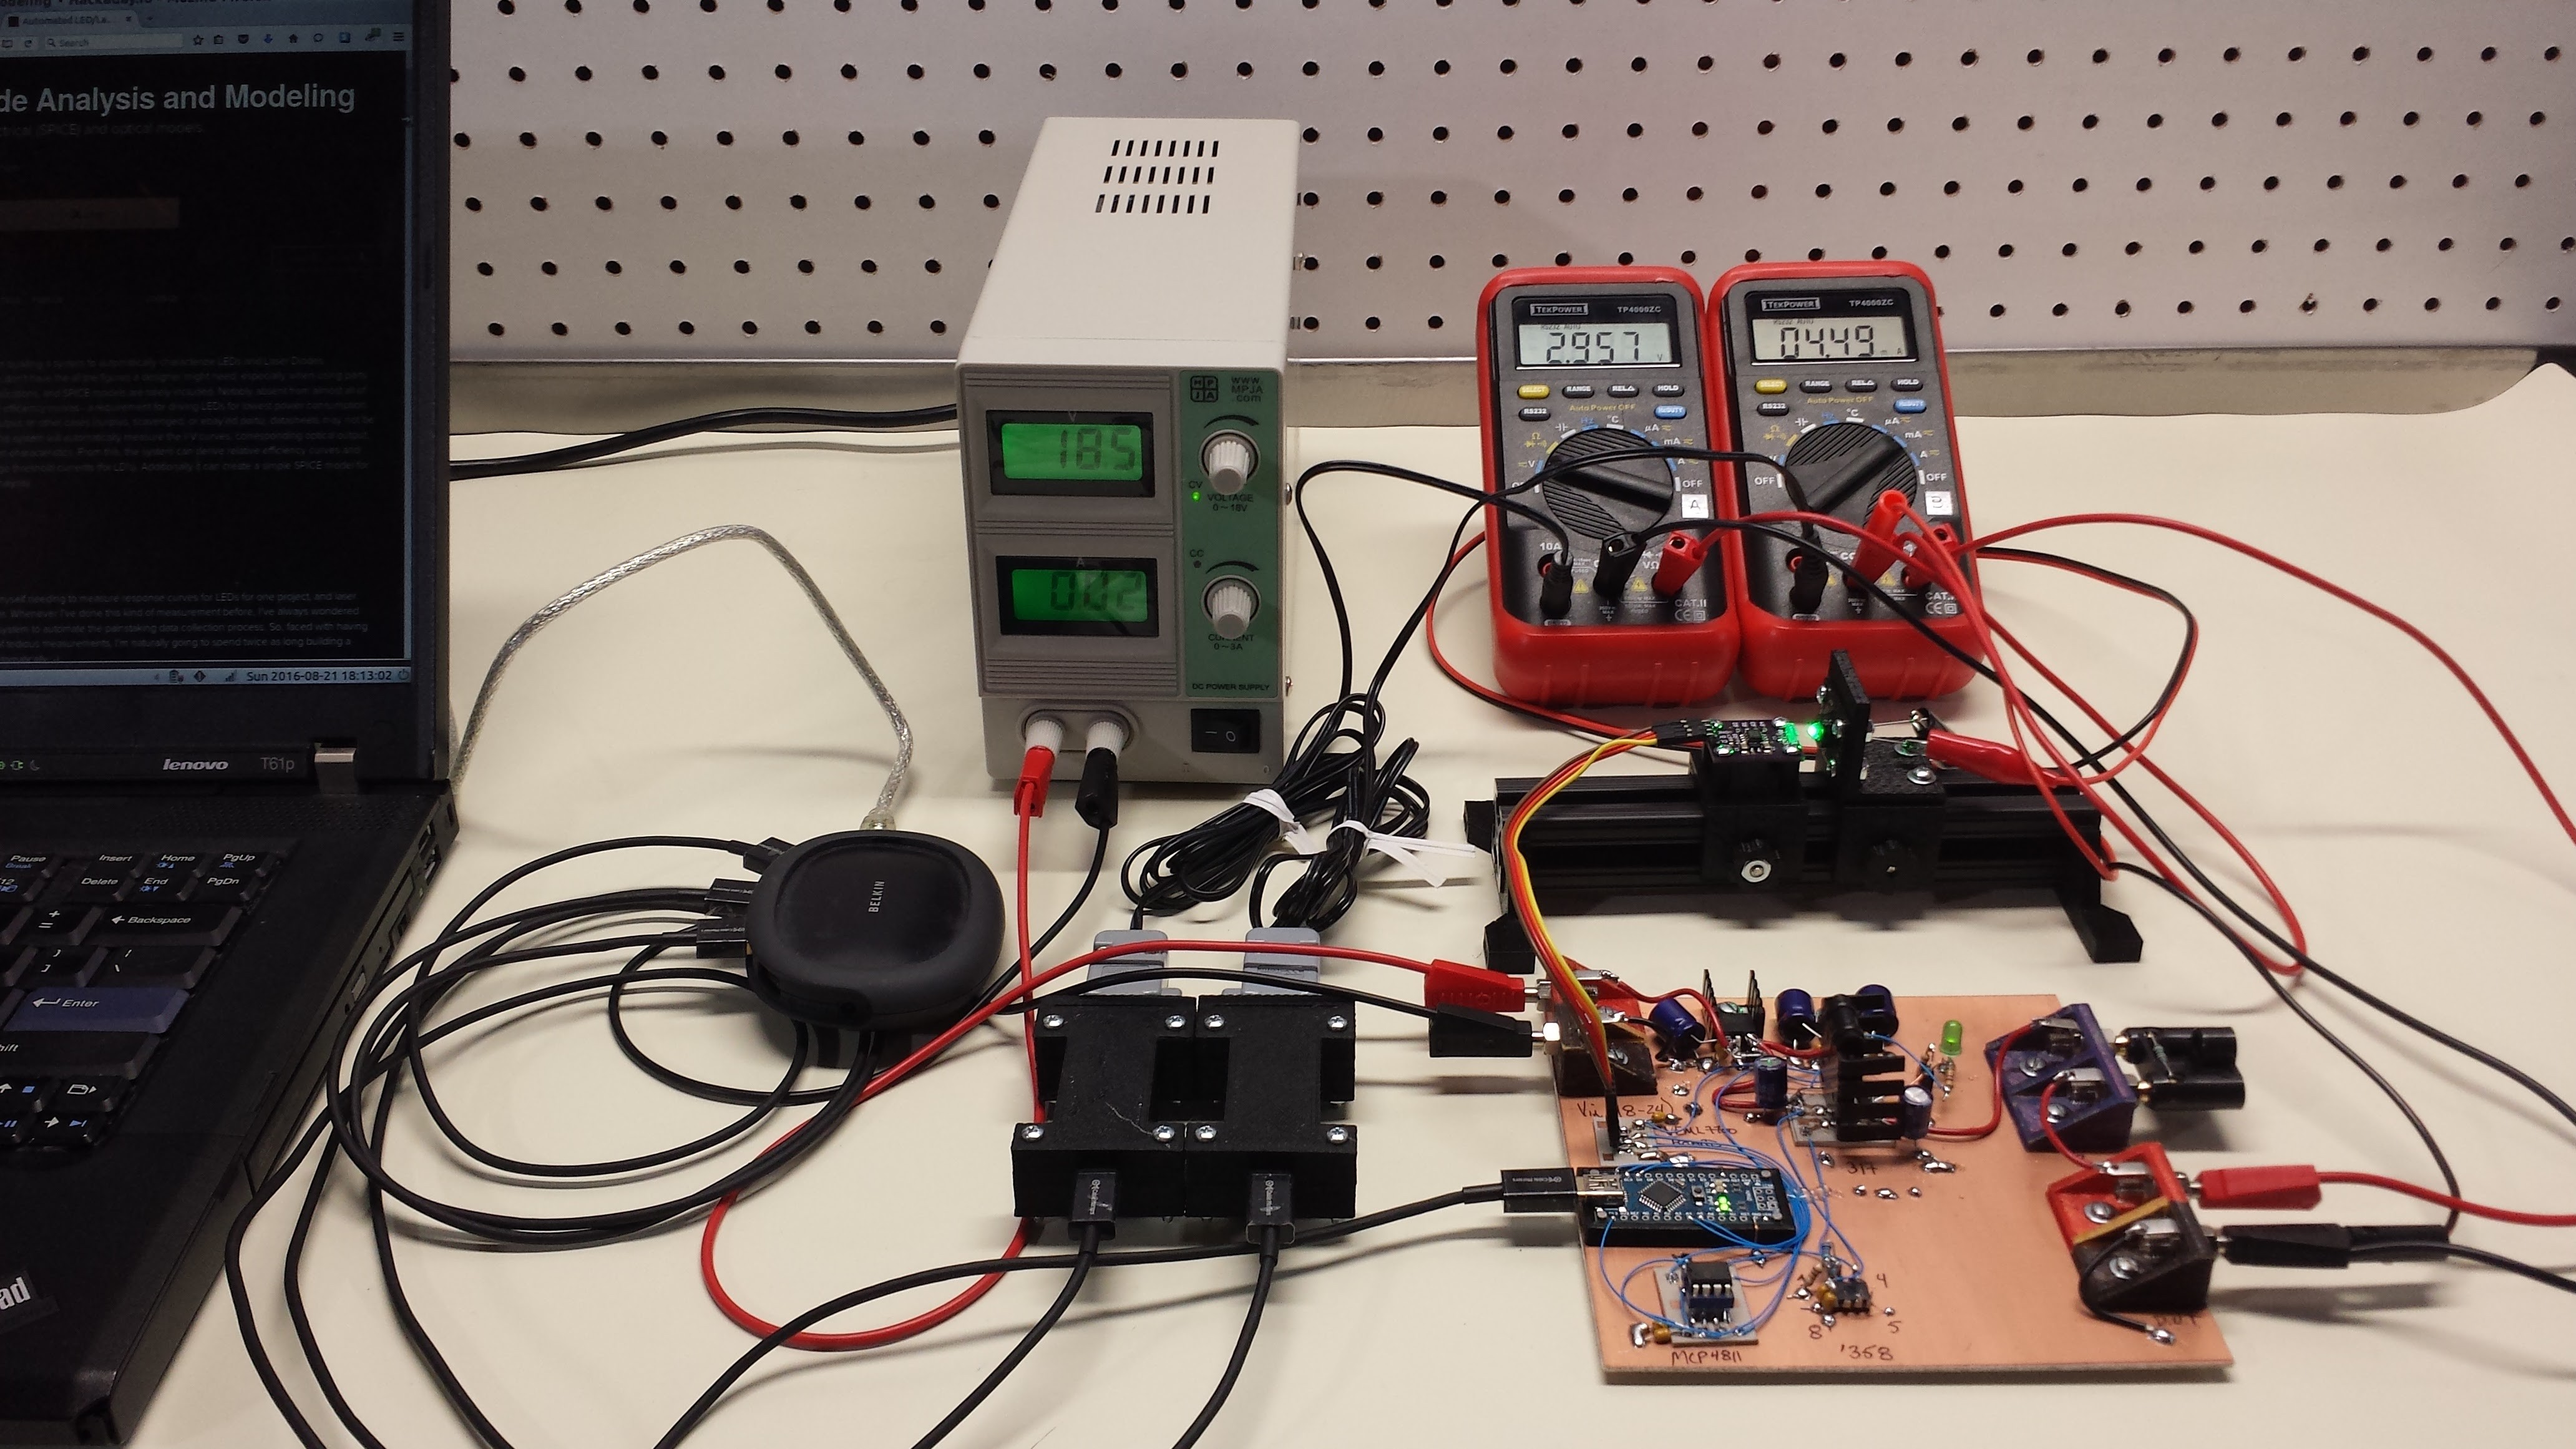
Current Status

I'm actively developing this project, and will be documenting the progress in the build logs.

proto1.pdf

Schematic for automated test proto 1 (pdf)

Adobe Portable Document Format - 15.01 kB - 08/22/2016 at 04:08

Preview
Download

manual_voltage_control.pdf

Schematic for manual tester (pdf)

Adobe Portable Document Format - 9.67 kB - 08/21/2016 at 15:25

Preview
Download

light_sensor.pdf

Light sensor board schematic (pdf) - source files in GitHub repo

Adobe Portable Document Format - 13.72 kB - 08/10/2016 at 05:14

Preview
Download

  • 1 × 7815 regulator
  • 1 × 7805 regulator Resistors (Fixed) / Metal Film
  • 1 × VEML7700 Ambient light sensor
  • 1 × VEML7700 PCB (see text for open-source design files)
  • 8 × 1uF ceramic capacitors

View all 19 components

  • Estimating SPICE Diode Models

    Ted Yapo10/31/2016 at 00:49 0 comments

    So far, I've put a lot of emphasis on the "analysis" part of the project, and not too much on the "modeling" aspect. So, here's a first cut at creating SPICE models for measured LEDs (or other diodes). As I mentioned at the start, the system only collects enough information to calculate parameters for DC (or low-frequency transient) SPICE simulation. I've come up with a method for estimating these parameters that seems fairly robust and produces very usable results. Here's an example of the model compared with actual data points measured for a Chanzon 3W blue LED:

    In this case, the data points were only collected up to about 350mA, but within that range, the fit seems very good; certainly good enough to run SPICE simulations (which should always be viewed with suspicion, anyway).

    Approach

    I've written code to model diodes from measurements on three (or maybe four) occasions over the years, and have found two things to be generally true:

    1. Non-linear fitting with the Levenberg-Marquardt (LM) algorithm can give excellent results
    2. LM fails to converge on diode models frustratingly often

    The only cure I have found for the convergence issues is to ensure the starting "guess" supplied to the algorithm is close enough to the solution. Of course, this sounds like a chicken-and-egg problem, but the answer turns out to be fairly simple - a linear model can be initially fit (without convergence concerns), then used to initialize the non-linear optimizer.

    The fitting actually takes place in three stages, corresponding to the three models shown here:

    The "Full Model" is the ultimate goal, and represents the DC diode model used by SPICE. In this model,

    the internal series resistance of the diode is explicitly modeled. The total voltage across the diode (including the resistance) is based on the current, and is modeled by:

    The first term is just a re-arrangement of the Shockley diode equation, and the second term is Ohm's law applied to the series resistance. There are three unknown parameters in this model, namely:

    • Is, the diode reverse saturation current
    • n, the diode ideality factor
    • Rs, the series resistance

    Vt, the thermal voltage ( = kT/q), is approximately 26mV at room temperature, and is assumed constant for all the data points - see below for more details.

    High-Current Model

    The first step of the algorithm is to model the diode as a fixed voltage in series with the internal resistance. For large currents, the second term (IRs) dominates the forward voltage, and the diode voltage is approximately constant. This is the regime in which we would say that a 1N4148 diode has a 0.7V forward voltage (ignoring current), for instance. The algorithm uses high-current data points to fit a simple linear model producing an estimate of Rs and (the fixed value) Vd. The following plot shows the high-current model for the blue LED shown above:

    Low-Current Model

    The next step in the algorithm is to estimate the values of n and Is using the low-current measurements. The LM algorithm is used to fit the first term in the above equation, initialized with a value of 1.5 for n (which is almost always between 1 and 2), and an initial Is value derived from the fixed "diode voltage" found in the high-current model. Fitting this simpler model with a good initial guess seems to be fairly robust. Here is the result (shown on a log current scale) for the estimated low-current model for the same blue LED:

    Full Model

    The two initial models provide decent estimates of Is, n, and Rs, which are then used as starting guesses to initialize the LM algorithm for optimizing all three parameters simultaneously. In practice, this procedure seems to work pretty well; I've tried it on 16 different LEDs so far, and it has always converged, and produced good-fitting models.

    One more trick is used to facilitate convergence. The number of points used for the two initial estimates are varied in a loop, and the result with the lowest overall error is used. Typically, most initializations converge to exactly...

    Read more »

  • Programmable Voltage Source 2.0

    Ted Yapo10/04/2016 at 15:07 6 comments

    I re-designed the programmable voltage source used in the analyzer; the new version could easily find use as a general-purpose computer-controlled lab supply. Here's a simulation of the back-end, ignoring the DAC and voltage reference for the moment:

    The first prototype used a 10-bit DAC driving an LM317 to produce a 1.25 - 13.54V supply with a 12mV/LSB steps. There were a handful of things I didn't like about it:

    • Some measurements would benefit from finer steps than 12mV/LSB
    • The whole system ran open-loop, so that the voltage accuracy was at the mercy of the LM317 reference drift as opposed to the 4.096V reference voltage
    • The LM317 imposed a minimum output voltage of around 1.25V, too high for easy testing of some non-optical diodes (e.g. switching diodes, Ge diodes, and Schottky's)
    • The LM358 added its 3mV (x3) offset error to the output

    The new version uses an LT3080 regulator as the output driver. Like the LM317, the LT3080 provides convenient thermal and current limiting. Additionally, the LT3080 is adjustable down to zero volts output, and can be paralleled for more output current. Of course, this all comes at a price, but for my purposes, it's still a better deal than a similar circuit built from discretes. The regulator supplies a current reference and is designed to be adjusted with a resistor, but driving with a reference voltage also works.

    The schematic shown above starts with the 0-4.096V output of the DAC. I'm currently considering a MAX5216 16-bit DAC and a MAX6162 4.096V reference; they're "gold-plated" parts in this application, and they successfully push the accuracy problems elsewhere. The output of the DAC is amplified 3x by U2 to a 0-12.288 level, yielding 187.5uV LSB steps. the INL of the MAX5216 is +/- 4LSB max (1.2 typ.) for a worst-case 750uV linearity error (225uV typ). The worst-case offset error is comparatively lousy at +/- 1.25mV, but this could be calibrated out should we care to do so, because the offset drift is only +/- 1.6uV/K (typ). Likewise, the initial 0.02% tolerance of the MAX6162 reference is redeemed by the maximum 3ppm/K drift.

    I simulated the circuit with an LT1006 op-amp, but I'm planning an OPA191 in this position - the schematic also shows an AD8638 auto-zero amp as a possibility, but this is probably overkill. The LT3080 requires a minimum 0.5mA load to maintain regulation, so the Q1/Q2 pair operates as a current mirror to draw about 1.5mA from the supply over the entire output range. To avoid any chance of thermal runaway, I've selected a dual transistor package for close thermal couping between the two devices; it also will save space on the board. The transistor match isn't guaranteed, but a precise current isn't required here.

    R1 and R2 control the output voltage ratio, nominally set to 3x for a 12.288 V maximum output. I've initially selected an inexpensive resistor array for these elements to reduce the relative temperature coefficient. The initial relative tolerance isn't great at 0.05% (equal to 8.2 mV full-scale error after the ratio is considered), but this could be calibrated out. The ratio drift would be more difficult to calibrate: the ratio has a 15ppm/K temperature coefficient, for about 250uV/K full-scale drift. It certainly seems like the ratiometric tempco of these resistors is currently the limiting factor in the accuracy of the design; unfortunately, lower tempco resistors get expensive fast.

    Adding to the resistor tempco problem is that R1 dissipates twice as much power as R2, causing a differential temperature increase. This is somewhat mitigated by the thermal coupling afforded by the common package, but could be reduced even further by using three 10k resistors in an array. Two 10k resistors in series could be used for R1, with each dissipating the same power as R2. I'm going to have to look for some high-precision, low-tempco 10k resistor arrays for the final version. It doesn't feel right to spend more on resistors than precision op-amps, but if that's the limiting...

    Read more »

  • The case of the two-humped LED

    Ted Yapo09/15/2016 at 17:30 5 comments

    I have been evaluating some new ebay/amazon/aliexpress LEDs; it's a good excuse to put some mileage on the existing analyzer prototype while I wait for parts. These LEDs look like the old Luxeon Emitters:

    but, of course, come with no datasheets. They're supposedly 490nm (peak or dominant is unknown), rated for 1W or 3W, and that's about all the data I have. But, they're cheap - $0.33 (qty. 100) - and have a large die area and wide viewing angle. I picked up some blank aluminum "star" boards, soldered a few LEDs on, and ran some tests. Here's what I found for the efficiency curve:

    The two curves are made with the VEML7700's "ALS" and "white" sensors. The ALS sensor has a spectral response very closely matched to the human eye's photopic response, while the white sensor has a relatively flat response across the visual spectrum. I'd expect there to be a difference between the two curves here since InGaN LEDs (especially the green ones) show a wavelength shift with current (shorter wavelengths at higher current - "blue shift," they call it). This "490nm" LED is right on the maximum slope of the ALS response curve; any wavelength shift with temperature would show up as an erroneous brightness difference - the ALS response should disproportionately more dim at higher currents, pushing the efficiency peak to the left. But, the curves above are exactly opposite. I recognized this as a problem right away.

    The second issue, although more obvious, didn't bother me much at first. There are two efficiency peaks, one at maybe 2-3 mA, and another at 40-70 mA. I was a little surprised that the major peak was at such a high current, but not being a semiconductor physicist, I figured at first this was just the nature of these LEDs. I looked around the openly available LED research literature for an explanation, but couldn't find any. Eventually I started to suspect the VEML7700 sensor. It turns out that there is only one peak after all, but it look a while to figure it all out.

    VEML7700 Linearity

    The VEML7700 datasheet and applications literature state that the raw values are linear up to 10,000 lx, and can be well-corrected using a supplied polynomial up to 120,000 lx. I checked the lx values for the curves above and found I was measuring over 500,000 lx at the high end. Oops. But, this got me thinking - I never did test the linearity of the sensor. How do I know it really is linear even up to 120 klx as the literature states?

    How to measure the linearity of the sensor? The light from LEDs is not linear with current (that's the whole point of this project). I briefly considered using measured distance to attenuate a fixed light, but thought it would be too error-prone. I finally remembered that I had some theatrical gel filters around.

    I happened to have a few sheets of Roscolux #97 and #98 filters, neutral density filter sheets with 50% and 25% nominal transmission. These filters are made for theatrical and photographic lighting, so are cheap and readily available - they also sell a small swatchbook with samples of dozens of different colors that makes for some nice opto-hacking. I decided to use these filters with a fixed light source to test the linearity of the VEML7700 sensor.

    Of course, since the filters are made for photographic lighting, they have a fairly wide tolerance - it's actually unspecified. I figured I couldn't count on knowing the absolute transmittance of the filters, but probably could rely on a consistent transmittance of sections of filter cut from the same area of the same roll. I made up some filters by stacking a variable number of sheets of either 97 or 98 filter material in 35mm slide mounts (what else can I do with my old slide mounts in 2016?!):

    I marked the mounts with the expected nominal transmittance, but don't rely on this estimate in the calculations, as explained below. There are additional losses due to reflections at the filter surfaces, but I figured that would also scale with the number of filters, since...

    Read more »

  • Temperature, Efficiency, Hackaday, and Prize 2016

    Ted Yapo09/11/2016 at 19:02 1 comment

    I was recently humbled to learn that this project was chosen as a semifinalist in the Automation round of the 2016 Hackaday Prize. I'd like to thank everyone associated with Hackaday for making this project possible, and of course for selecting it. The truth is, I would probably have never started this project without the hackaday.io site, as this is basically a spin-off roughly inspired by some of the comments on hackaday.com when #TritiLED was discussed on the blog. I wasn't sure what to expect when I started putting projects on here, and it's been a pleasant surprise to find that it somehow moves projects forward. Thanks, really.

    That reminds me - this project was discussed on the blog about 48 hours ago. Thanks to [Brian] for the exposure and kind words in the write-up. As usual, the comments have provided some interesting feedback and ideas; I'll address some of them in this log entry.

    LED Stuff vs. Temperature

    [rnjacobs] asked if the temperature dependence of the LED characteristics could be measured with this setup. I was aware of the temperature effects before starting this project, but a bit daunted by the prospect of determining the LED die temperature. I had thought of measuring ambient temperature or mounting a thermistor in close thermal contact to the LED thermal pad (when available), but this didn't seem too satisfying. I also thought about the various available sensors - integrated I2C or SPI sensors, thermocouples, thermistors, diodes, IR thermometers ... wait, diodes? The LED is a diode with a repeatable, if unknown, temperature dependence. Maybe the LED can be used to measure its own temperature. Here's the plan:

    1. Calibrate the LED as a temperature sensor. I've made thermometers from 1N4148 diodes before: their Vf changes about -2 mV/K. For reference, the Luxeon Z LED lists -2 to -4 mV/K. I don't think it's safe to assume a linear temperature dependence over any significant range, so the Vf vs T curve probably has to be calibrated over the entire range of interest. The idea would be to choose a low forward current, say a few hundred uA, that produces a reasonable forward drop but doesn't cause appreciable self-heating in the LED. The variation of Vf with temperature can then be calibrated by measuring it at a set of known temperatures measured with a known sensor in thermal equilibrium with the LED. The expensive way to do this is by setting test temperatures in a thermal chamber, but I've used a much cheaper method before for similar tests, as discussed in cheap temperature sweeps. To get a set of calibration data for the LED, it would be coupled to a large thermal mass along with a temperature sensor - maybe stick both of them in a cup of sand. The thermal mass is then heated above or cooled below ambient temperature and allowed to equilibrate. Once the temperature has stabilized, the mass is insulated (for example, by wrapping in foam), and allowed to slowly drift back to room temperature. As the temperature drifts, data for the LED's Vf vs temperature can be collected. Now, the LED is a temperature sensor.

    2. Find the thermal time constant of the LED-die-to-ambient. Since we will calibrate the LED as a sensor only for a fixed, small forward current, we can't use Vf measurements at arbitrary currents to infer die temperature. Instead, we need to take measurements of Vf and optical output at the arbitrary test current, then switch to the small calibrated current to measure temperature. Of course, in the time we've taken to switch current and make the measurements, the die has cooled off somewhat. It may be possible to estimate what the initial temperature was by measuring the temperature at a series of times, then extrapolating backwards. A similar method is used by forensic examiners to determine time of death by measuring body temperature over time.

    Of course, this is an idealized model; the time constant for the die-case coupling is likely to be much shorter than that for the case-pad, pad-heatsink or...

    Read more »

  • It's not just for diodes, anymore...

    Ted Yapo09/03/2016 at 04:51 0 comments

    It turns out the analyzer, along with a pair of battery models I derived from datasheet graphs, can be used to predict the run-times of ultra-low-power devices. Here's the expected brightness of the latest design TritiLED glow marker run from a pair of lithium AA batteries over the first 20 years of battery life:

    In the last log, I used the first analyzer prototype to find the electrical-to-optical efficiency curve for the Luxeon Z LED used in the #TritiLED project. Based on this data, I was able to design a new LED glow marker circuit that uses less than half the current of the first version, while maintaining the same brightness (actually, it's a little brighter). The circuit runs for two years on a CR2032 lithium coin cell, and as shown above, for 20 years on a pair of AA lithium batteries (LiFeS2 AA cells are rated for a shelf life of 20 years, which is where I stopped the model; otherwise, the lifetime would easily exceed this period). The two-stage discharge of the LiFeS2 chemistry (evident as the step between 14 and 15 years) is explained in Energizer's Application Manual and accurately captured by the model.

    Predicting Battery Lifetime

    Predicting runtime for nano-power devices is a complex subject. Since battery voltage changes as capacity is consumed, and device current drain is a function of battery voltage, simple back-of-the envelope calculations can only be so accurate; after that, a better model for the components involved is required. One half of the equation is the battery performance. In a recent log on the #TritiLED project, I presented a model for lithium primary batteries (LiMnO2 / LiFeS2) suitable for use in low-drain simulations. The model estimates the battery voltage as a function of used capacity. The other half of the simulation is a model for the circuit current drain vs supply voltage. Given these two models, a numerical integration can estimate battery life.

    The following snippet of python code illustrates the idea. The battery model predicts the supply voltage at each timestep, then the device model estimates the current draw at this supply voltage. Finally, the battery model is updated with the capacity (amp-seconds) used during the interval. The simulation continues until the battery is dead (capacity is reduced to zero, or maximum lifetime exceeded):

    # integration time step in seconds  
    timestep = 3600 * 24
    t = 0
    while not battery.dead():
      voltage = battery.voltage()
      current = device.current(voltage)
      print t/3600, voltage
      battery.use_amp_seconds(current, timestep)
      t += timestep
    

    There are a number of limitations to the battery model, which is only valid for small current drains, and neglects the effects of extreme ambient temperature, but within these constraints it seems to yield reasonable results.

    So, given a low-current device, how can we model current drain vs voltage? As it turns out, the analyzer can produce a model of the current drain vs supply voltage for an arbitrary circuit. As a test, I connected a #TritiLED prototype (right) to the analyzer (left) with no resistor at R1:

    With this setup, I collected the following data for current draw vs supply (battery) voltage:

    The "model" curve is a polynomial fit I used to filter noise and interpolate the data points. For modeling the effects of battery internal resistance, an appropriate resistor could be re-inserted at R1. Combined with a battery model, this type of curve allows the runtime of general low power multi-year battery-powered devices to be predicted. With a better battery model suitable for high-drain devices, this method could be extended to any battery-powered circuits.

    Predicting Brightness

    While the above analysis is applicable to any battery-powered device, the analyzer is also capable of measuring relative luminous intensity (i.e. brightness) - so any light output from the device can also be measured and subsequently modeled. To predict the brightness of the latest TritiLED glow marker over the battery life, I optically...

    Read more »

  • *This* is why I am building the analyzer

    Ted Yapo08/25/2016 at 21:22 2 comments

    Here's the relative efficiency of the cyan Luxeon Z led at various currents. The datasheet shows most parameters for a forward current of 500 mA, and lists 1000 mA as an absolute maximum. I only tested to 350 mA so far, but even here, the LED is operating at less than half of its maximum efficiency. The peak efficiency is right around 10 mA. On the #TritiLED project, where I'm trying to run nighttime LED glow markers for years on lithium coin-cells, this is critical information. And it's not found anywhere on the datasheet.

    New Optical Rail Components

    I made up a few more printable parts for the optical rail system. What a difference this makes compared to using cardboard, tape, and hot-melt-glue to rig up tests! If the sensor is overpowered by the LED, you can just move it back a few cm, and everything stays aligned.

    One of the new brackets has a slot for a Saber Z1 aluminum carrier board. This is a convenient way to test the Luxeon Z LEDs at high current, since the aluminum substrate dissipates much more heat than the vias on my test PCBs. I stuck on a lousy "RAM heatsink" and temporarily clamped the aluminum board in place for measurements. Conveniently, the aluminum boards have two pads each for the anode and cathode connections, so I took advantage and wired it up Kelvin-style.

    To keep things cool, I printed a mount for a 50mm fan. It's an unusual thing to see in an optics setup, but really helps in this case. The LED here is operating at the efficiency peak of 10 mA.

    Test Boards

    My first batch of test boards arrived from OSH Park today. Some of these will have to wait until the next iteration of the analyzer board, but I'll probably learn something from testing a few with the current prototype.

  • Kelvin Connections / Minimum Voltage / Log Sweeps

    Ted Yapo08/23/2016 at 19:46 0 comments

    I made up a Kelvin-style 4-wire test lead for 5mm LEDs. In a Kelvin measurement, two wires carry the current to the D.U.T., and two are used to measure the voltage. This prevents resistance of the wires themselves from interfering with the measurement. It's probably only important when measuring diodes at high currents to get a good estimate for the series resistance of the junction.

    The cable is made from a 2-position socket with two wires crimped into each connector, then broken out into banana jacks at the other end. I picked up a large box full of chassis-grounding jacks several years ago on ebay - they were super cheap because some of them are missing a nut or solder lug. I rarely used them before, because they aren't insulated, and are only good for grounding metal chassis. Until I got a 3D printer, that is - now I just print an insulating mount for them, and indicate the polarity with Sharpie markers.

    The SMD-LED test boards I designed also have Kelvin-like connections:

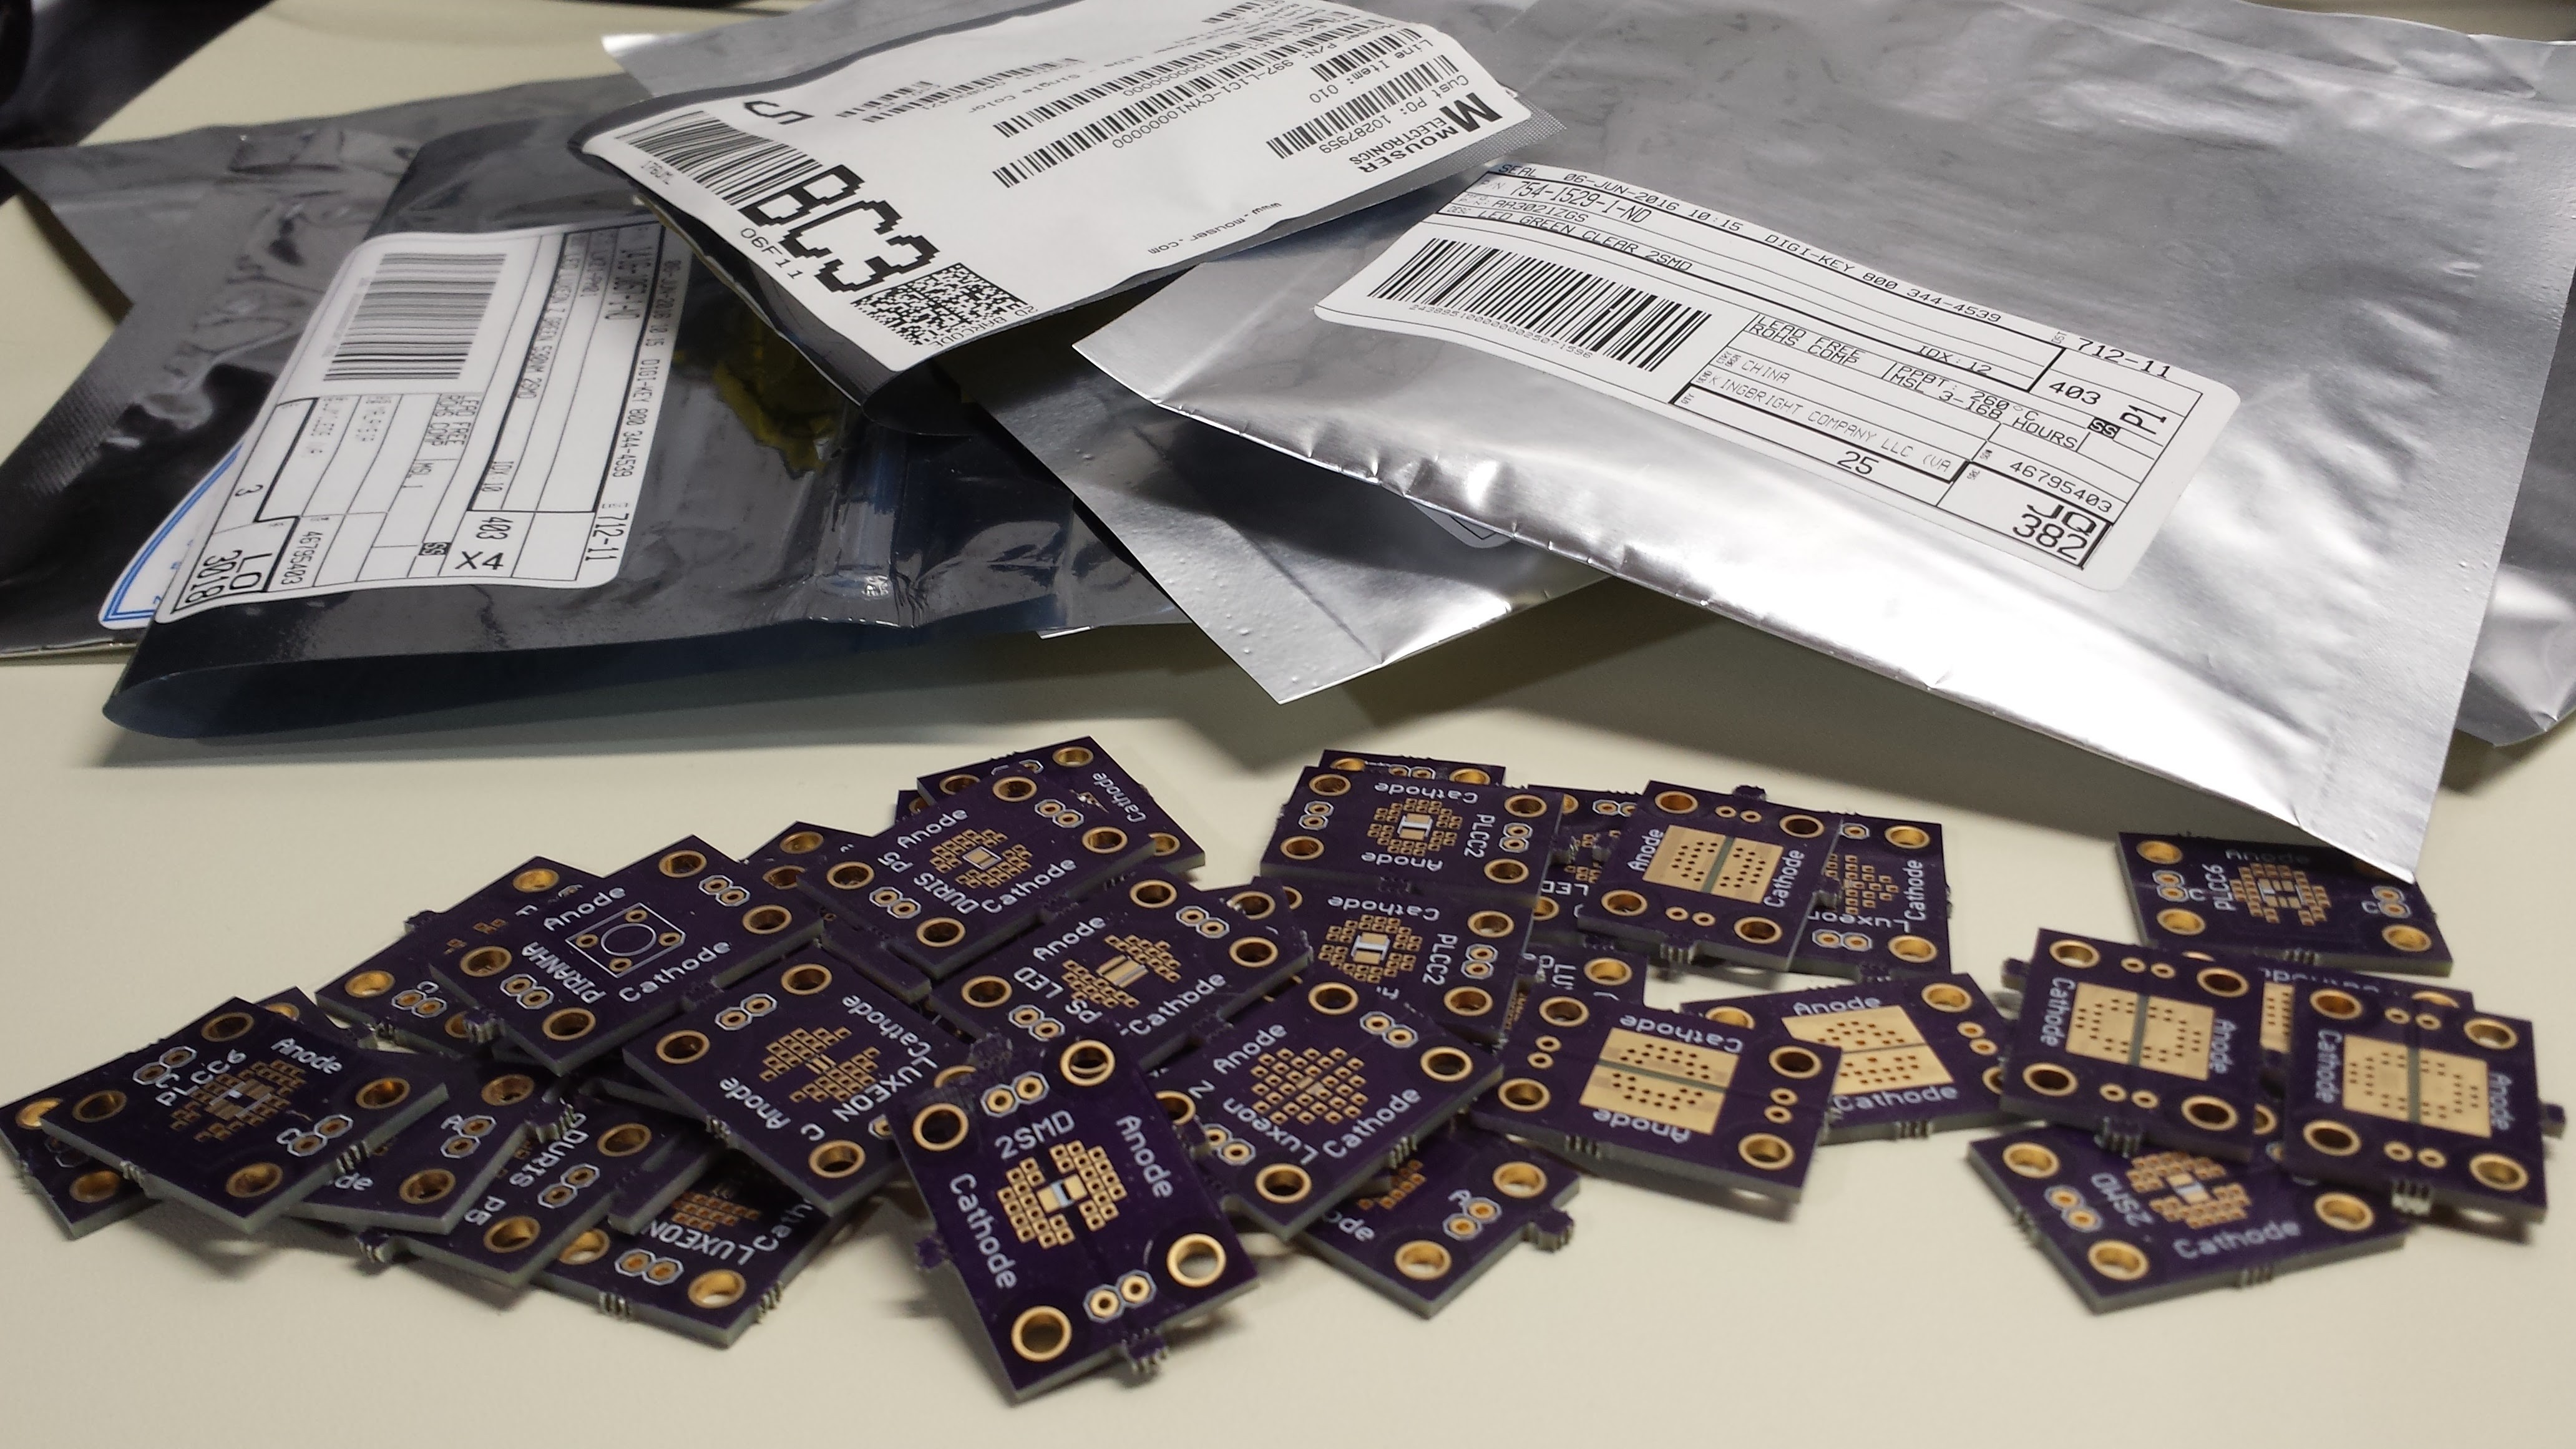
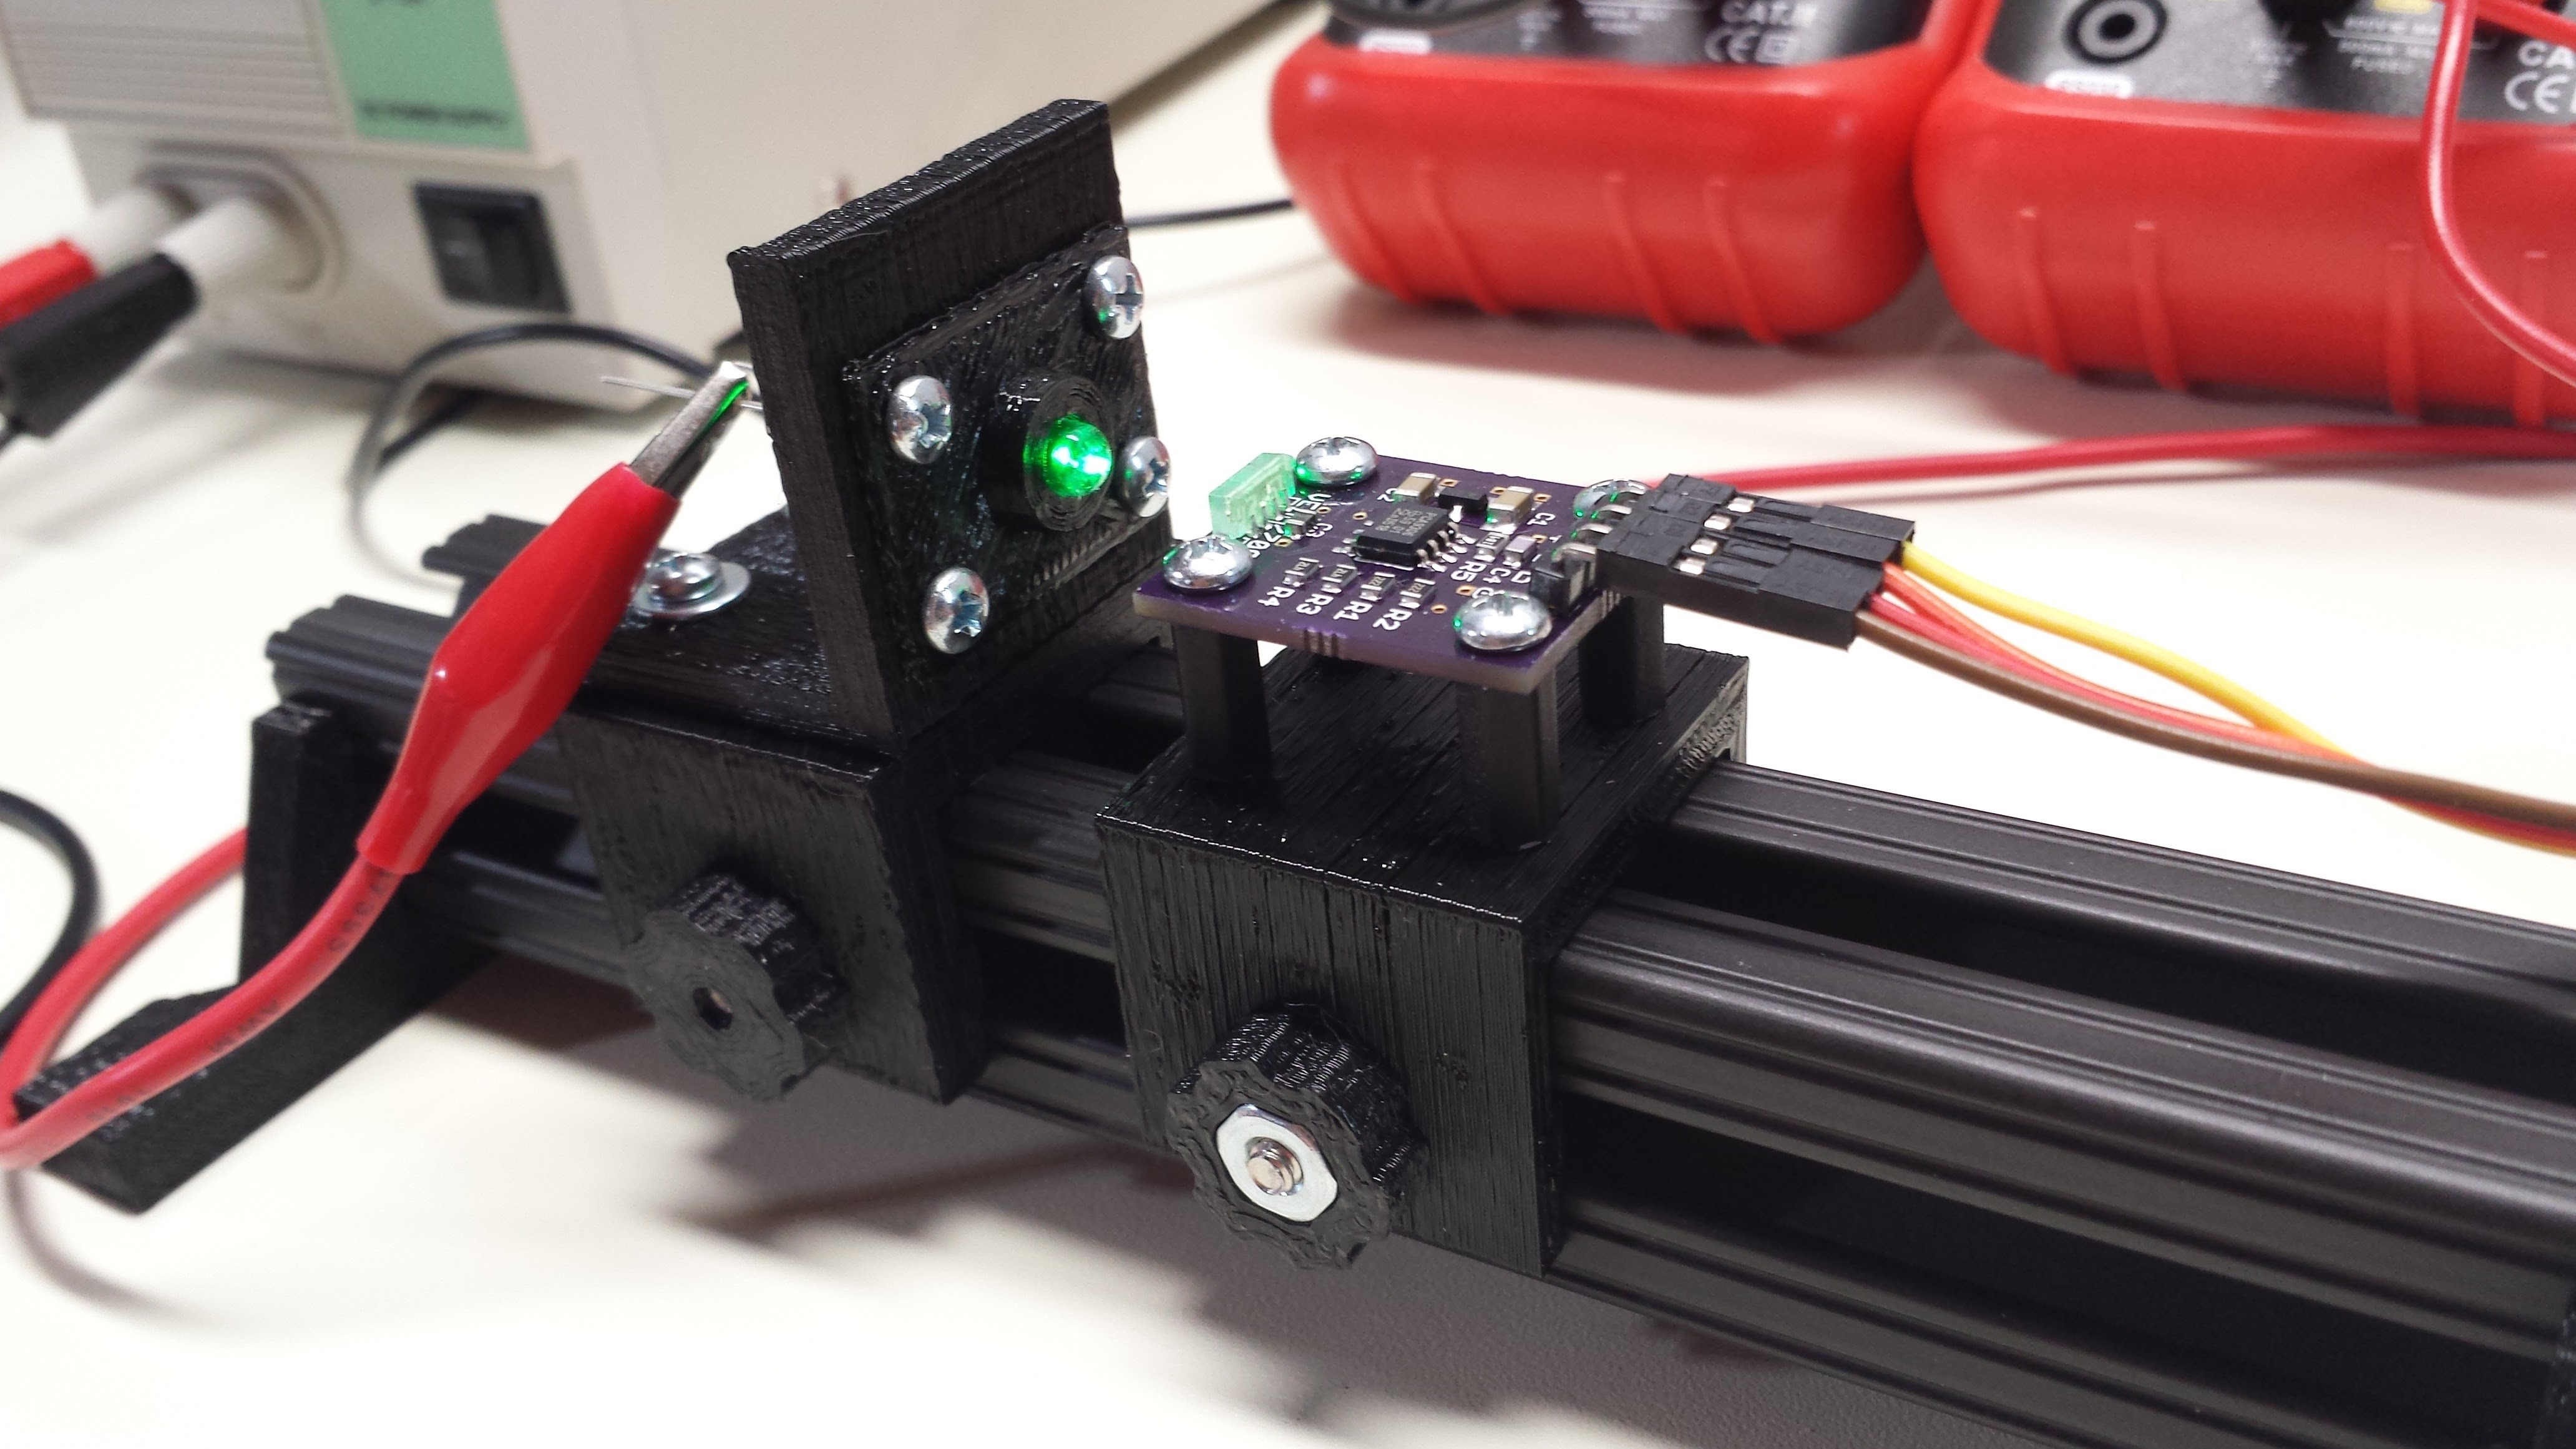
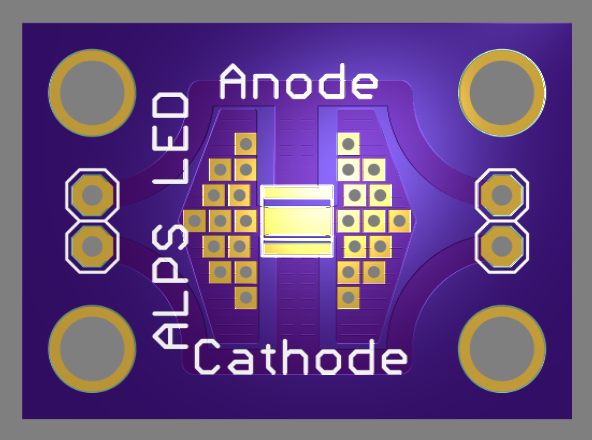
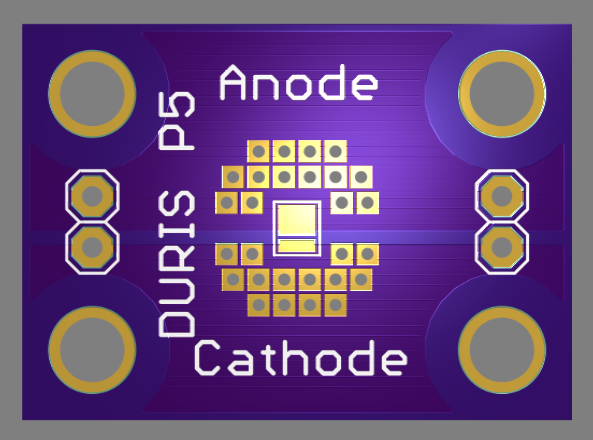
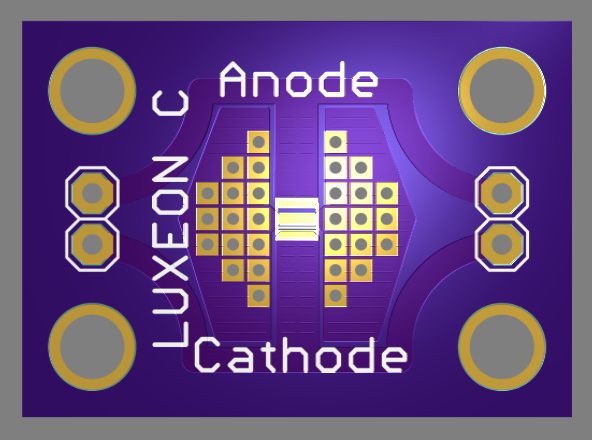
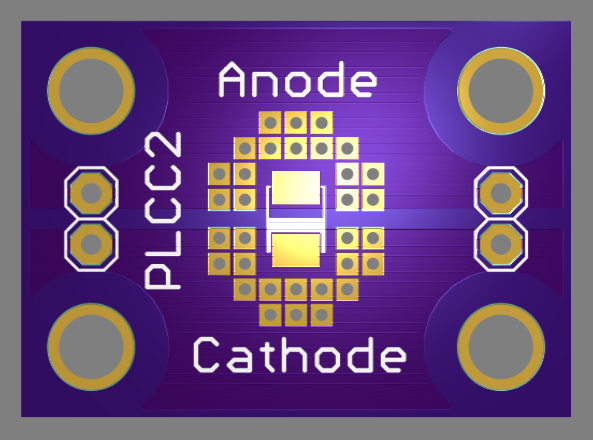
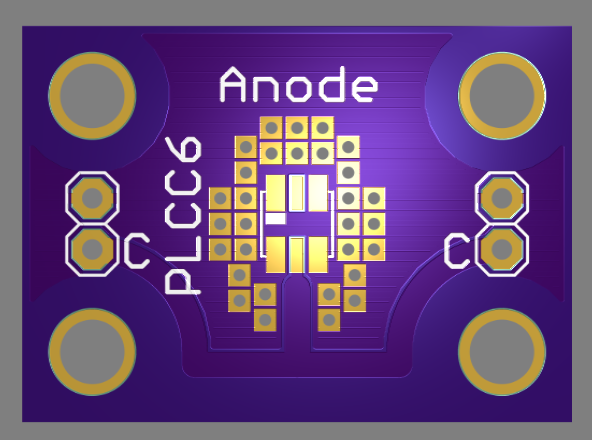
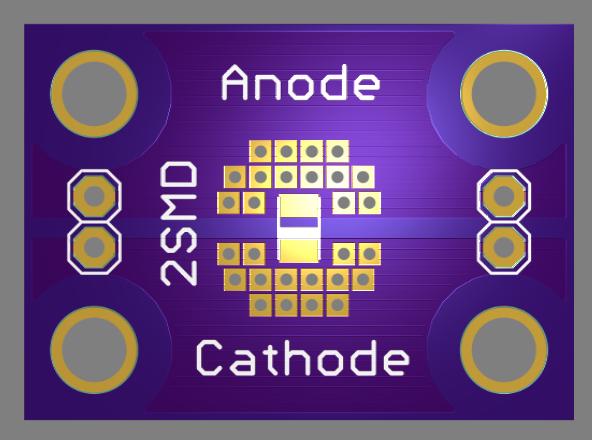
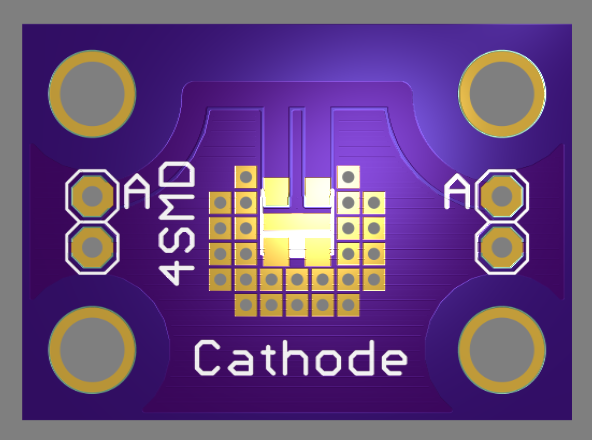
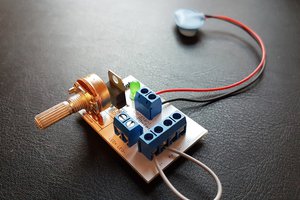
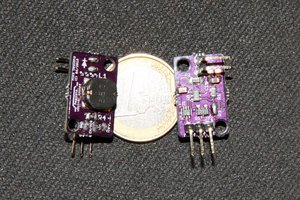
    there are two sets of pin headers (left and right) for connections to the voltage and current ports of the analyzer. I'll need to make up another cable.

    Minimum Voltage

    I used an LM317 in the analyzer since I have handfuls of them, mostly because they're dirt cheap and come up on the surplus market often. The one real drawback with this part is that the minimum voltage you can get is 1.25V (unless you have a negative rail, which I don't). I thought about what this means for the measurement capabilities of the analyzer. Here's the situation:

    so, we have:

    The minimum voltage of 1.25 affects the minimum current we can produce for any given diode. For any diodes with Vf greater than 1.25 (essentially any LED we might want to test), the minimum current extends down to zero. If we want to use the analyzer as a curve tracer for non-optical diodes, the minimum output voltage will place a limit on the minimum current that can be obtained with a given R.

    To see how limiting a minimum current is, it's helpful to consider the ratio of max current to min current for a given diode forward voltage:

    As a worst-case, consider a Schottky diode with maybe a minimum 0.1V drop at low currents. For this diode, the current ratio is (13.54 - 0.1) / (1.25 - 0.1) ~ 11.7 for any given R. Even in this case, using a single R will give a decade range of current in a single sweep. Having a set of decade-valued R's around to be able to test arbitrary diodes seems like a fair trade-off, especially since precision resistors aren't required.

    Logarithmic Sweeps

    Most of the interesting plots we can make use current as the independent variable (x-axis). Ideally, we could sample the diode characteristics at an equally-spaced set of currents both for linear and logarithmic scales. For linear sweeps, sweeping Vs linearly produces a decent approximation to linear current sweeps (left):

    when plotted on a log scale (right), we see how these points don't give a good sampling at lower currents.

    Log Voltage Sweeps

    I've called the combination of the variable voltage and resistor a "pseudo" current source. Assuming the forward voltage of the diode is constant, this is a good approximation. As discussed above, the forward diode current is just:

    so by varying the source voltage logarithmically, we should see the diode current vary approximately logarithmically. Assuming we want to step Vs from Vmin to Vmax with N logarithmic steps, we can set the kth source voltage to:

    Where k ranges from 0 to N-1. See appendix for a derivation of this formula. Here's what an actual sweep looks like:

    It's better than the linear Vs sweep, but the steps still don't end up equally spaced on the current axis. The problem is our original assumption that the forward voltage of the diode is constant. For small currents, the forward voltage changes rapidly with current, so the points don't fall evenly on a logarithmic scale.

    Log Current Sweeps

    So, in order to choose source voltage steps that produce equally-spaced logarithmic...

    Read more »

  • Optical Rail Design

    Ted Yapo08/21/2016 at 21:43 0 comments

    I decided to design some rudimentary optical rail mounts for positioning devices during test. This makes for easy adjustment of distances and angles, and allows insertion of other optical elements such as filters or lenses as required. Here's a cheap ebay laser diode module in a ring-mount "destroying" the sensor.

    (no sensors were harmed in the creation of this log; see the last section for the photographic trick).

    For the rail, I decided on sections of 1" 8020 aluminum extrusion. I also have samples of MicroRAX (10mm), MakerBeam (10mm), OpenBeam (15mm), and 2020 (20mm) extrusions, and the 1" stuff seemed about the right size and rigidity for a rail. Here's a close-up of the sliders:

    The mounts have "floating" inserts in the side rails that clamp down solidly with the thumbscrews. The thumbscrews on the right are the final design; the slider on the left was too thick for the screw length. Shown are a mount for the VEML7700 sensor carrier board and one for LED test boards, described below. I printed a "fake" board to mount 5mm LEDs for initial tests. The next image shows how the LED boards (left, purple) will mount on the carrier. The transparent cone represents the half-sensitivity angle (55 degrees) of the sensor. I have some black-oxide steel screws that would cut down stray reflections, but they make these parts even more difficult to photograph.

    Shown here is the design for the laser mount. It uses three long screws with nuts embedded in the hexagonal frame to allow positioning of the laser. This mount could also hold small optical components.

    Here it is with a laser diode mounted. I ordered some rubber screw protectors to tip the set-screws with, but they haven't arrived yet. Two of these rings would provide a rough adjustable-angle mount for longer devices (like frequency-doubled 532nm green laser modules).

    I've started a GitHub repo for these optical rail components; I'm so happy with how convenient they turned out to be, that I'm going to make some more. There's nothing in the 8020-optical-rail repo as I write this, but after I clean and organize the files a bit, I'll commit this stuff there (MIT License) for people to play with.

    LED Boards

    Unfortunately, most of the LEDs I am interested in testing are in unique surface-mount packages. Below are the designs for carrier boards that I've completed so far (these are all being made at OSH park now). I've included some large copper areas and vias for heat transfer, as well as an area on the back of the board for a small heatsink, although I expect to only run them at high currents for brief tests.

    Plessy ALPS series

    OSRAM DURIS P5

    Lumileds Luxeon C

    Lumileds Luxeon Z

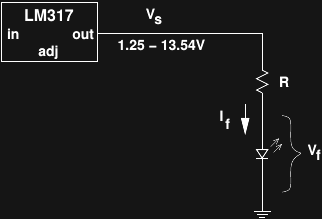
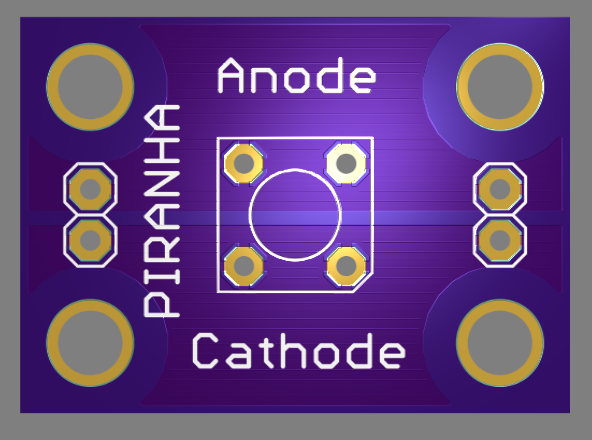
    Piranha / Super-Flux

    Würth 150141GS73100
    SunLED XZM2DG45S

    OSRAM LT G6SP

    Kingbright AA3021ZGS

    CREE MLEGRN-A1-0000-000001

    Next Steps

    These boards are on order from OSH Park, and once they come in, I can start measuring some of these LEDs. I'd like to explore some of them before settling on hardware for the analyzer, because I'm sure I'll learn something that will improve the design.

    Photographing Laser Beams

    Here's an old lab trick for making low-power beams show up in your photographs of optical prototypes. Set a first-curtain flash sync on your camera, and use an exposure of several seconds in a dark room (you may also have to stop down the aperture and/or reduce the ISO speed). This will cause the flash to fire at the beginning of the long exposure to photograph the equipment. After the flash has fired, move a piece of clear plastic (overhead transparency film works well) rapidly and evenly along the beam path several times to expose the beam. Here, I used an opaque card and put it in the beam before the flash fired to illustrate the technique:

    Do I have to tell you not to do this with powerful lasers?

  • Automated Prototype

    Ted Yapo08/21/2016 at 15:51 0 comments

    (UPDATE 20160822: added addendum below)

    As a second iteration of the design, I built a prototype of an automated measurement system. The design may not be optimal, mainly because I just used parts I happened to have around. On the other hand, I've been quite pleased with the performance and ease-of-use so far. I assembled the prototype ugly-style on a piece of copper clad:

    The basic circuit is the same as the manual design, except a 10-bit DAC drives the reference voltage for the LM317 regulator:

    (click here for a pdf version). A pair of 7815 and 7805 fixed-voltage regulators provide the supplies for the rest of the circuit. The main component is again an LM317, this time with a DAC-generated reference voltage. The output of an MCP4811 10-bit DAC with internal 4.096V reference is amplified by a factor of 3 to provide a reference of between 0 and 12.29 V. With the LM317's nominal 1.25V added, the output range becomes 1.25 to 13.54 V. With 1024 levels, that equates to around 12mV steps.

    The 3X amplification is provided by a jellybean LM358, because I have (100 - epsilon) of them. The '358 has an input range that extends to ground, but the output has difficulty sinking current at low voltages, so I added the odd-looking R6 as a pulldown.

    The LM317 requires a minimum current of around 10mA to maintain regulation, so D1 and Q1 are used as a current sink across the output. Depending on the exact green LED used at D1, you may need to vary R3 a little to get around 10mA into the sink. 15mA might be a good target to shoot for, but I wouldn't go higher than 20, because the maximum dissipation on Q1 would then be (0.02 * 13.54) = 270mW, which is about all I'm comfortable running a plastic-cased transistor at (I usually divide the datasheet maximum dissipation by 2, in this case 625/2 = 312 mW would be a conservative max). D1 also serves as a power-on indicator.

    The circuit is controlled by an arduino nano clone: the MCP4811 is controlled over SPI, while the VEML7700 light sensor board is connected via I2C. A simple program on the nano responds to two commands:

    • "vdd.ddd" : set output voltage to dd.ddd. Responds with "OK" once voltage has been set
    • "l" : sample VEML7700 light level. Responds with light level in lux after running the auto-ranging algorithm

    The range-setting resistor, R1, is mounted in a dual-banana plug for quick range changes.

    I left room on the copper clad for ADCs to do the measurement, but for now the DMMs work OK. Here's the system in operation (with the light-shielding cardboard box removed):

    The particular DMMs I'm using have RS232 ports, so I was able to prototype the whole automatic measurement system. The problem with cheap serial DMMs, though, is the difficulty synchronizing them with other processes. I got so fed up with them that I did a whole project (quick as it was) just to solve this issue. Over on #TP4000ZC Serial DMM Adapter, I have a design for an adapter for easily syncing the meters to facilitate this kind of programmatic measurement. Two of the adapters are visible in the photo - they're the black I-shaped boxes in the center

    Lessons Learned

    I hadn't thought about this before, but the LED forward-voltage measurement may provide some unique challenges. Since the voltage is a logarithmic function of current, it is confined to a narrow range relative to the current - there's a reason we often quote the forward voltage as a single number (0.7V for a Si diode, for instance). To measure this voltage accurately, you either need a lot of bits in your ADC, or you have to narrow the conversion range to a band around the nominal Vf of the LED. These are 4,000-count meters, equivalent to 12-bit ADC's on any particular range, and I would have liked some more resolution in some of the data (Vf changing by just a few mV at times). I'll have to think about this.

    Automated measurements are awesome. Instead of collecting data for a half hour, I set the thing to collect 100 points and went to get a cup of coffee....

    Read more »

  • Manual Data Collection

    Ted Yapo08/21/2016 at 15:36 0 comments

    I decided to pursue an iterative design approach for this project rather than follow my instinct to guess at requirements and rush a design to the PCB house. This also allows me to get some data early and explore the subtleties of measurement, modeling and analysis. I re-cycled a finely-adjustable voltage source I had built for another project to do manual testing:

    The circuit is basically an adjustable regulator using a multi-turn potentiometer. Here's the schematic:

    (click here for a pdf version). R2 determines the control voltage for the LM317 regulator; the output is a nominal 1.25V above this reference. Q1 and R3 form a current sink based on this 1.25V difference to draw the minimum required current (about 10mA) from the regulator, so that devices can be tested below that level. Note that this circuit was designed to be used after a well-regulated lab supply; the reference voltage is derived from the input, so it would be very sensitive to supply noise. This module also works well as a regulator for testing circuits from 12V batteries. About the only drawback is that the LM317's built-in reference limits the minimum output to 1.25V.

    R1 is used to transform the voltage output into a pseudo current source; it functions similarly to the ballast resistor used when driving LEDs from DC. Because all measurements are taken at the LED, the voltage output from this circuit and value of R1 don't need to be exact. R1 is chosen to select the approximate current range based on the nominal forward voltage of the LED. For example, if the LED has Vf around 3V, a 1k resistor would give an approximately (12 - 3) / 1k = 9 mA full-scale current range. Other resistors can be used for different ranges.

    The meters here are standard DMMs, as shown below:

    To gather data, the device-under-test is mounted close to the optical detector (VEML7700), the voltage is adjusted to give a desired LED voltage or current, then the values are read off the meters and the sensor. The data is recorded, and the next voltage is adjusted. This manual process is tedious and error-prone, but it works well enough if you only have one device to characterize. At last count, I have over a dozen waiting to be evaluated, with more likely to come.

    This was the equipment and procedure I used to collect the data discussed in previous logs.

    Lessons Learned

    This seems like a reasonable approach to characterizing LEDs (and laser diodes). Automating this would save a significant effort. The LM317 plus resistor seems like a decent solution: driving the reference voltage with a DAC would provide an easy way to automate the control of the measurements. The built-in current and thermal limiting of the LM317 would be tough to beat at the same price point with a discrete version.

    An analysis of how limiting the 1.25V minimum is in practice would be interesting. With the exception of maybe some IR LEDs, no optical devices will have a forward voltage this low. It might limit the testing of non-optical diodes, though, depending on the value of R1. I'll have to work through the numbers.

    One possibility is to use another regulator, like the current-referenced LT3080, which goes all the way down to 0V. These are typically much more expensive than the jellybean '317. I drew an LT3080 in the initial sketch of the design, but I'm no longer convinced that it's required.

View all 12 project logs

View all 4 instructions

Enjoy this project?

Share

Discussions

Similar Projects

Does this project spark your interest?

Become a member to follow this project and never miss any updates