karpour
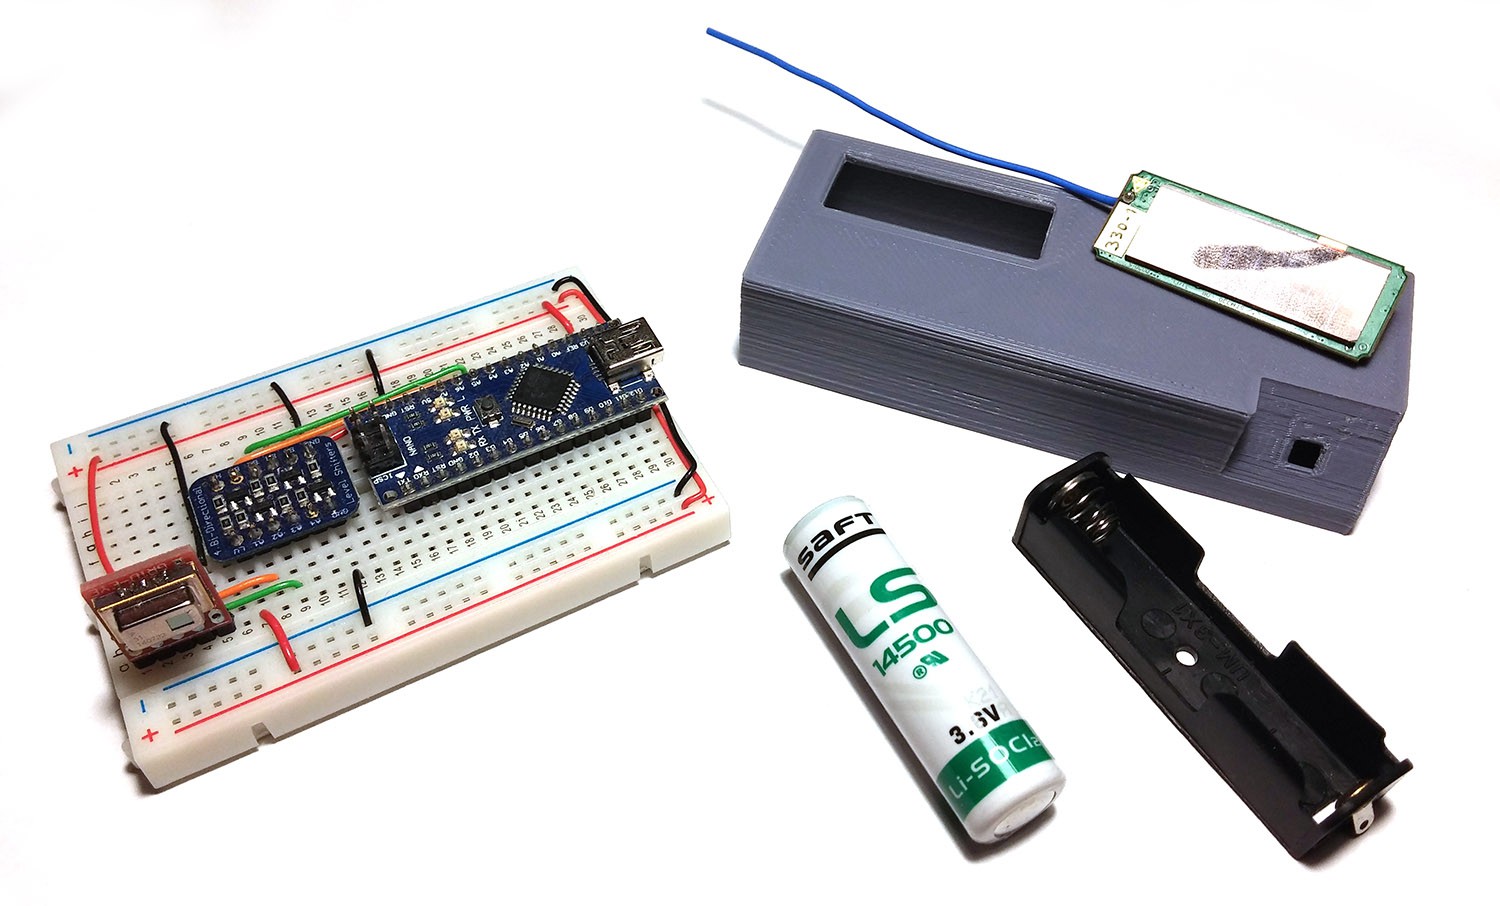
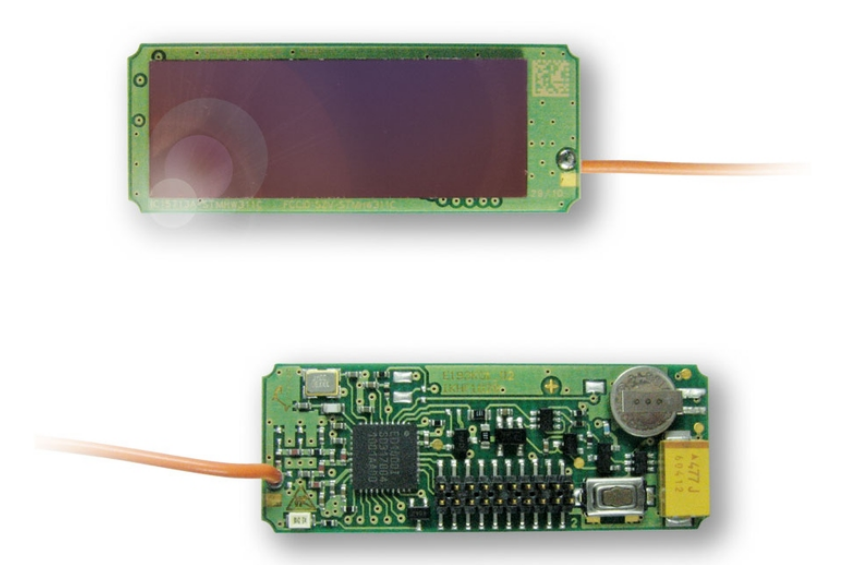
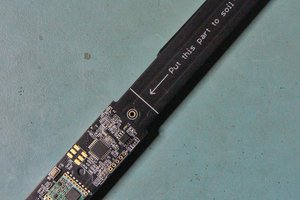
In this project, wireless energy-harvesting sensor nodes are developed on top of EnOcean STM3xx modules. The modules provide the energy-harvesting circuit, a battery, a solar cell and an 8051-compatible microcontroller.
The modules developed are:
- Water flow detection module
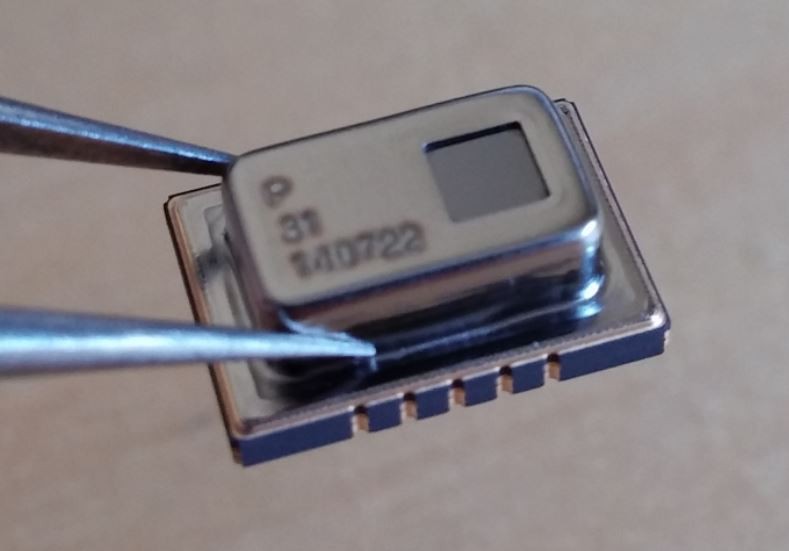
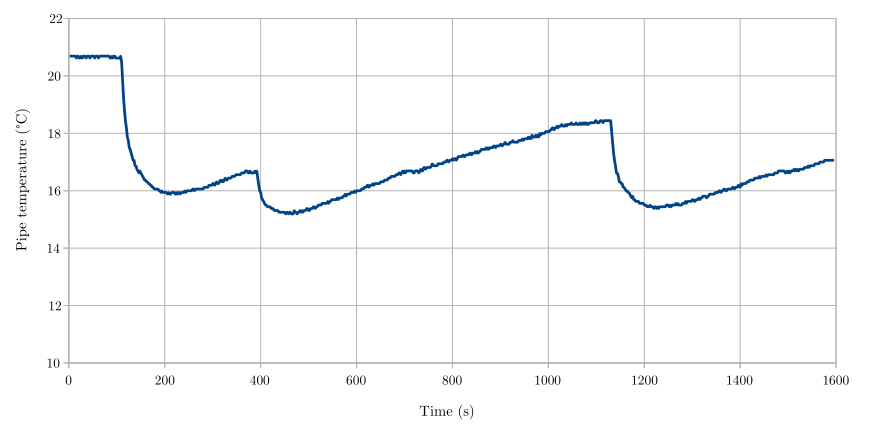
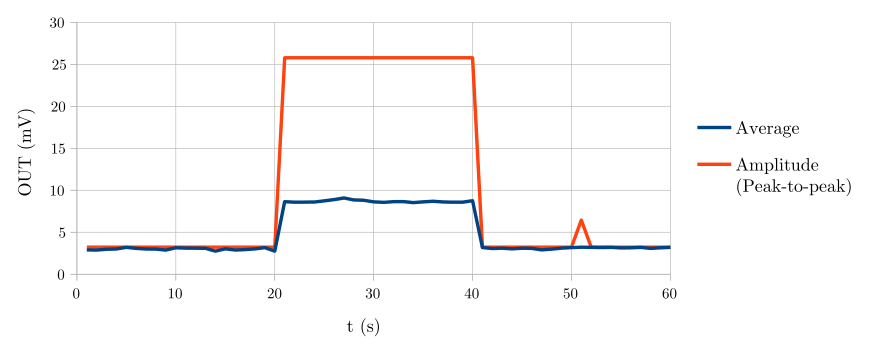
This module works by measuring the temperature change in water pipes using a temperature sensor (details here) - Current detection module
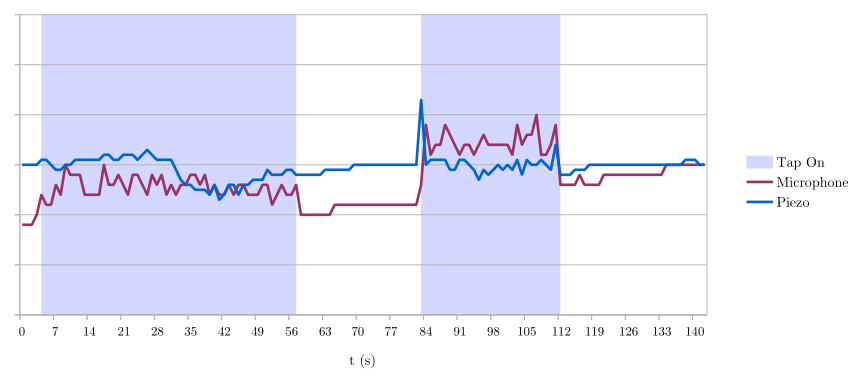
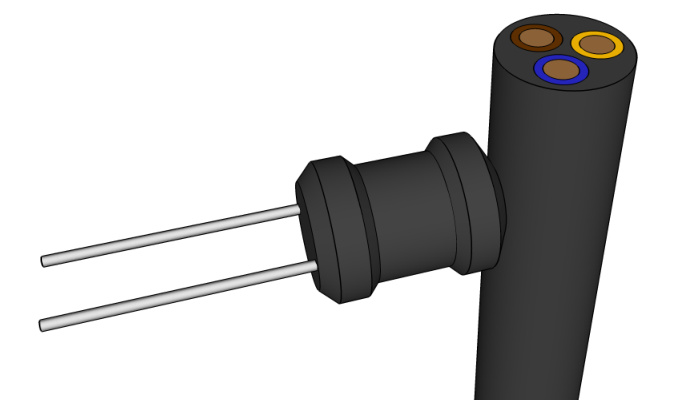
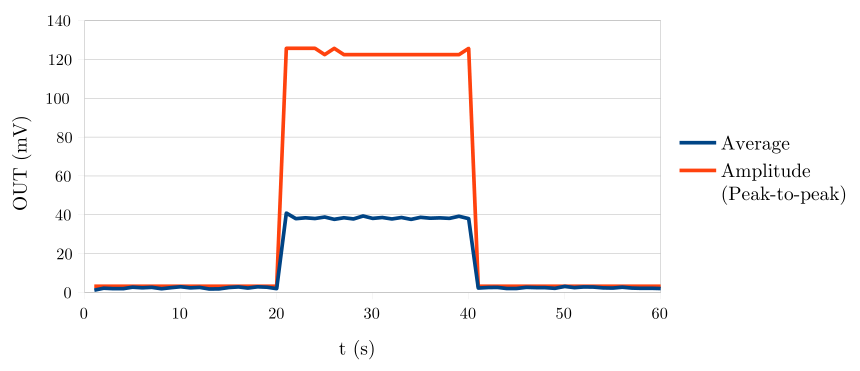
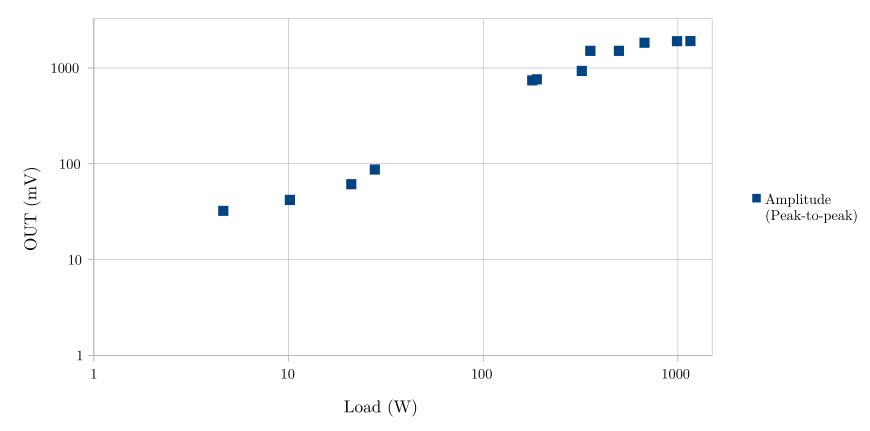
This module attaches to power cables and detects current flow without any need to split cables. (details here) - Infrared sensor array module
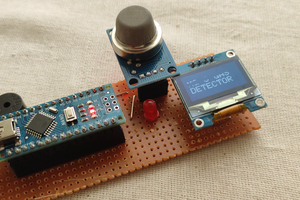
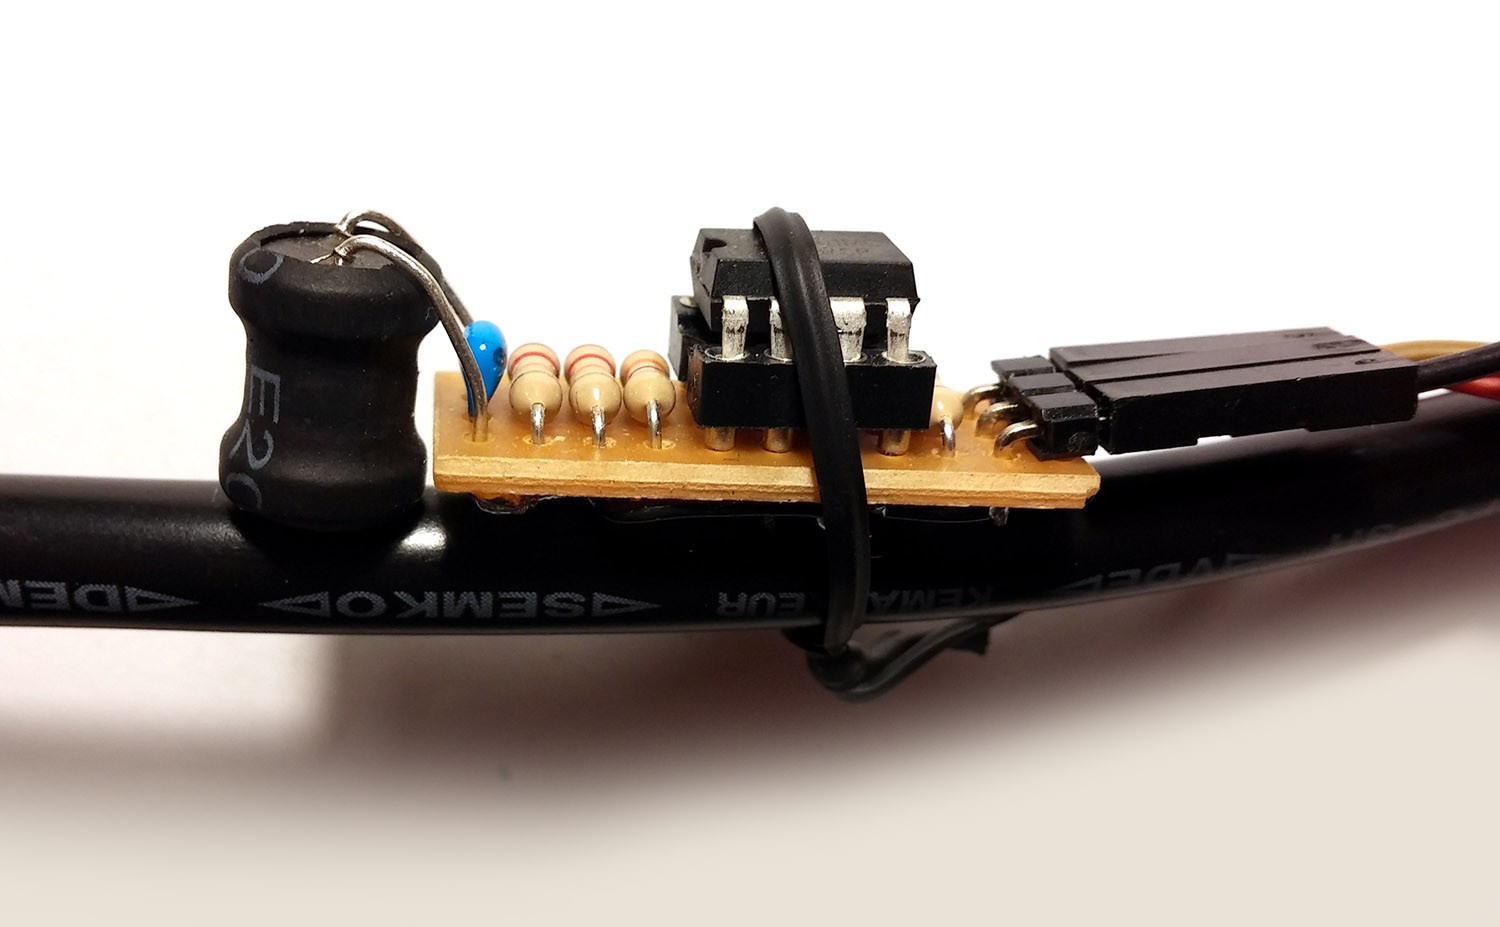
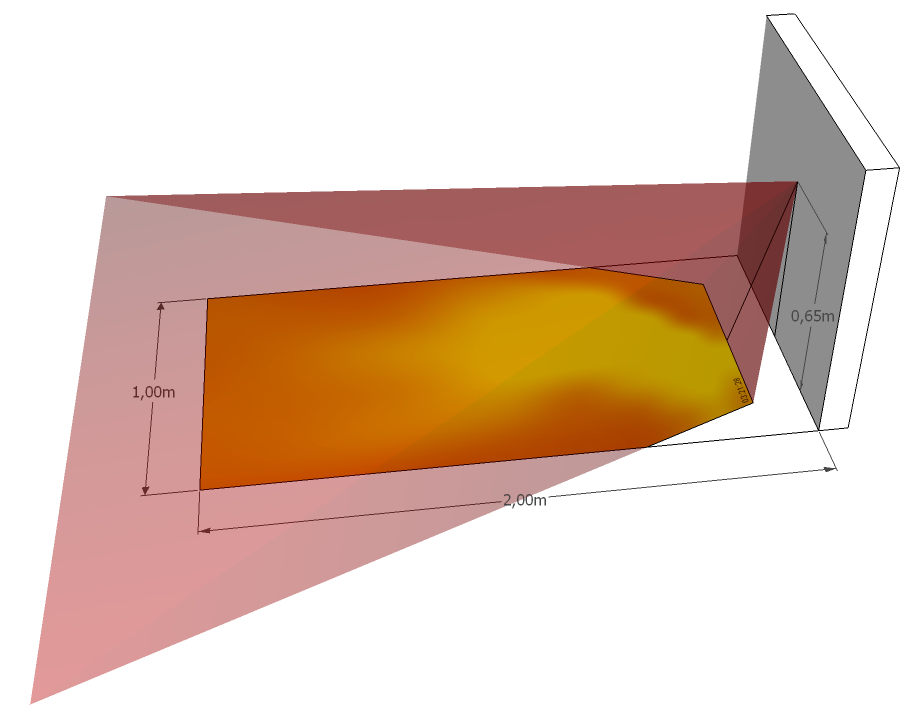
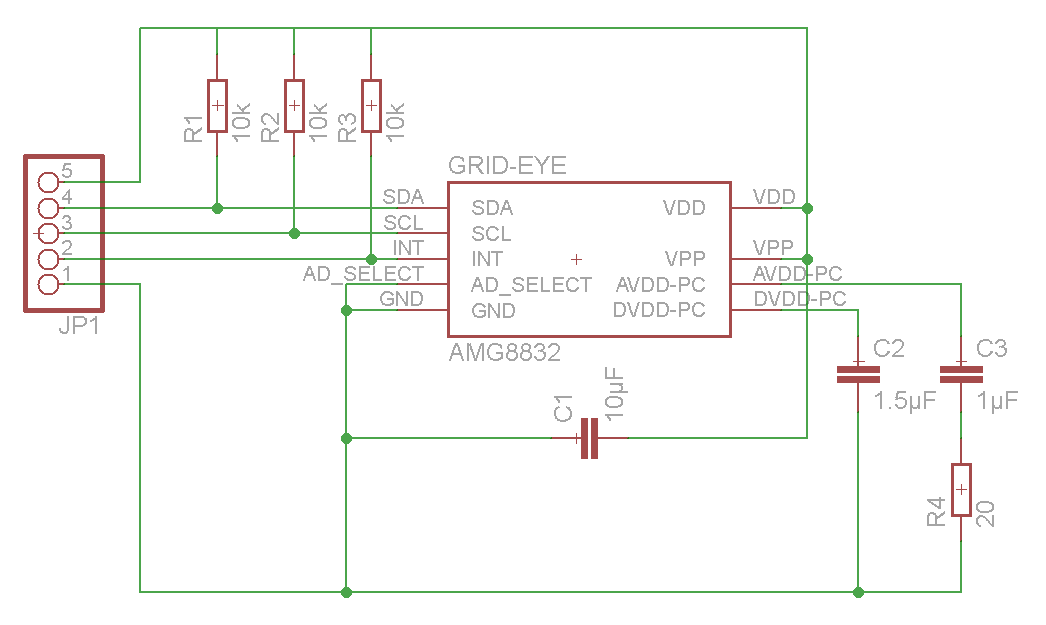
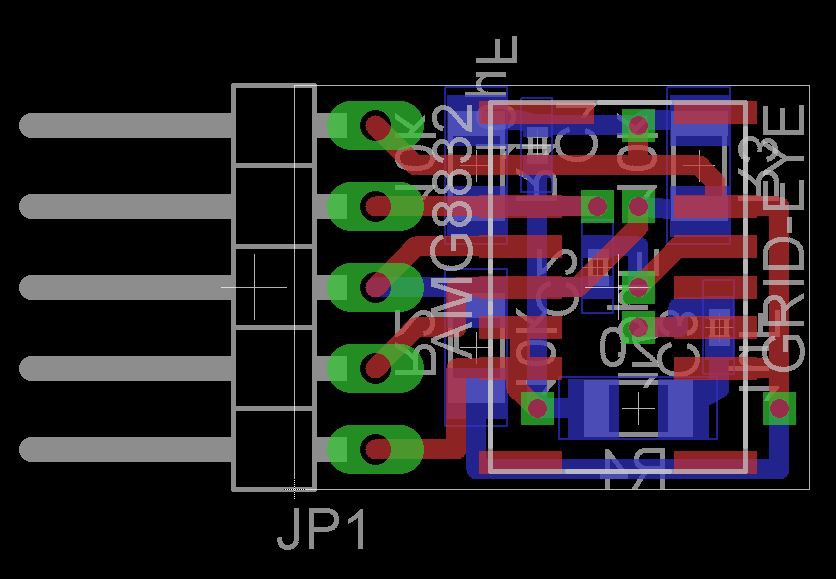
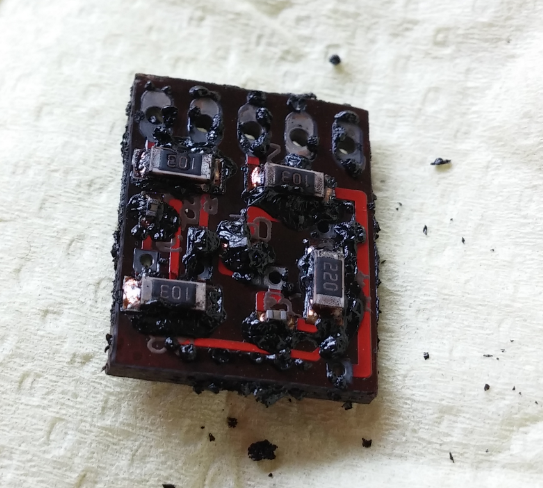
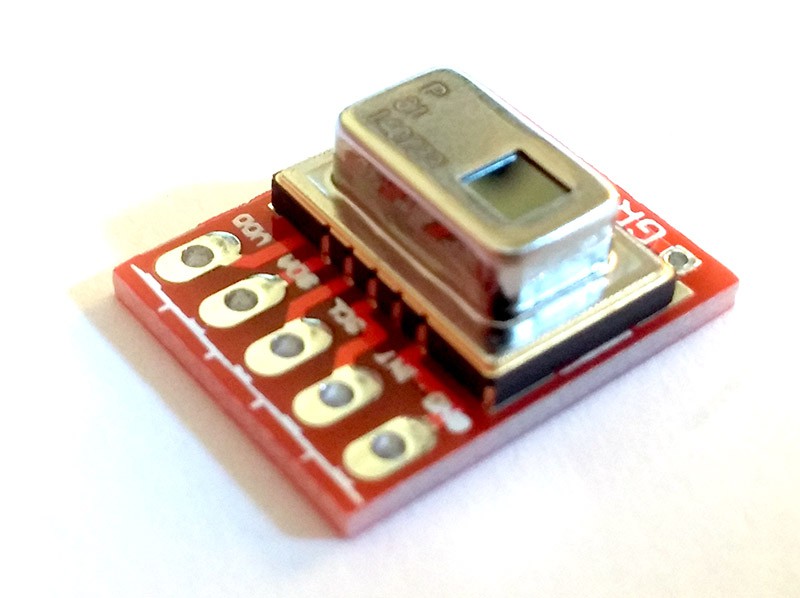
This module can be both used for presence detection as well as monitoring of devices that generate heat. It is based on a Panasonic AMG8831 Grid-Eye MEMS sensor array. (details here)
Most of the technical details are in the project logs!
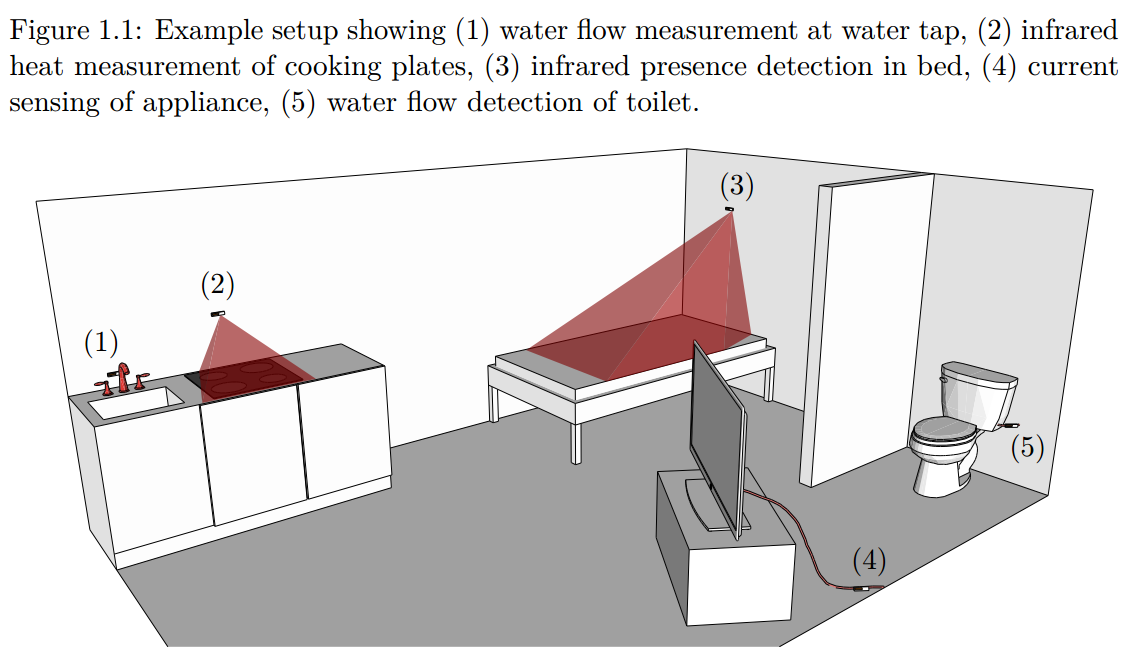
The picture above shows an example setup using the modules for monitoring presence as well as different devices. Using this data, the system can make decisions about whether the user is in need of help.
A big focus of this project is being non-invasive in 3 ways:
- Any measurement done by sensors should be non-invasive and require no alteration of the devices (such as putting an adapter between a device and the power plug)
- The sensors should be visually non-invasive and require no cables.
- The privacy of the user has priority, ruling out things like video processing for presence detection.
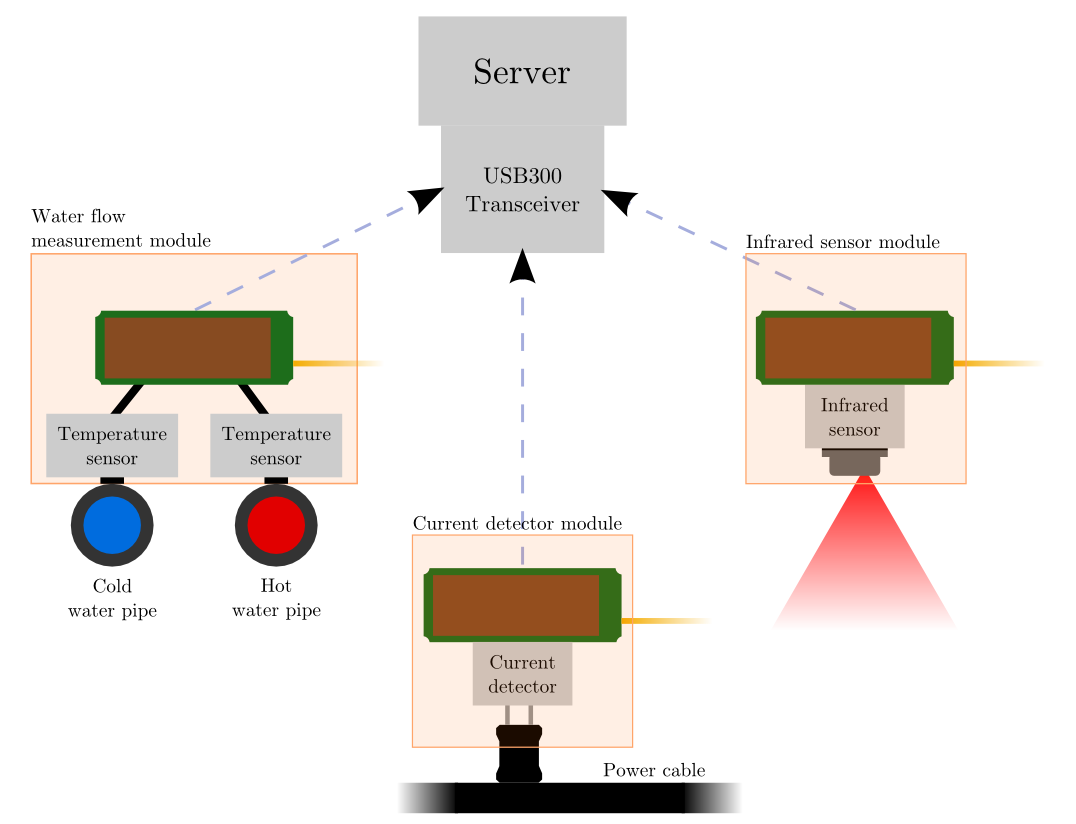
The sensors send their data to a EnOcean USB300 module connected to a small server, which processes the input and makes decisions. These decisions will largely depend on which devices the sensors monitor.
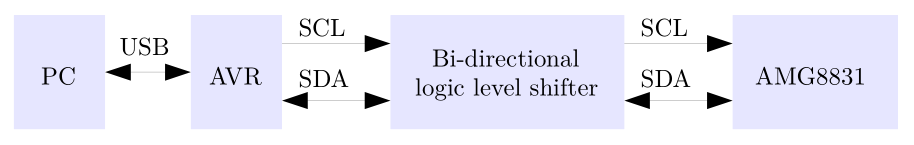
A more detailed view of the system setup can be seen below.
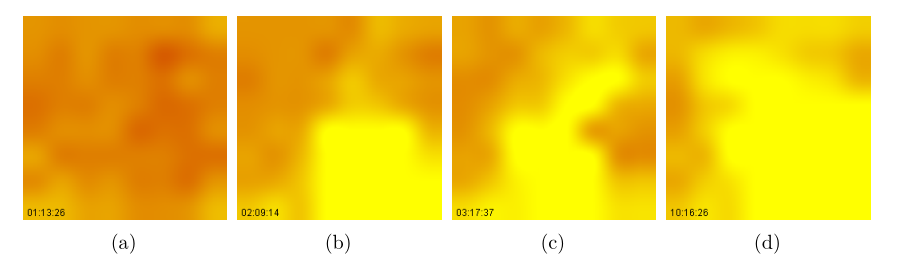
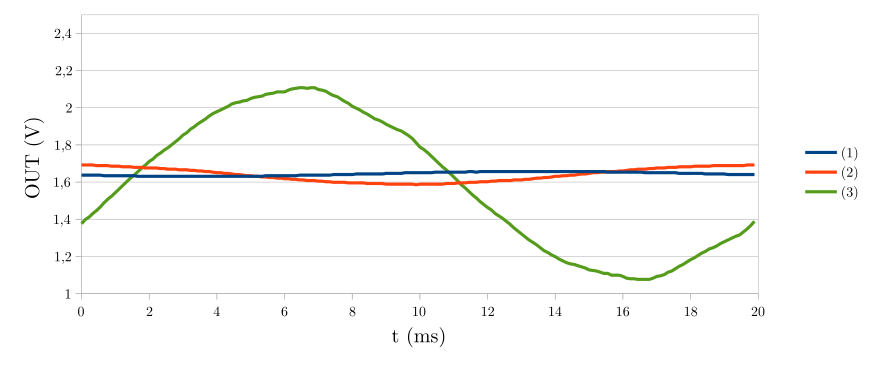
 The first data gathered were readings with the sensor pointing at a wall with a uniform temperature to test the noise level of the sensor. According to the data sheet, temperature readings have an accuracy of
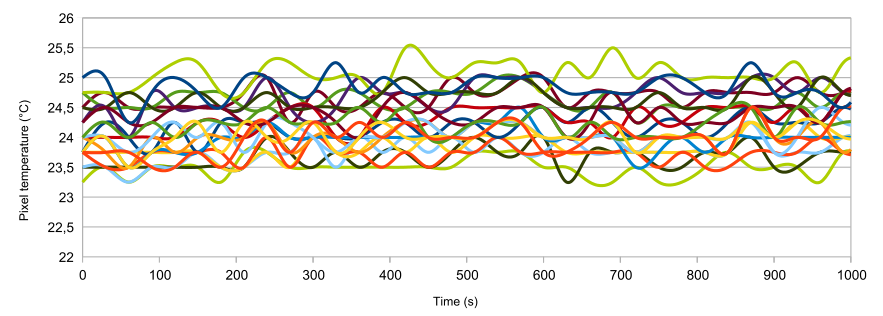
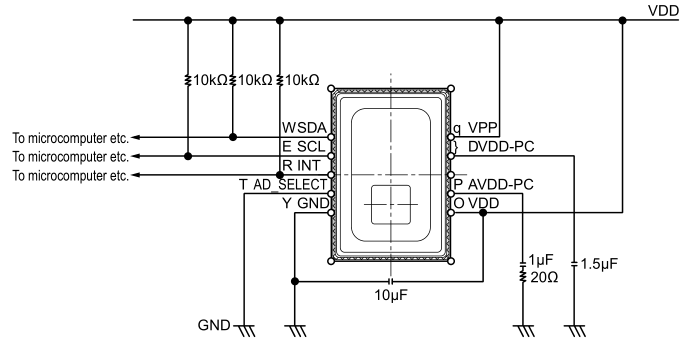
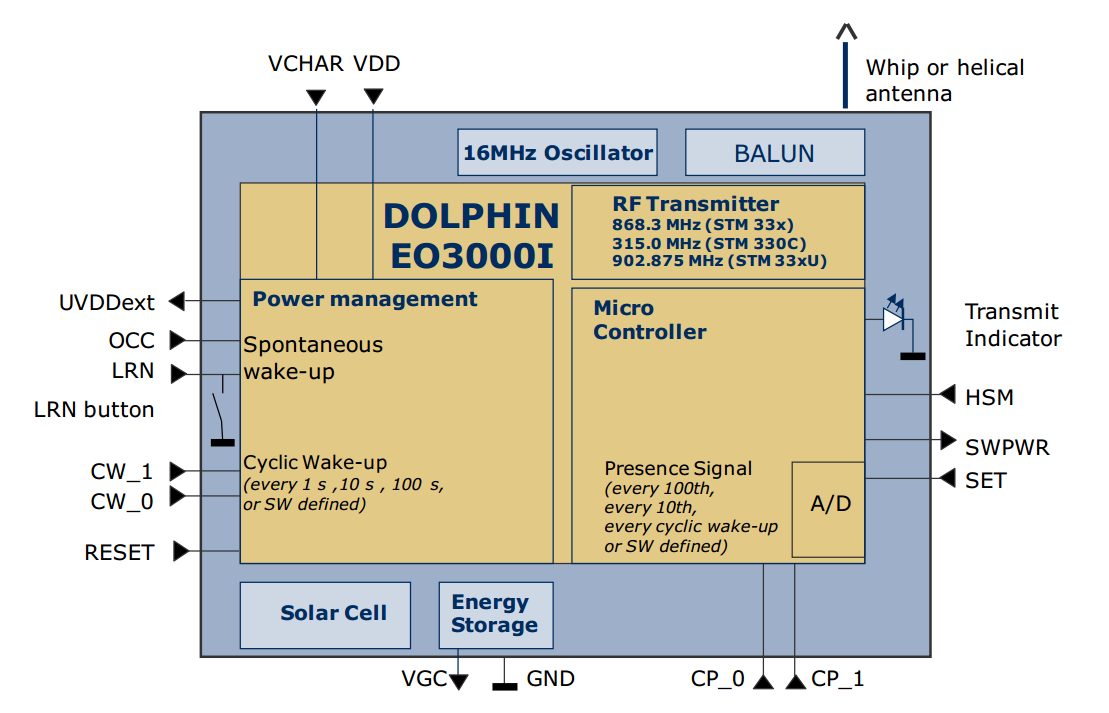 Block Diagram of the EO3000I SoC, used on the STM3xy module family.

 Danie Conradie
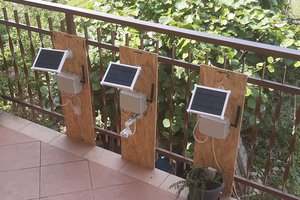
 Sergio Ghirardelli