 Florian Ellsäßer
The challenge:
Due to climate change, droughts and dry periods have become more frequent with an increasing trend in the future. This lack of water usually has a negative impact on crops and thus our food supply and our food security. In particular, regions that previously had no serious water problems will be affected by droughts in the near future, including the main growing areas of our staple foods. The consequences of a drought are often a reduction or failure of the harvest and a general decrease of the harvest quality. However, apart from a few side notes in the news, the drought induced problems of crop cultivation and the threat to our food supply are not a major concern for most people and communities.
With this project, I wanted to make the water stress of crops visible to a wider range of people and raise awareness of how directly weather extremes such as droughts are related to our food and how big the problems for agriculture can become due to prolonged dry periods.
It is therefore high time to make people aware of the problem, collect data and develop better more climate change resilient agricultural systems.
The Crop Water Stress Sensor:
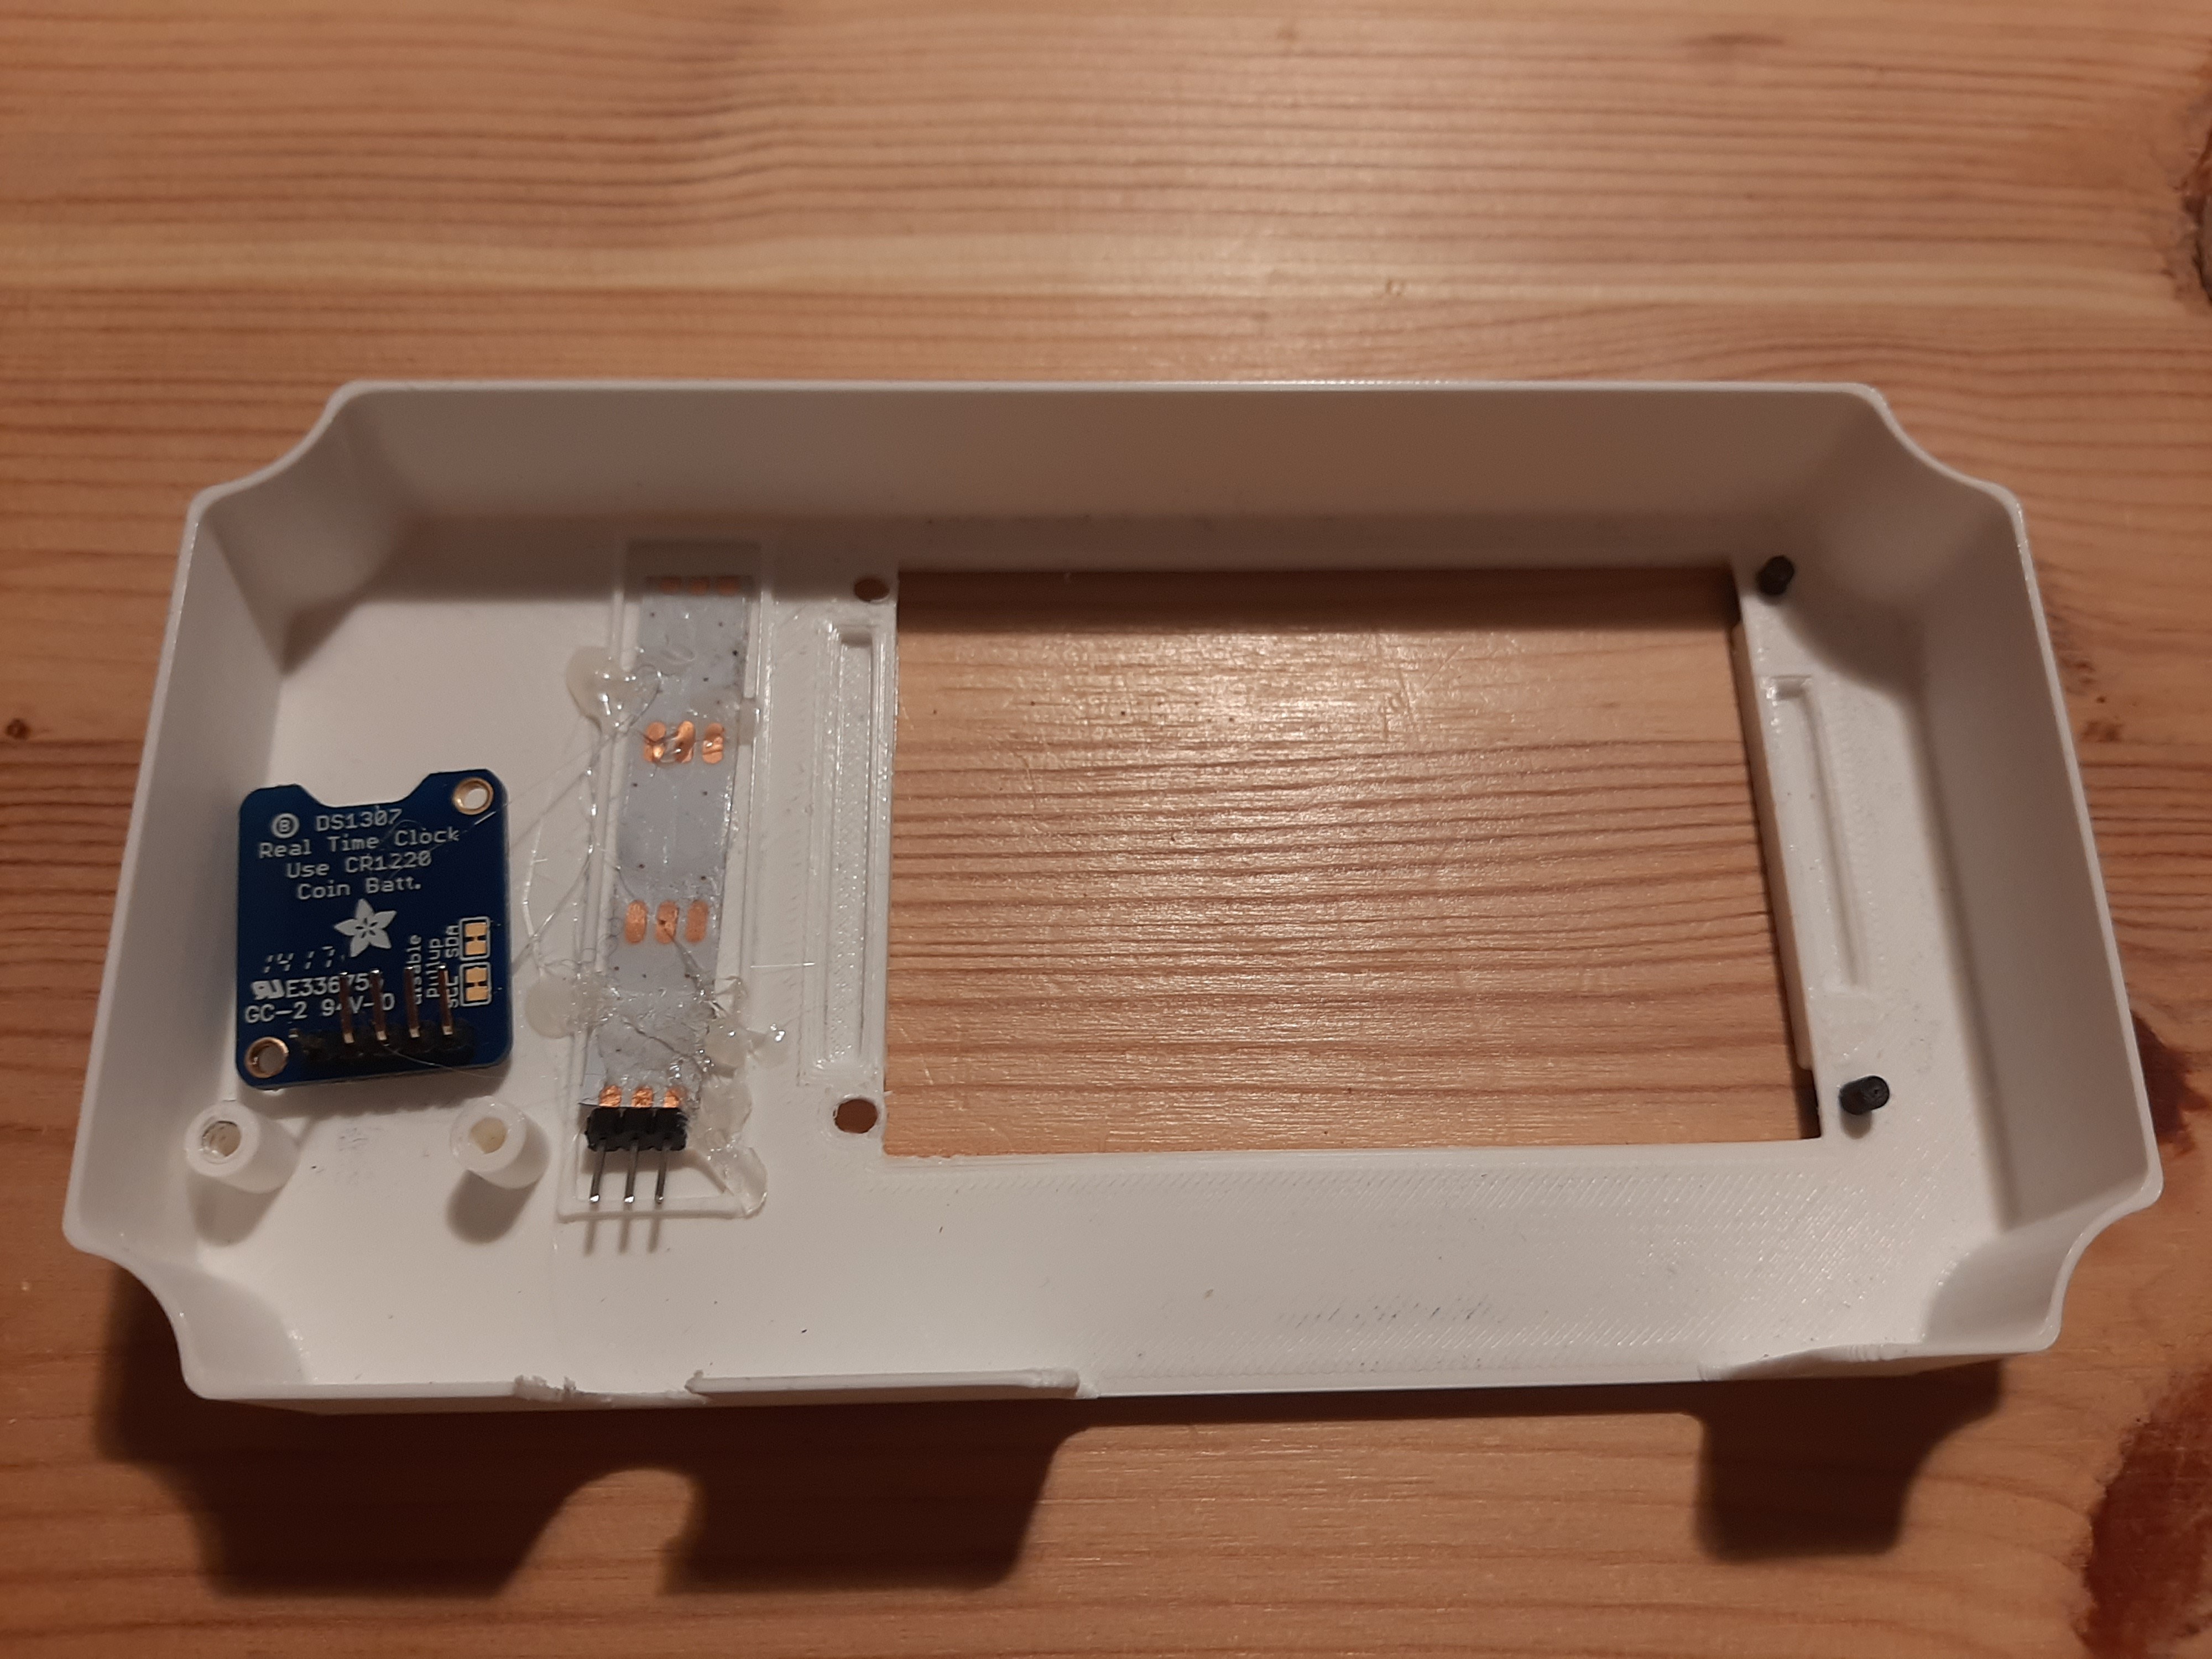
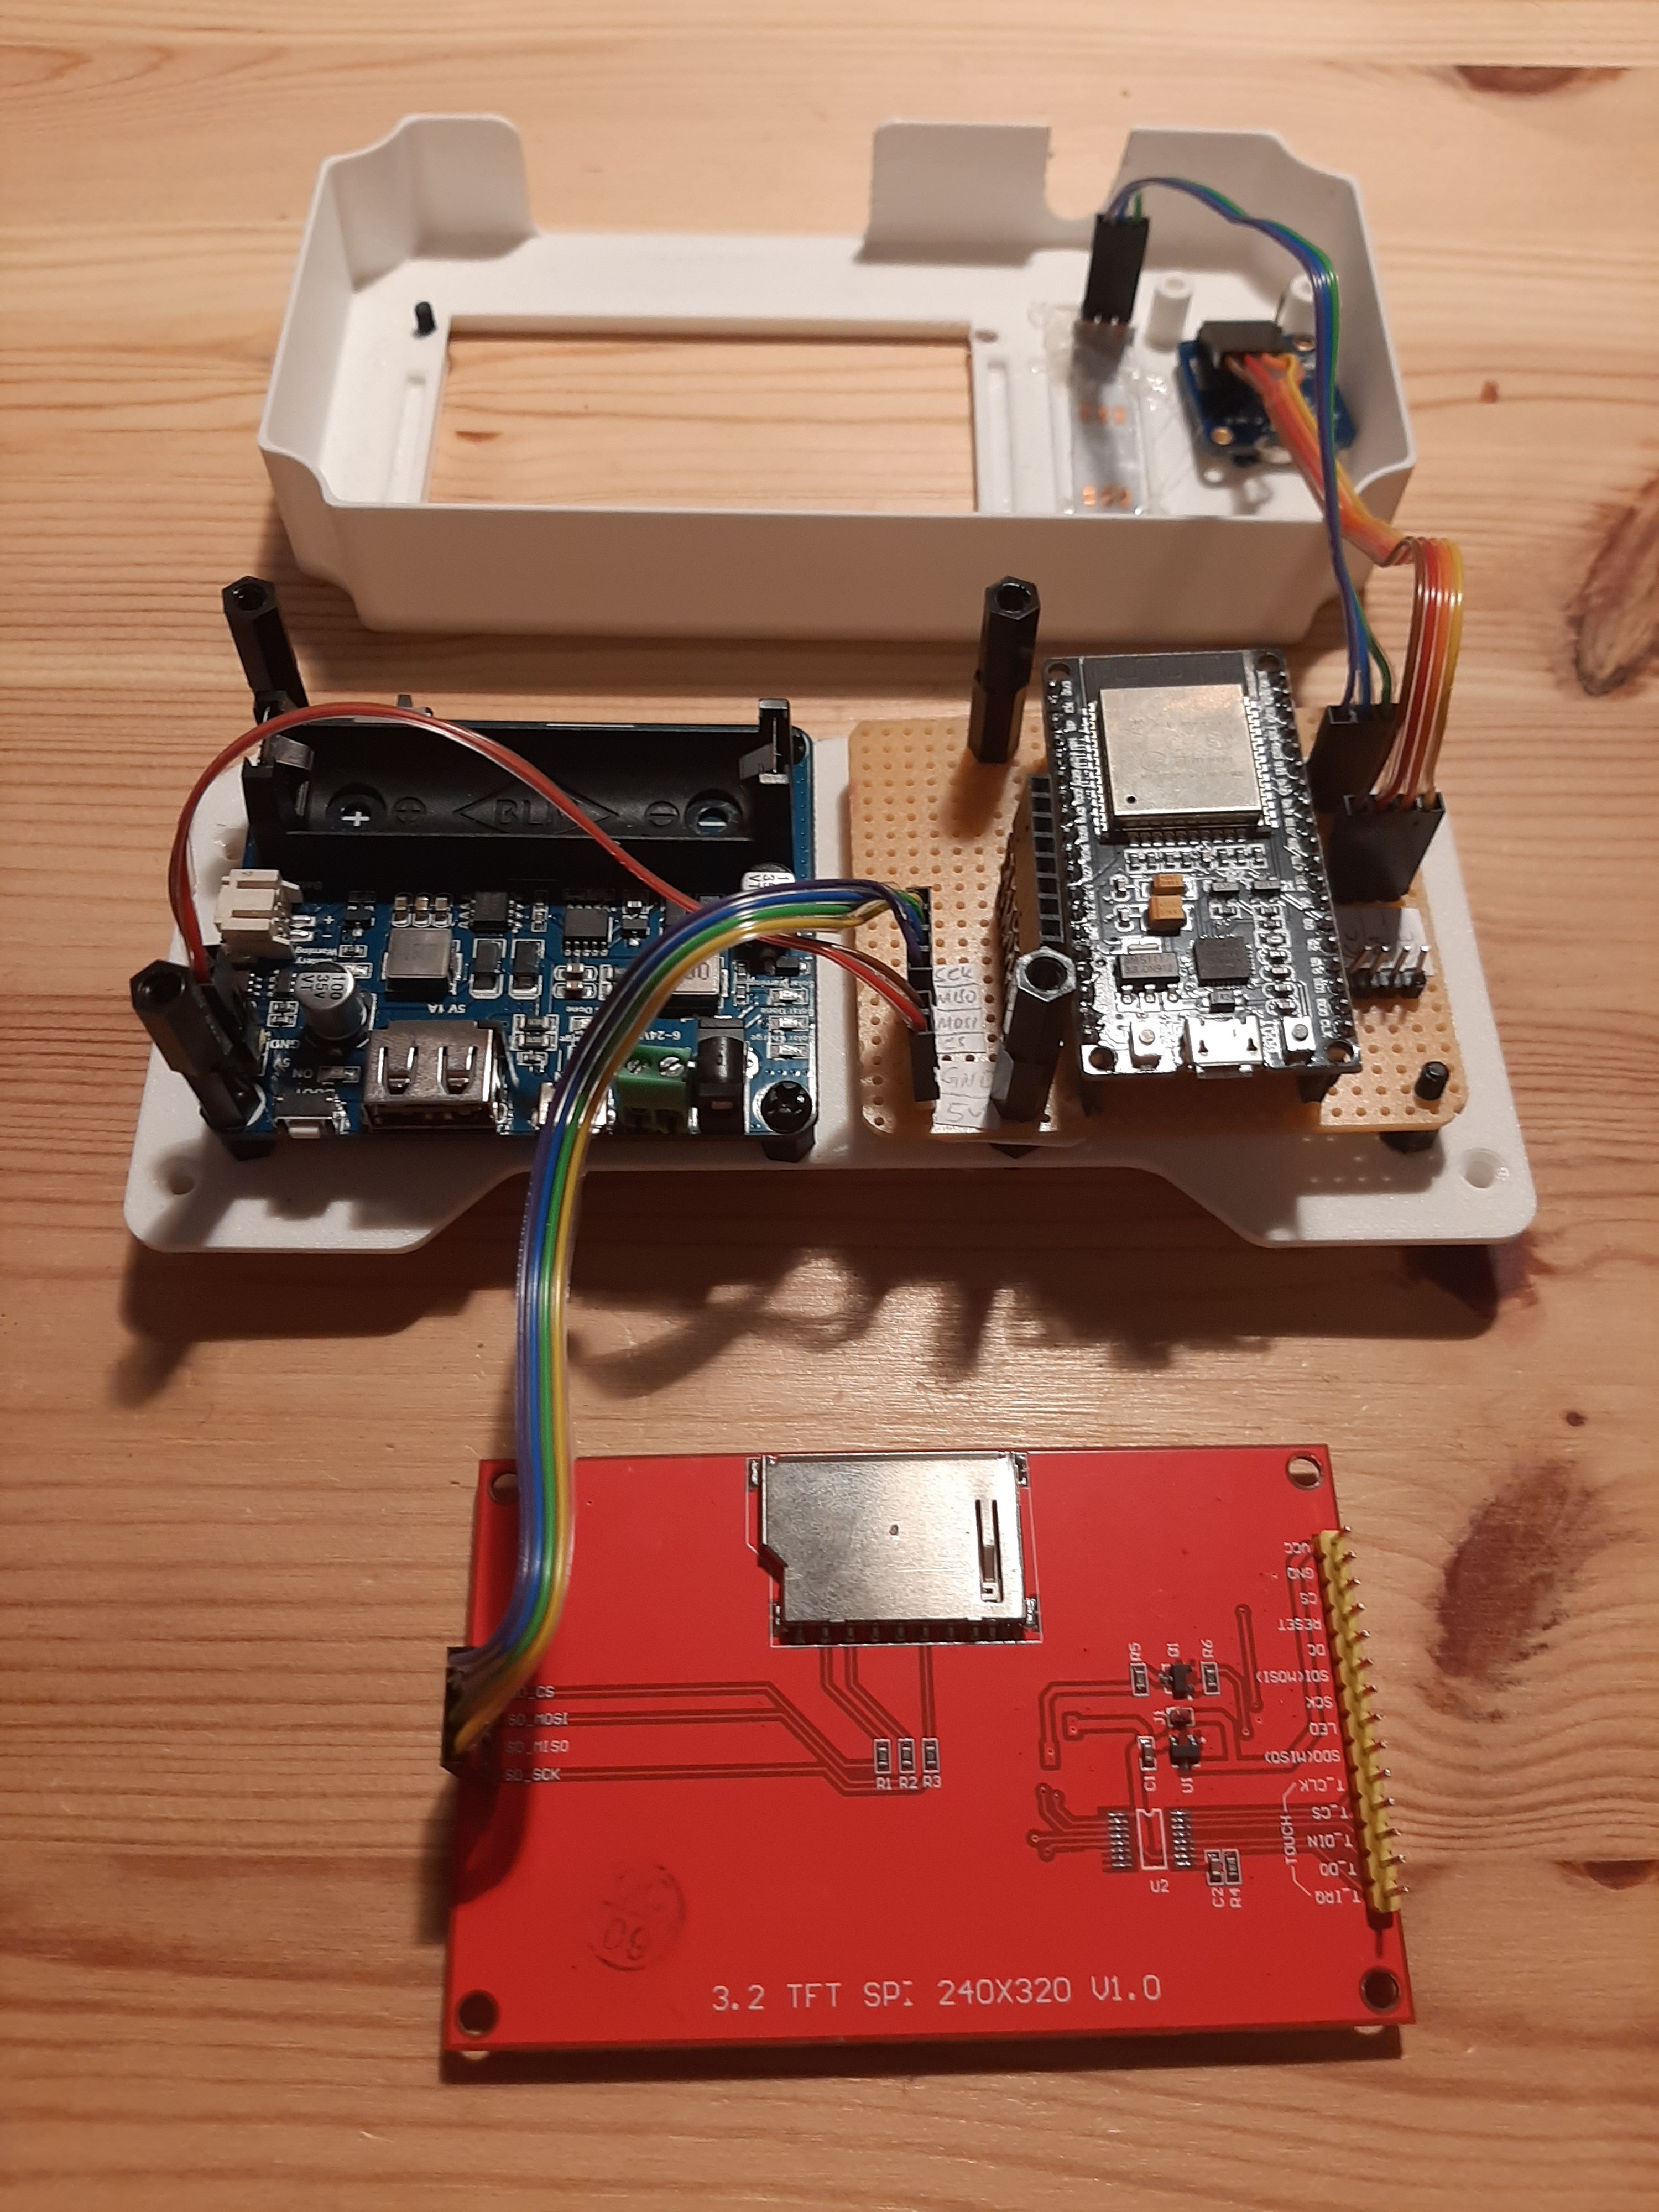
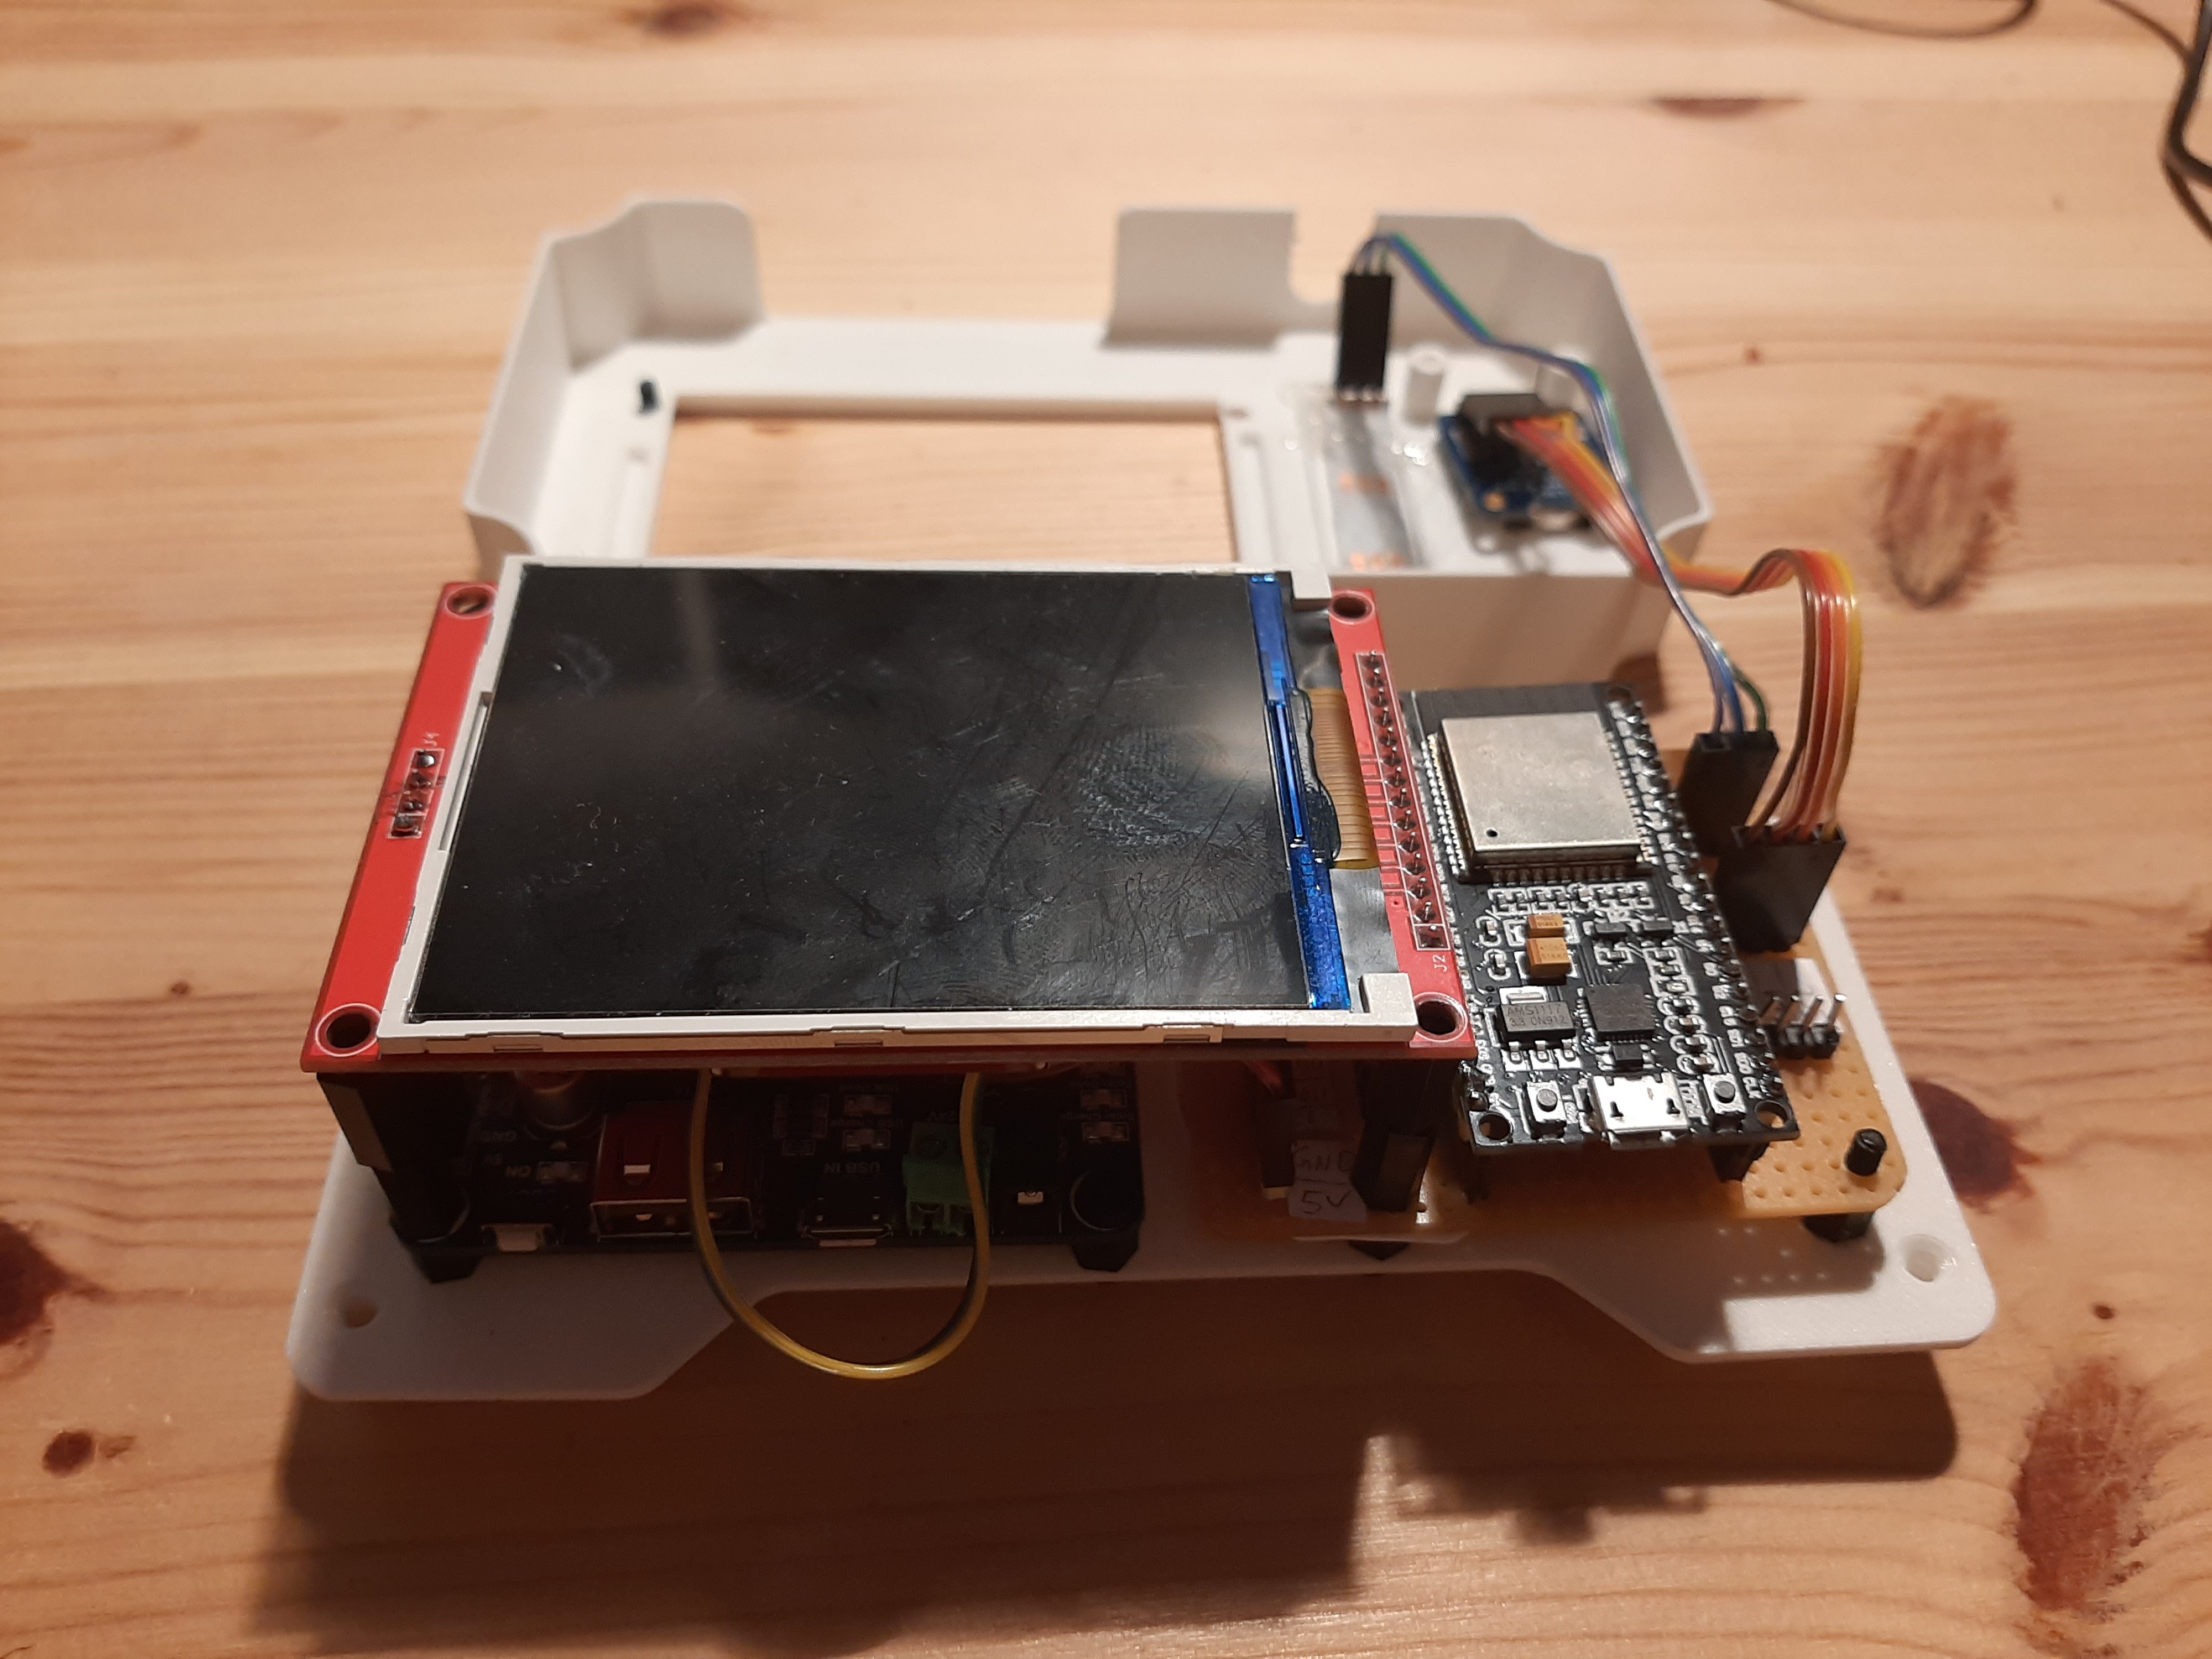
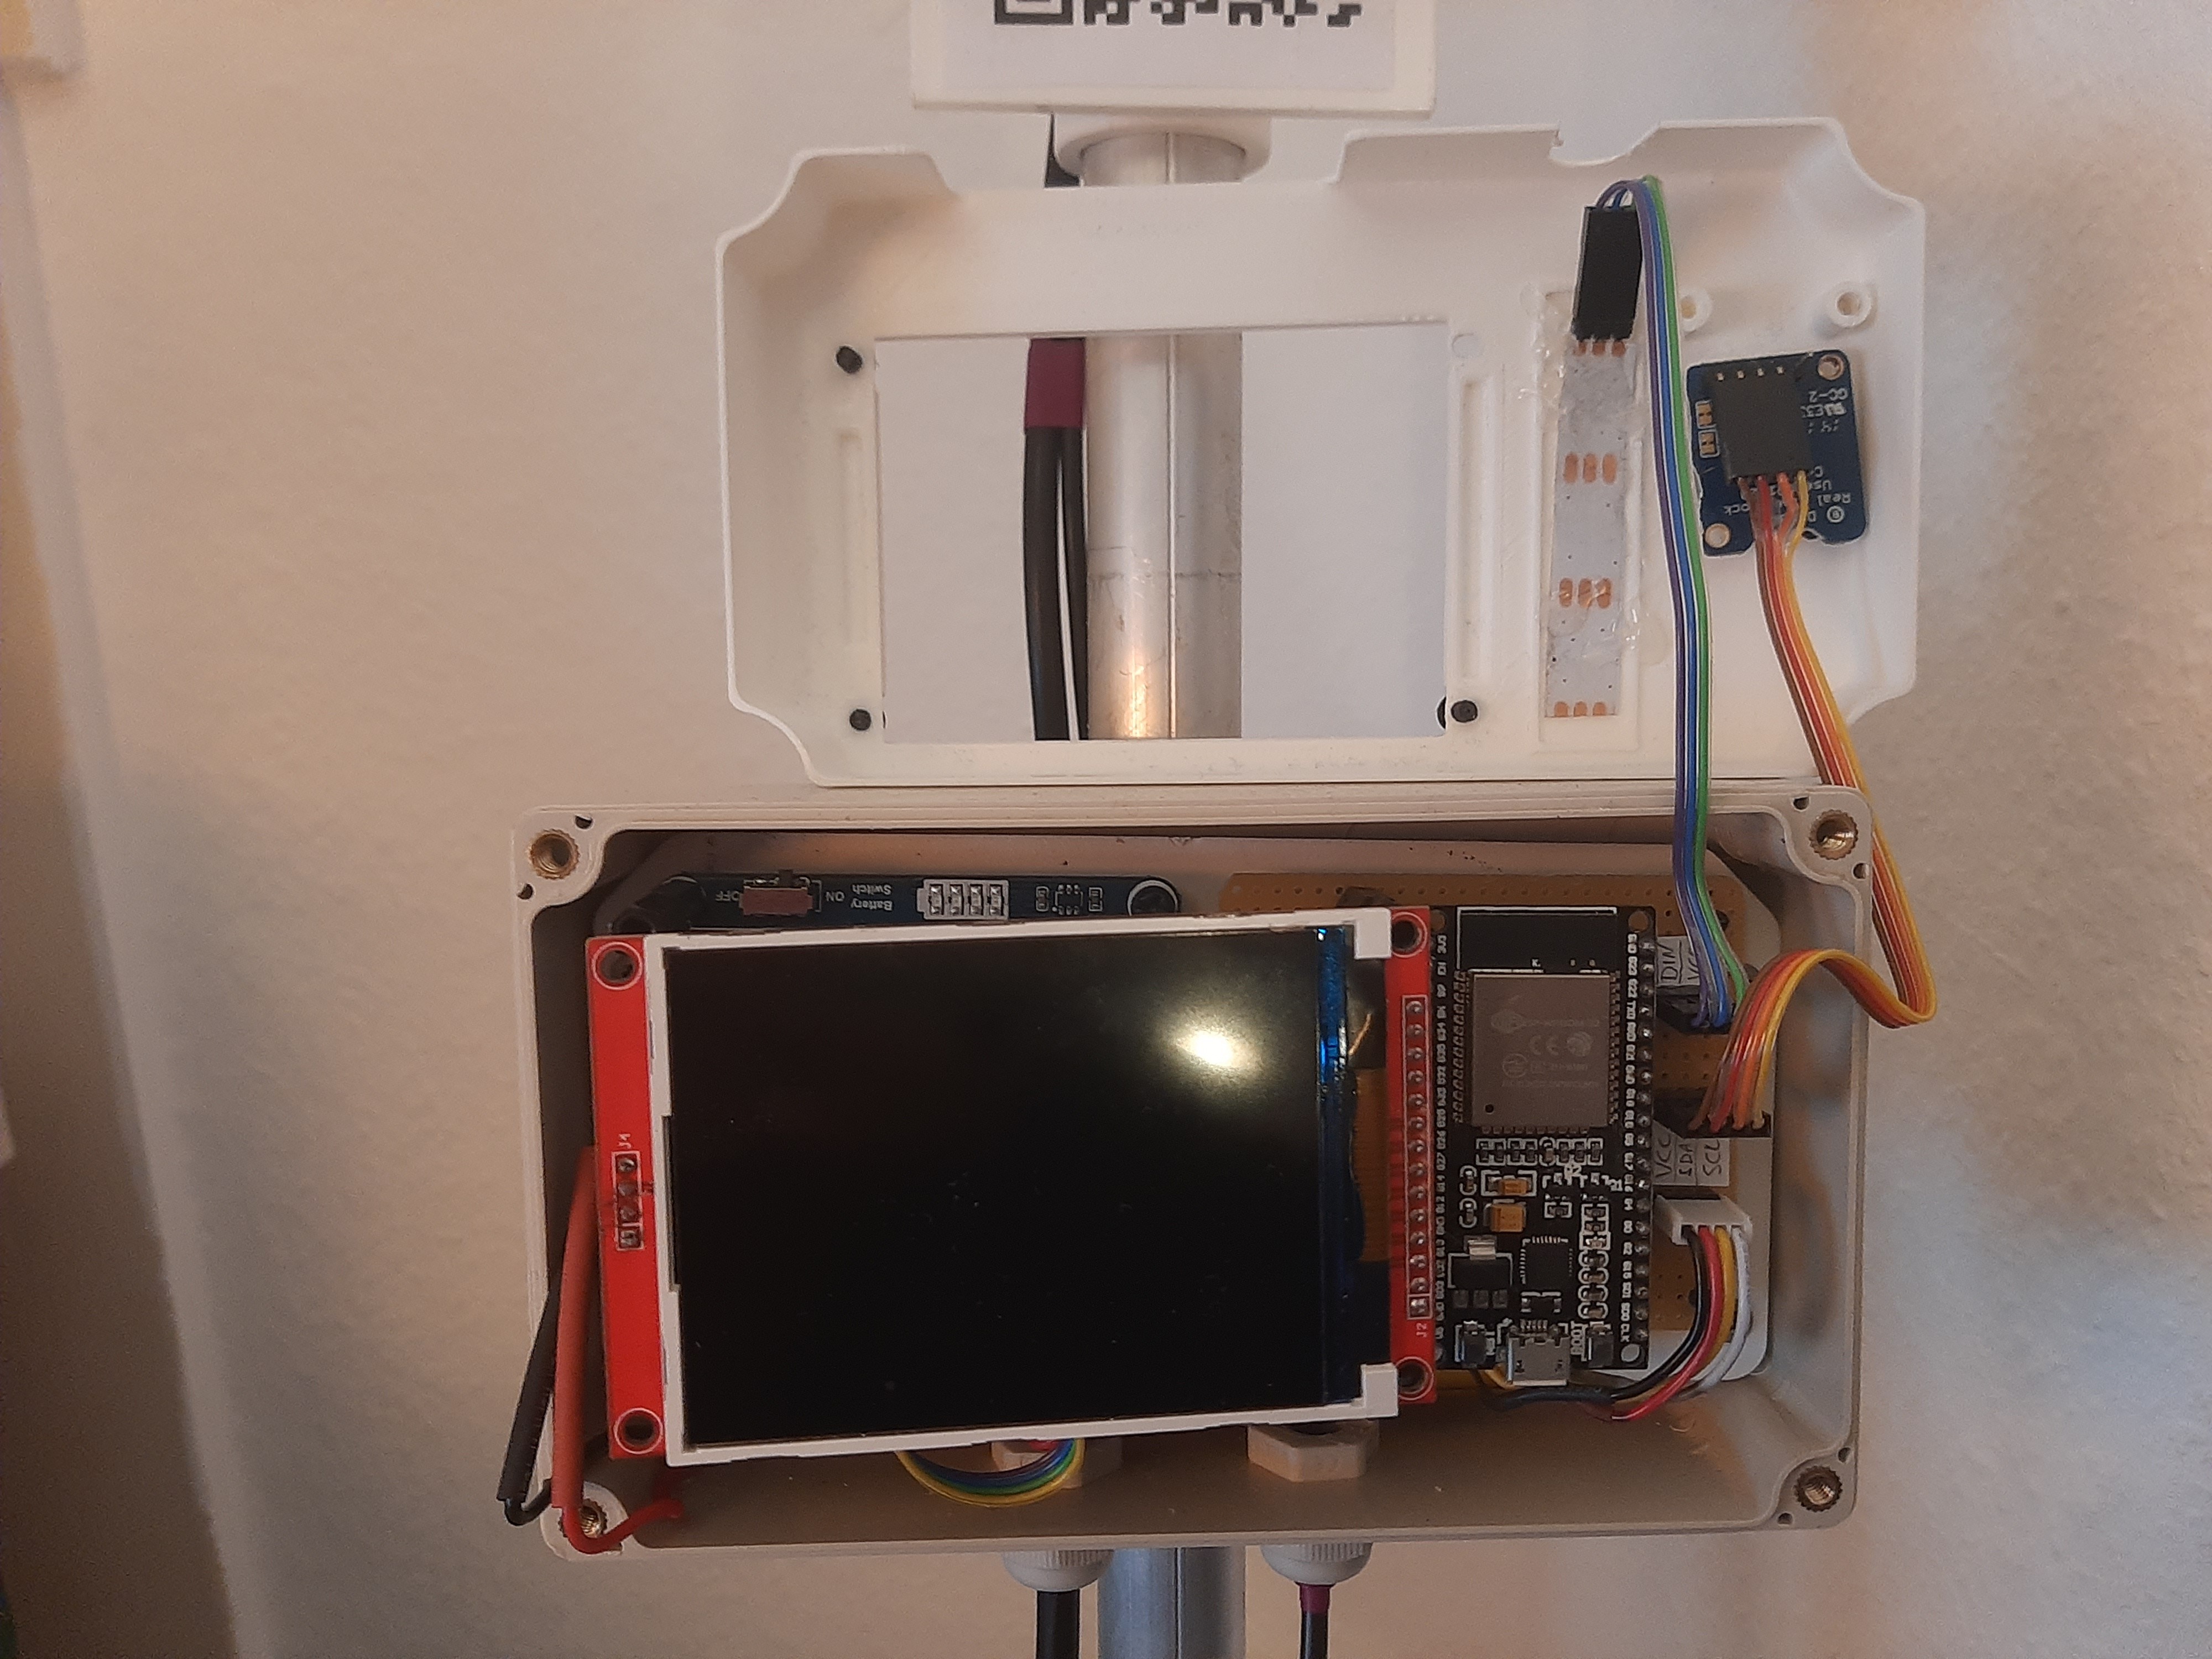
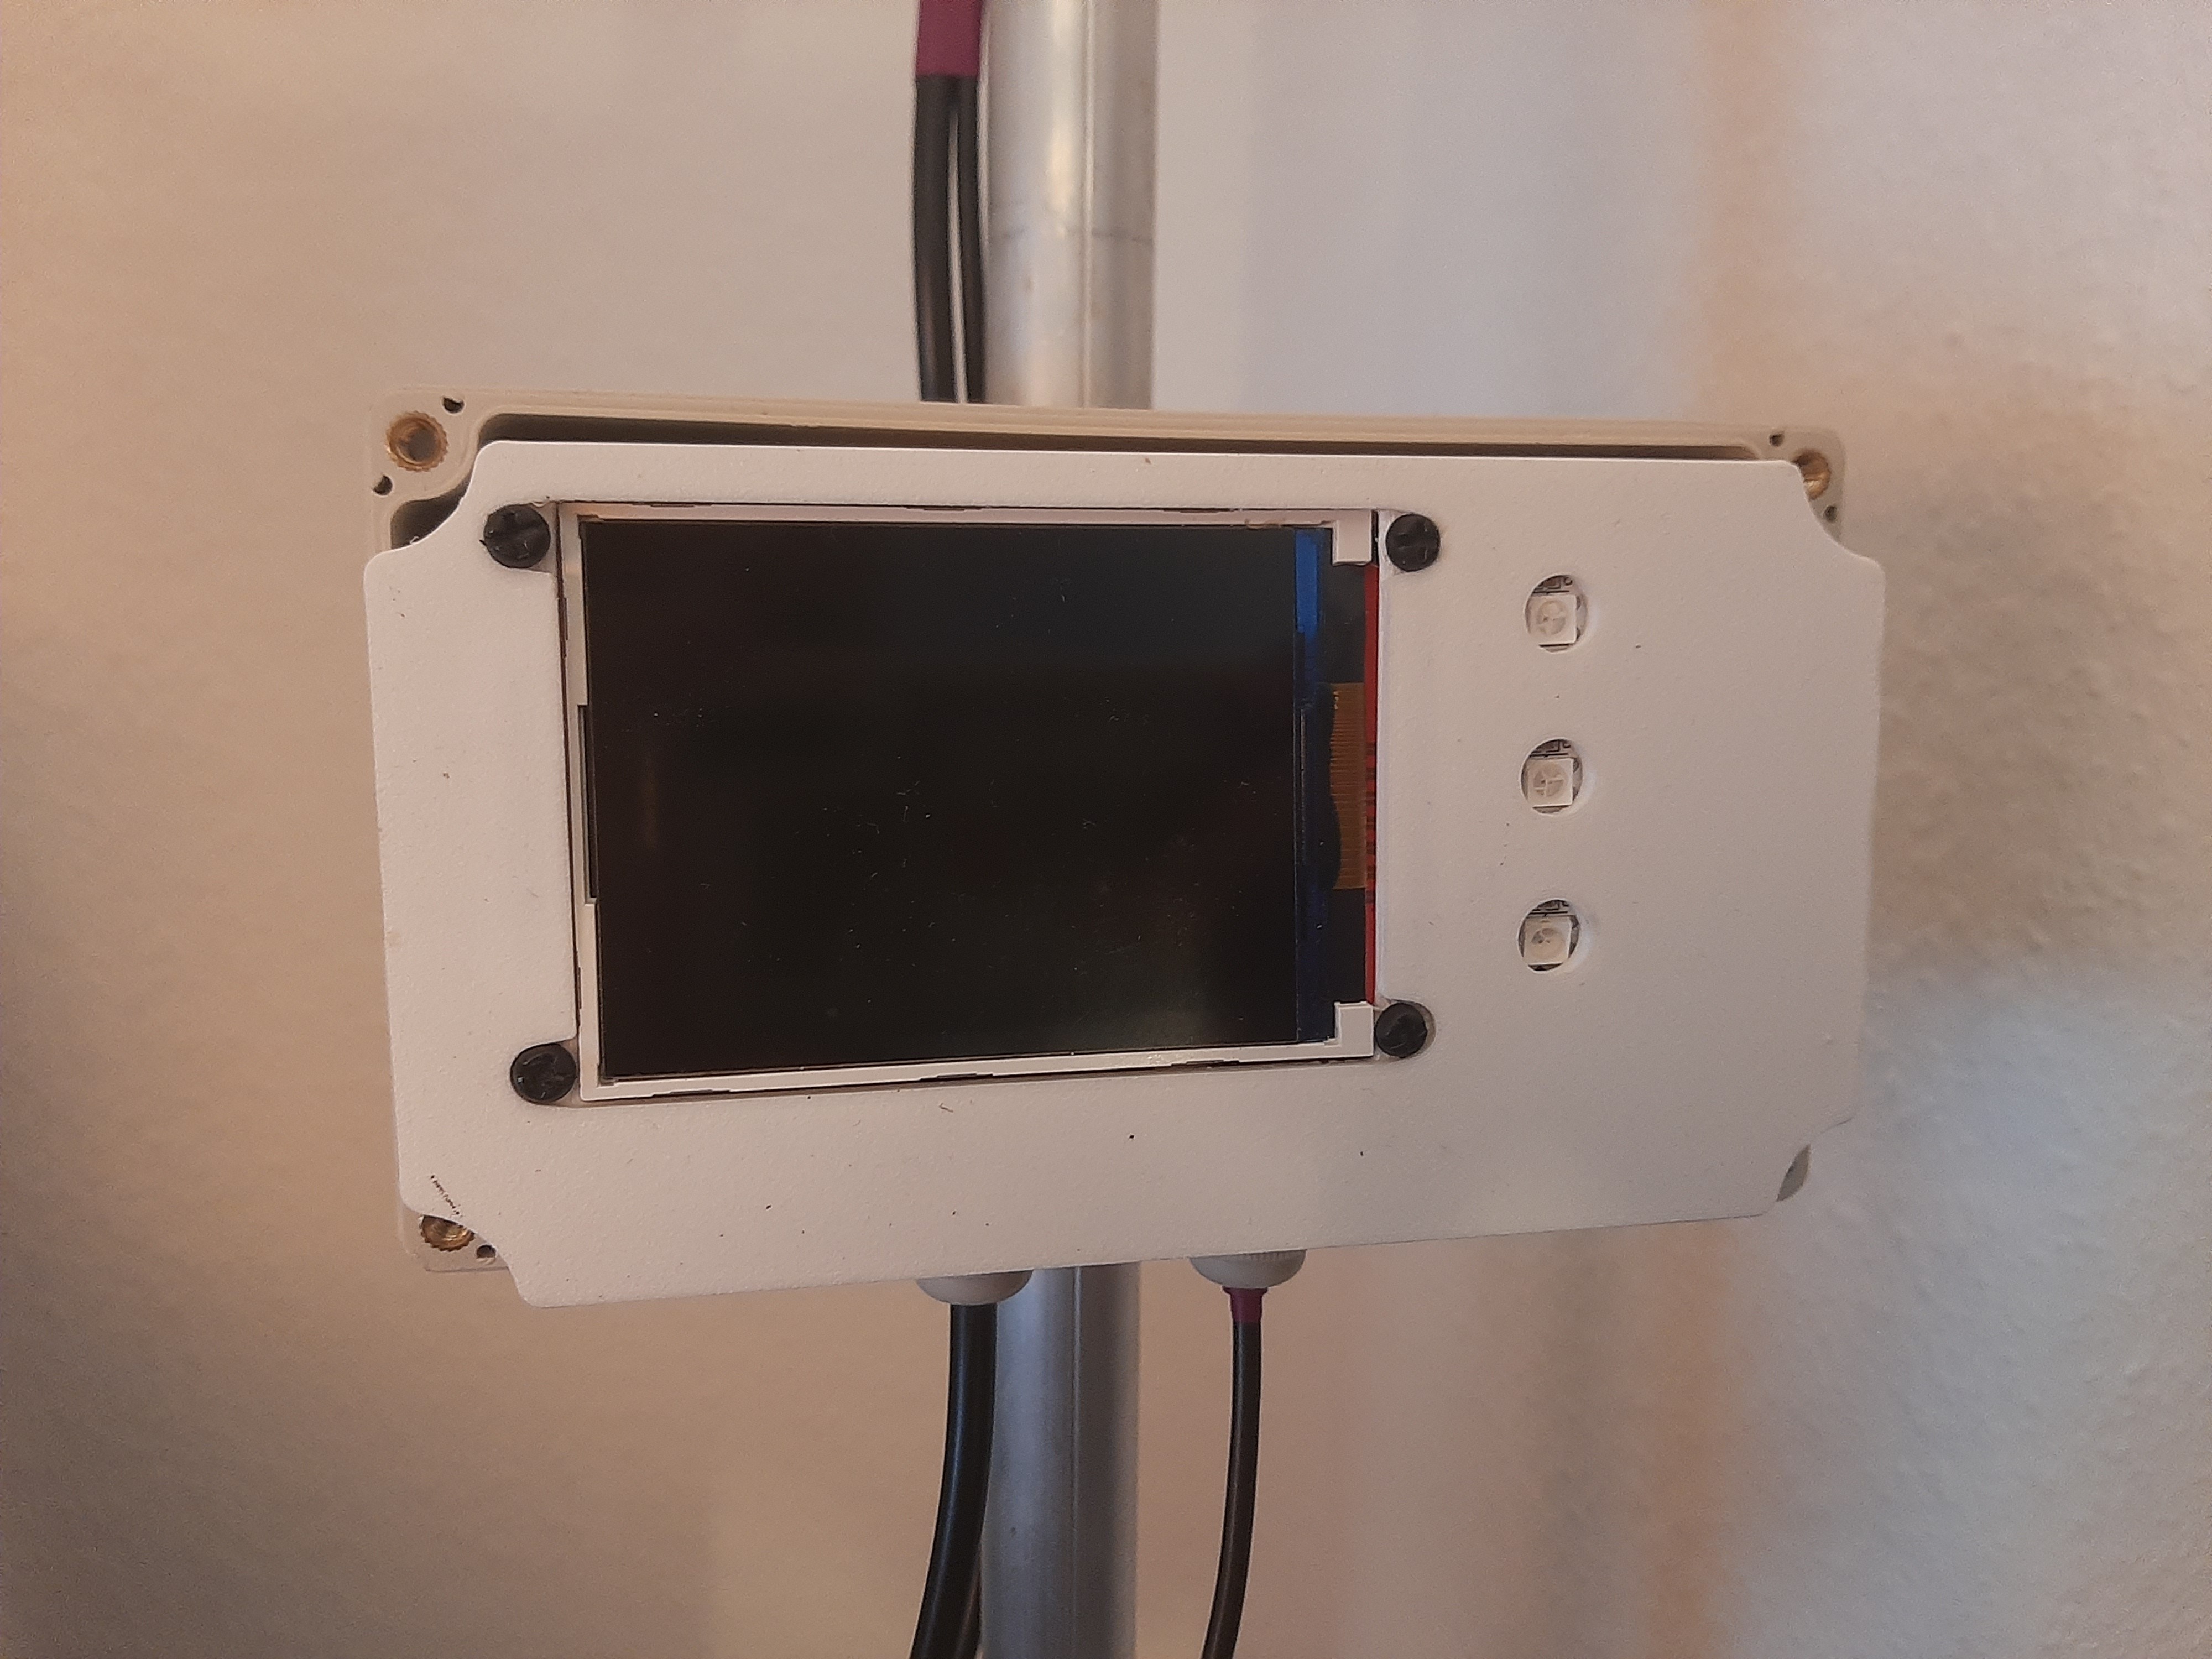
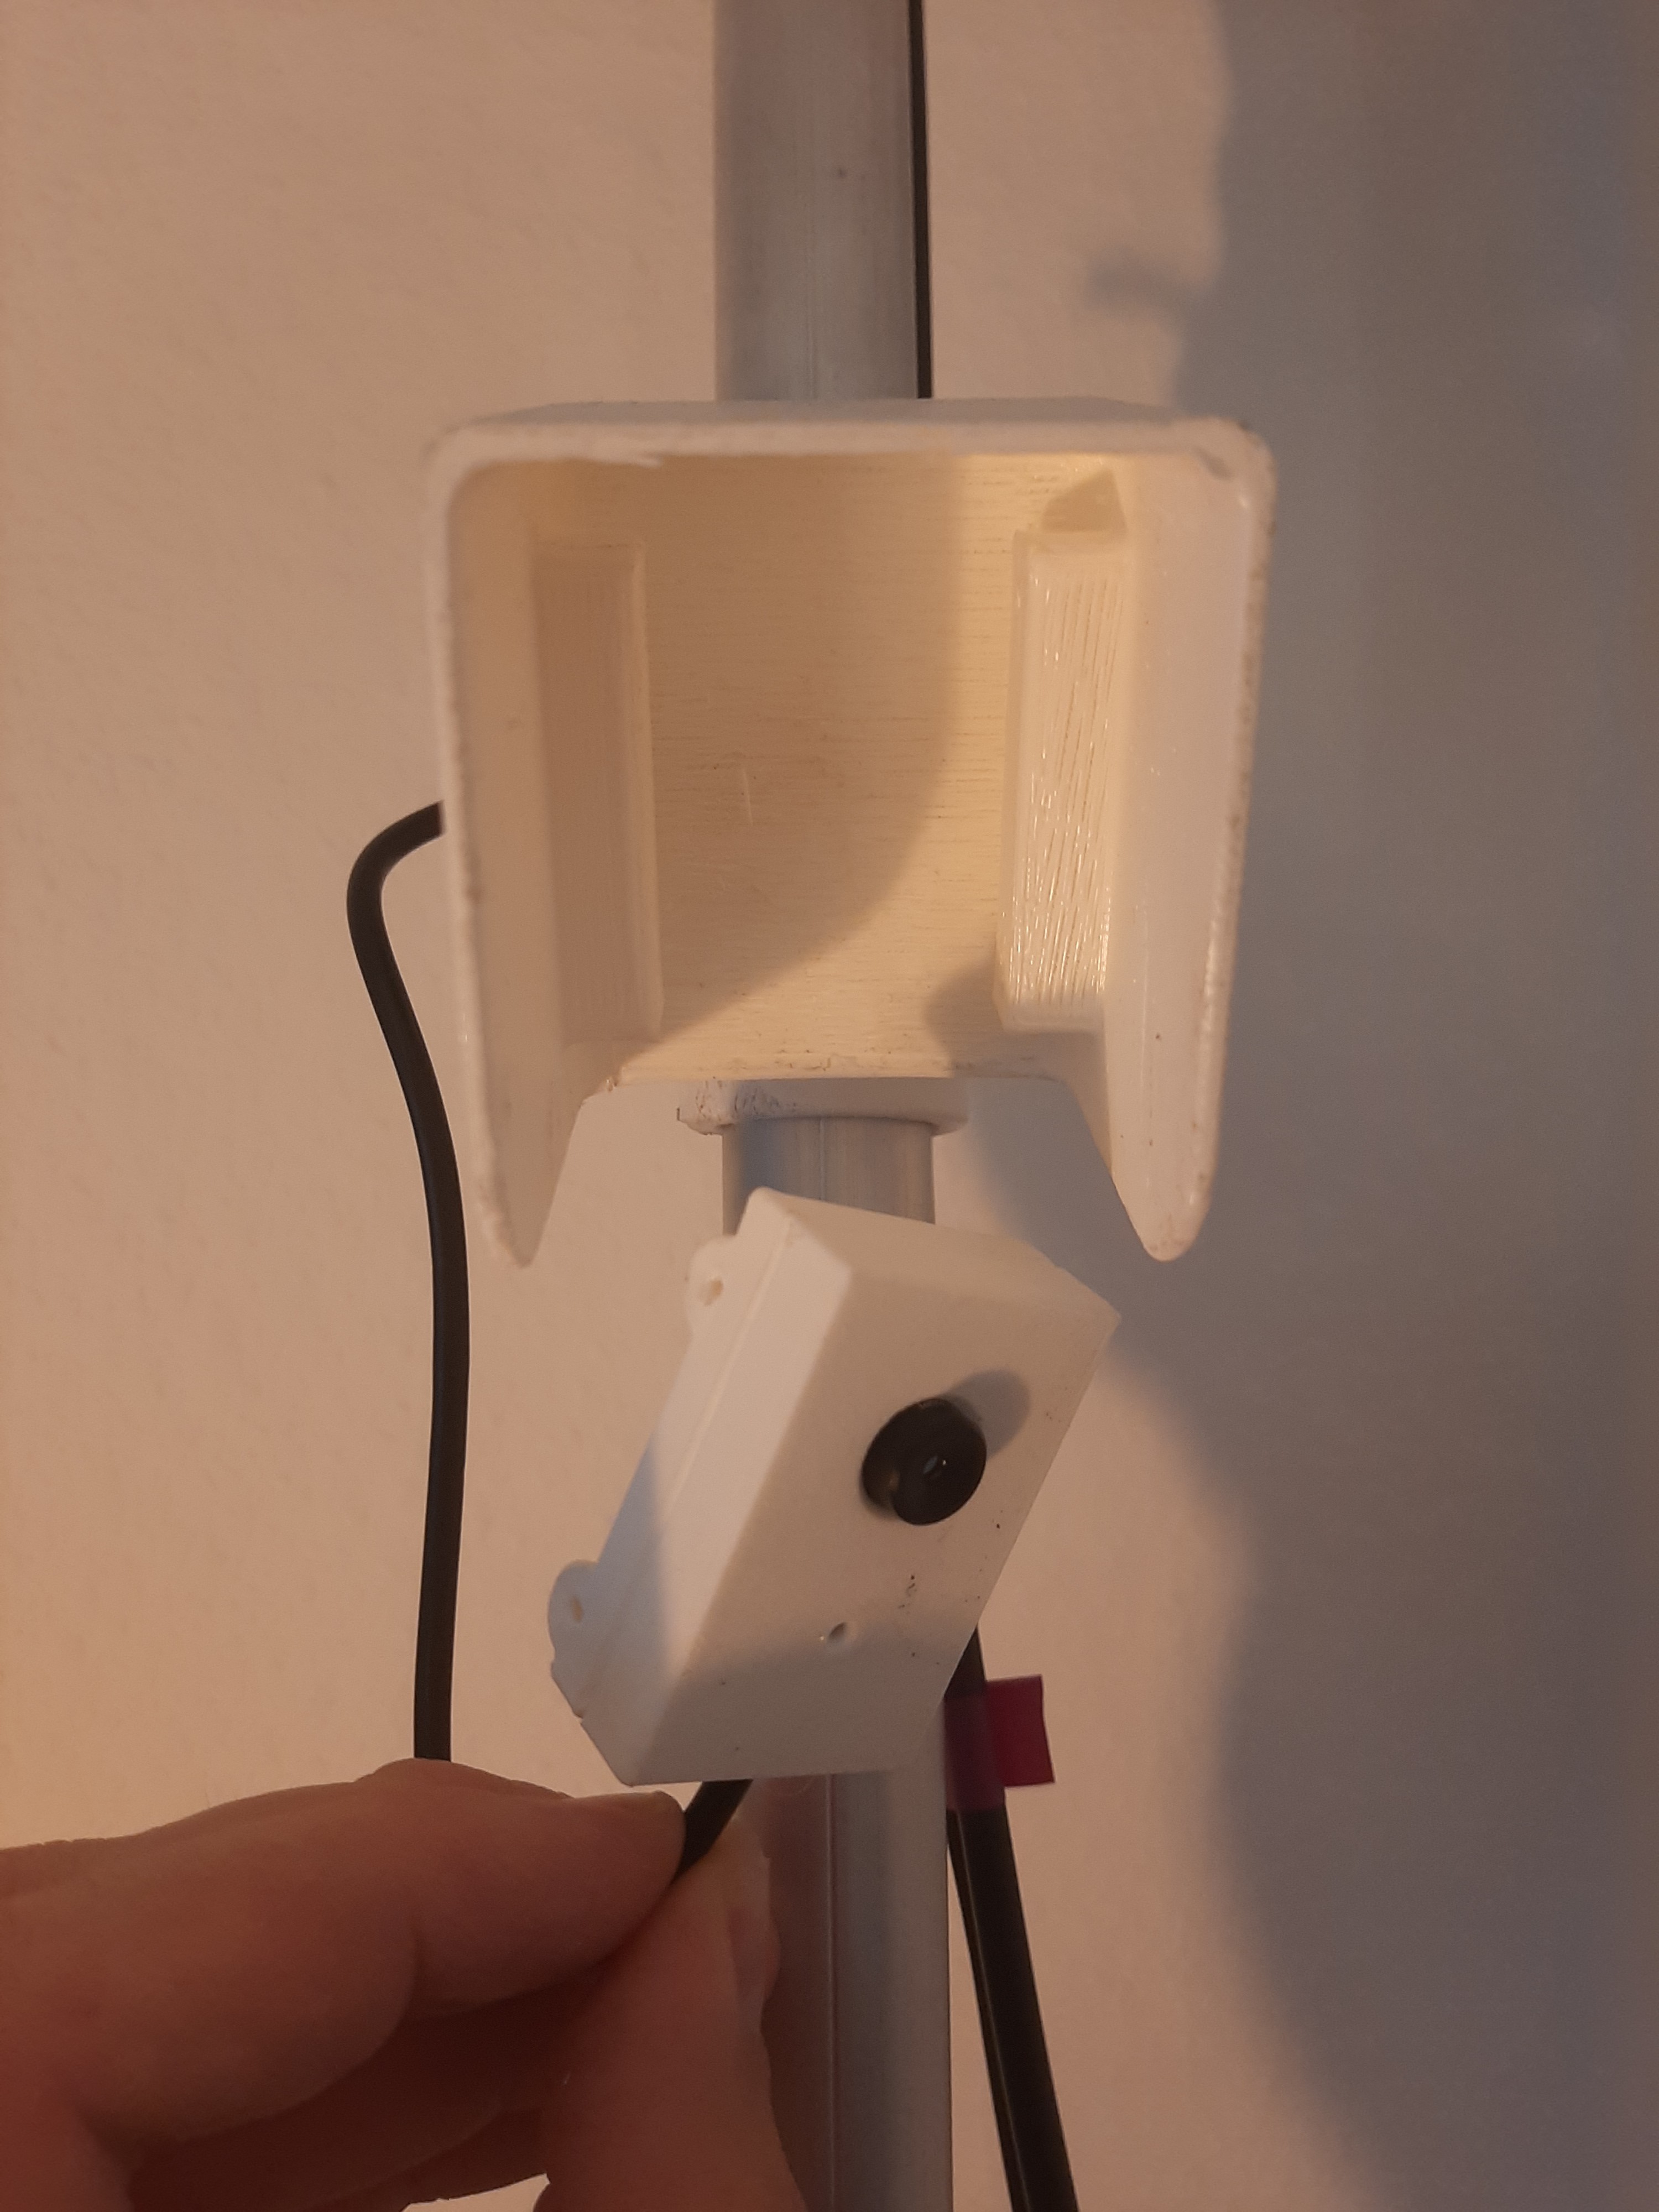
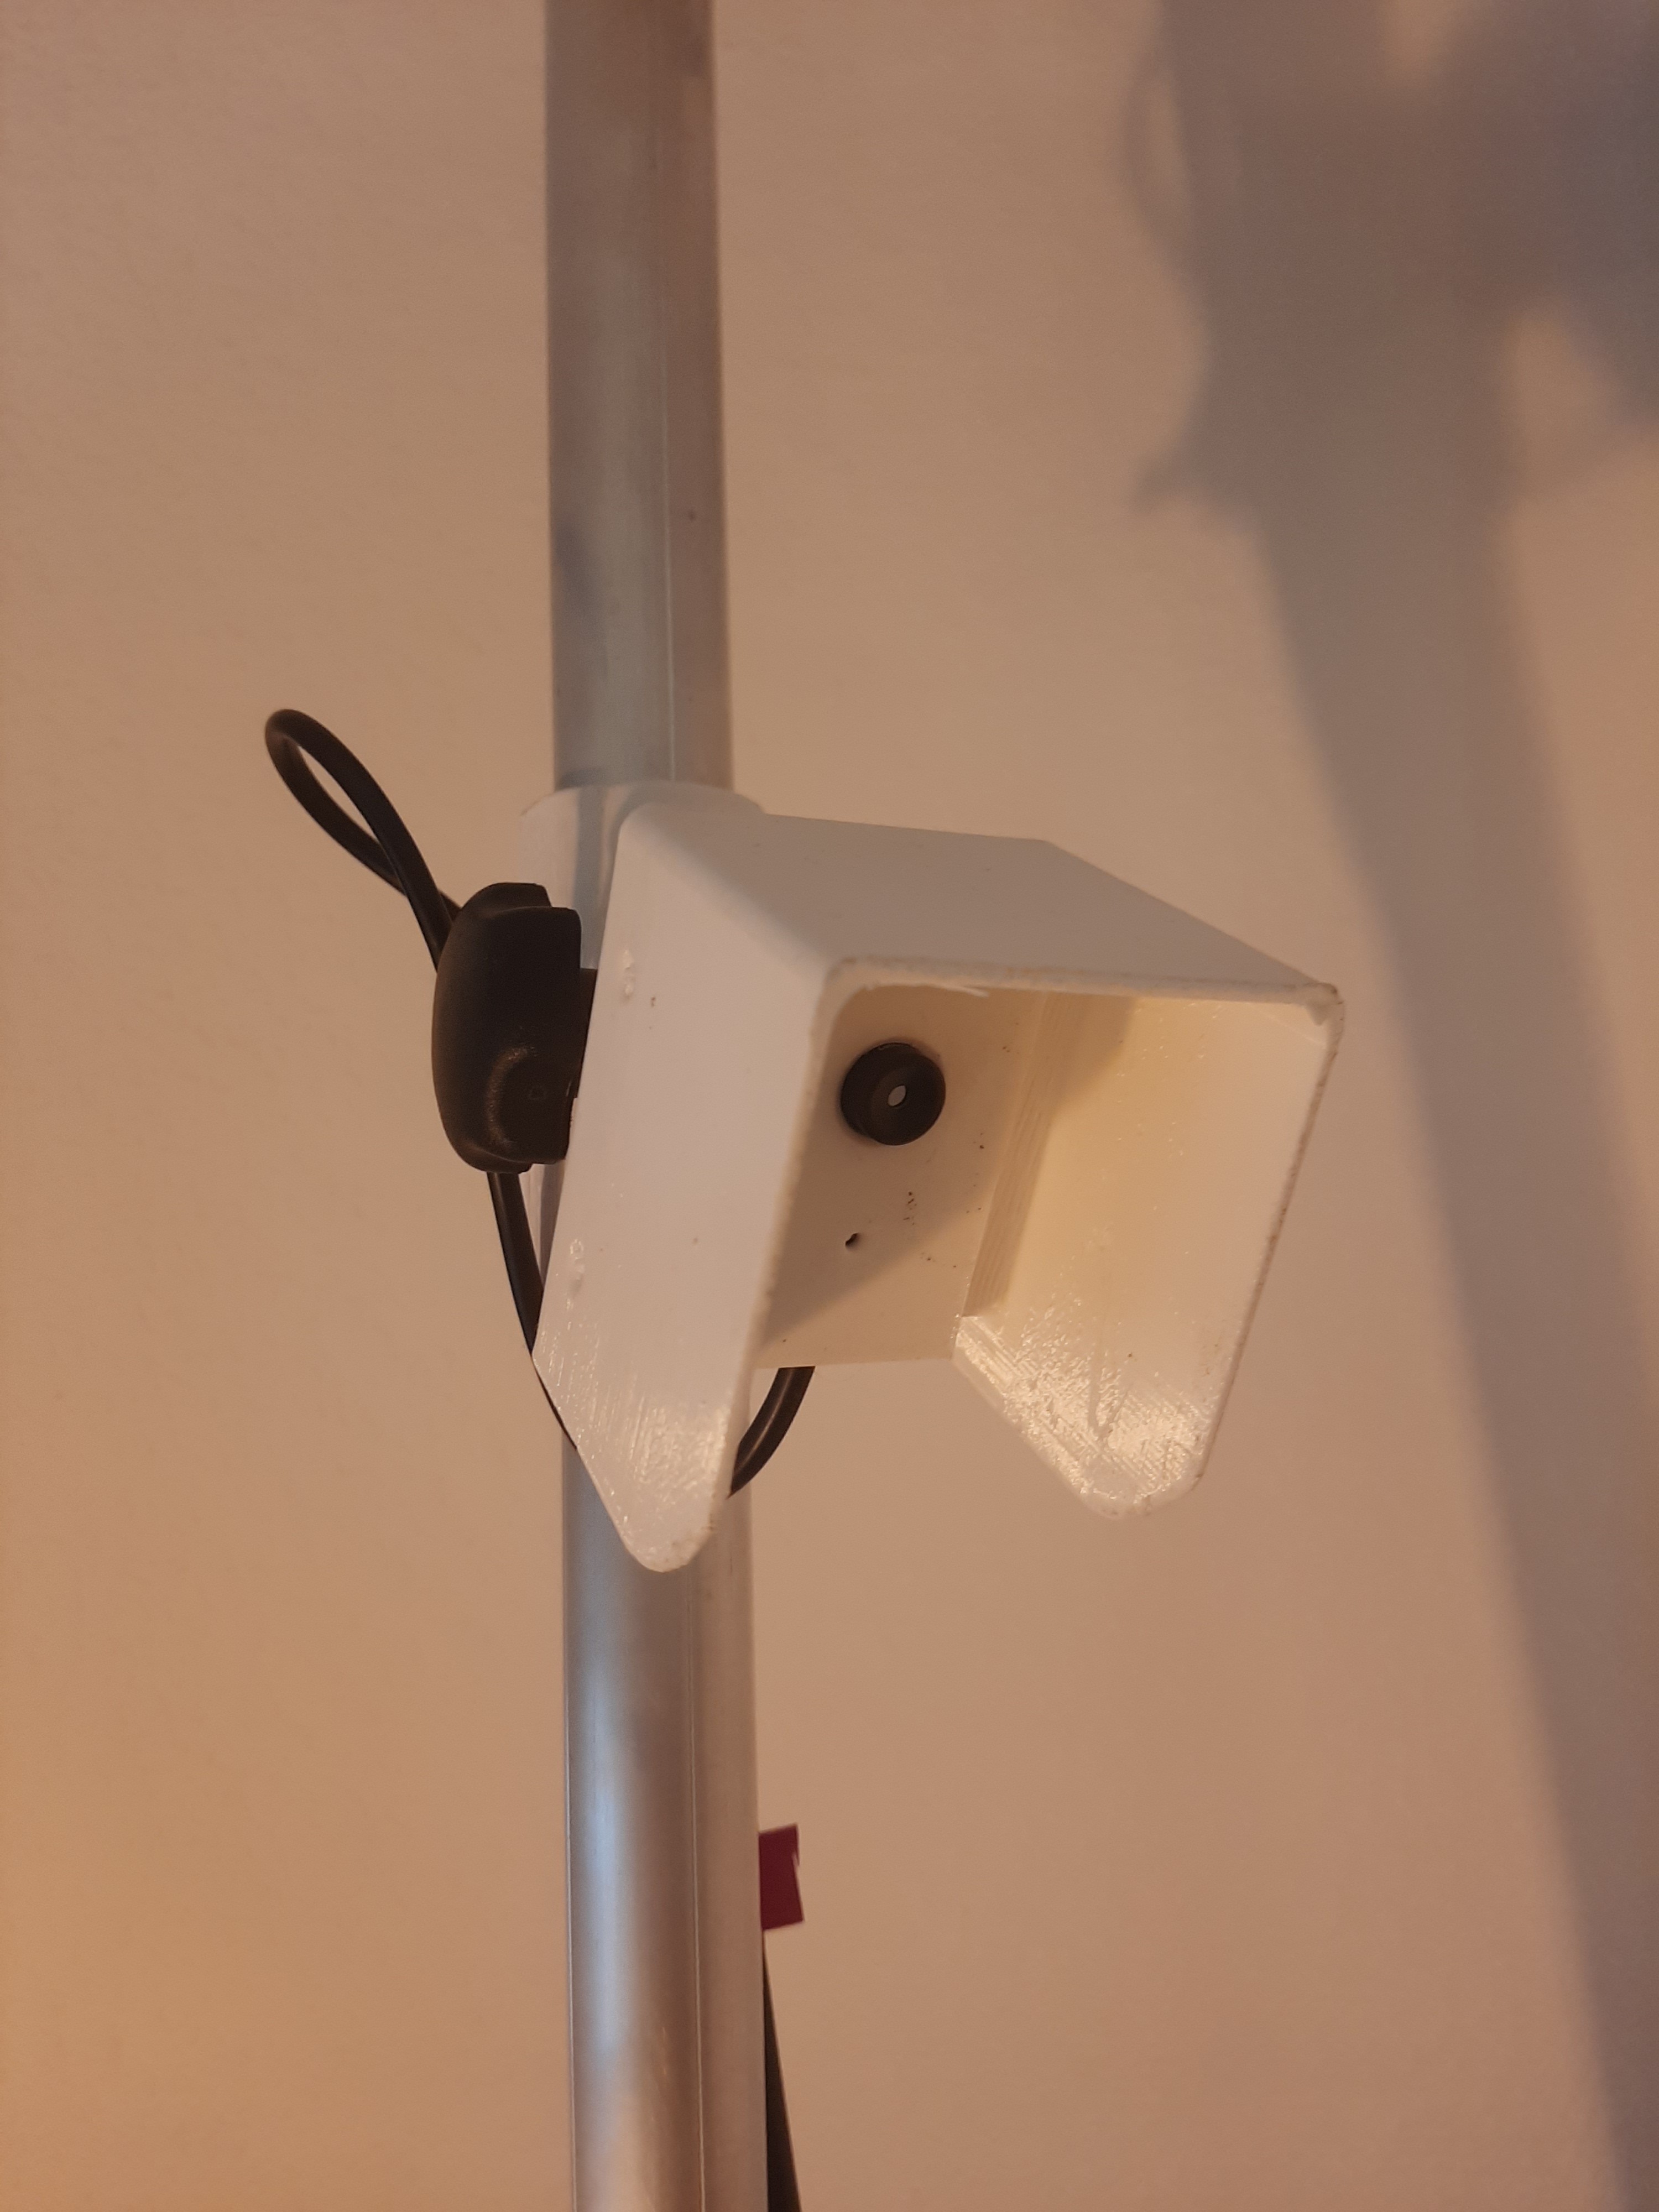
The Crop Water Stress Sensor is designed to intuitively show the often non-obvious water stress of our crops while collecting valuable time series data on an SD card. Using a low-cost thermal imaging camera (MLX90640), plant surface temperatures are recorded and the Crop Water Stress Index (CWSI) is applied using these data. The CWSI is the standard remote sensing method to calculate crop water stress e.g. from thermal satellite imagery and this index is ideal to apply with the data from the small thermal camera. The results of the CWSI are shown on the display (ILI9341 3.2") as current measurement, daily average, 14-day retrospective and 5-day trend (see below).
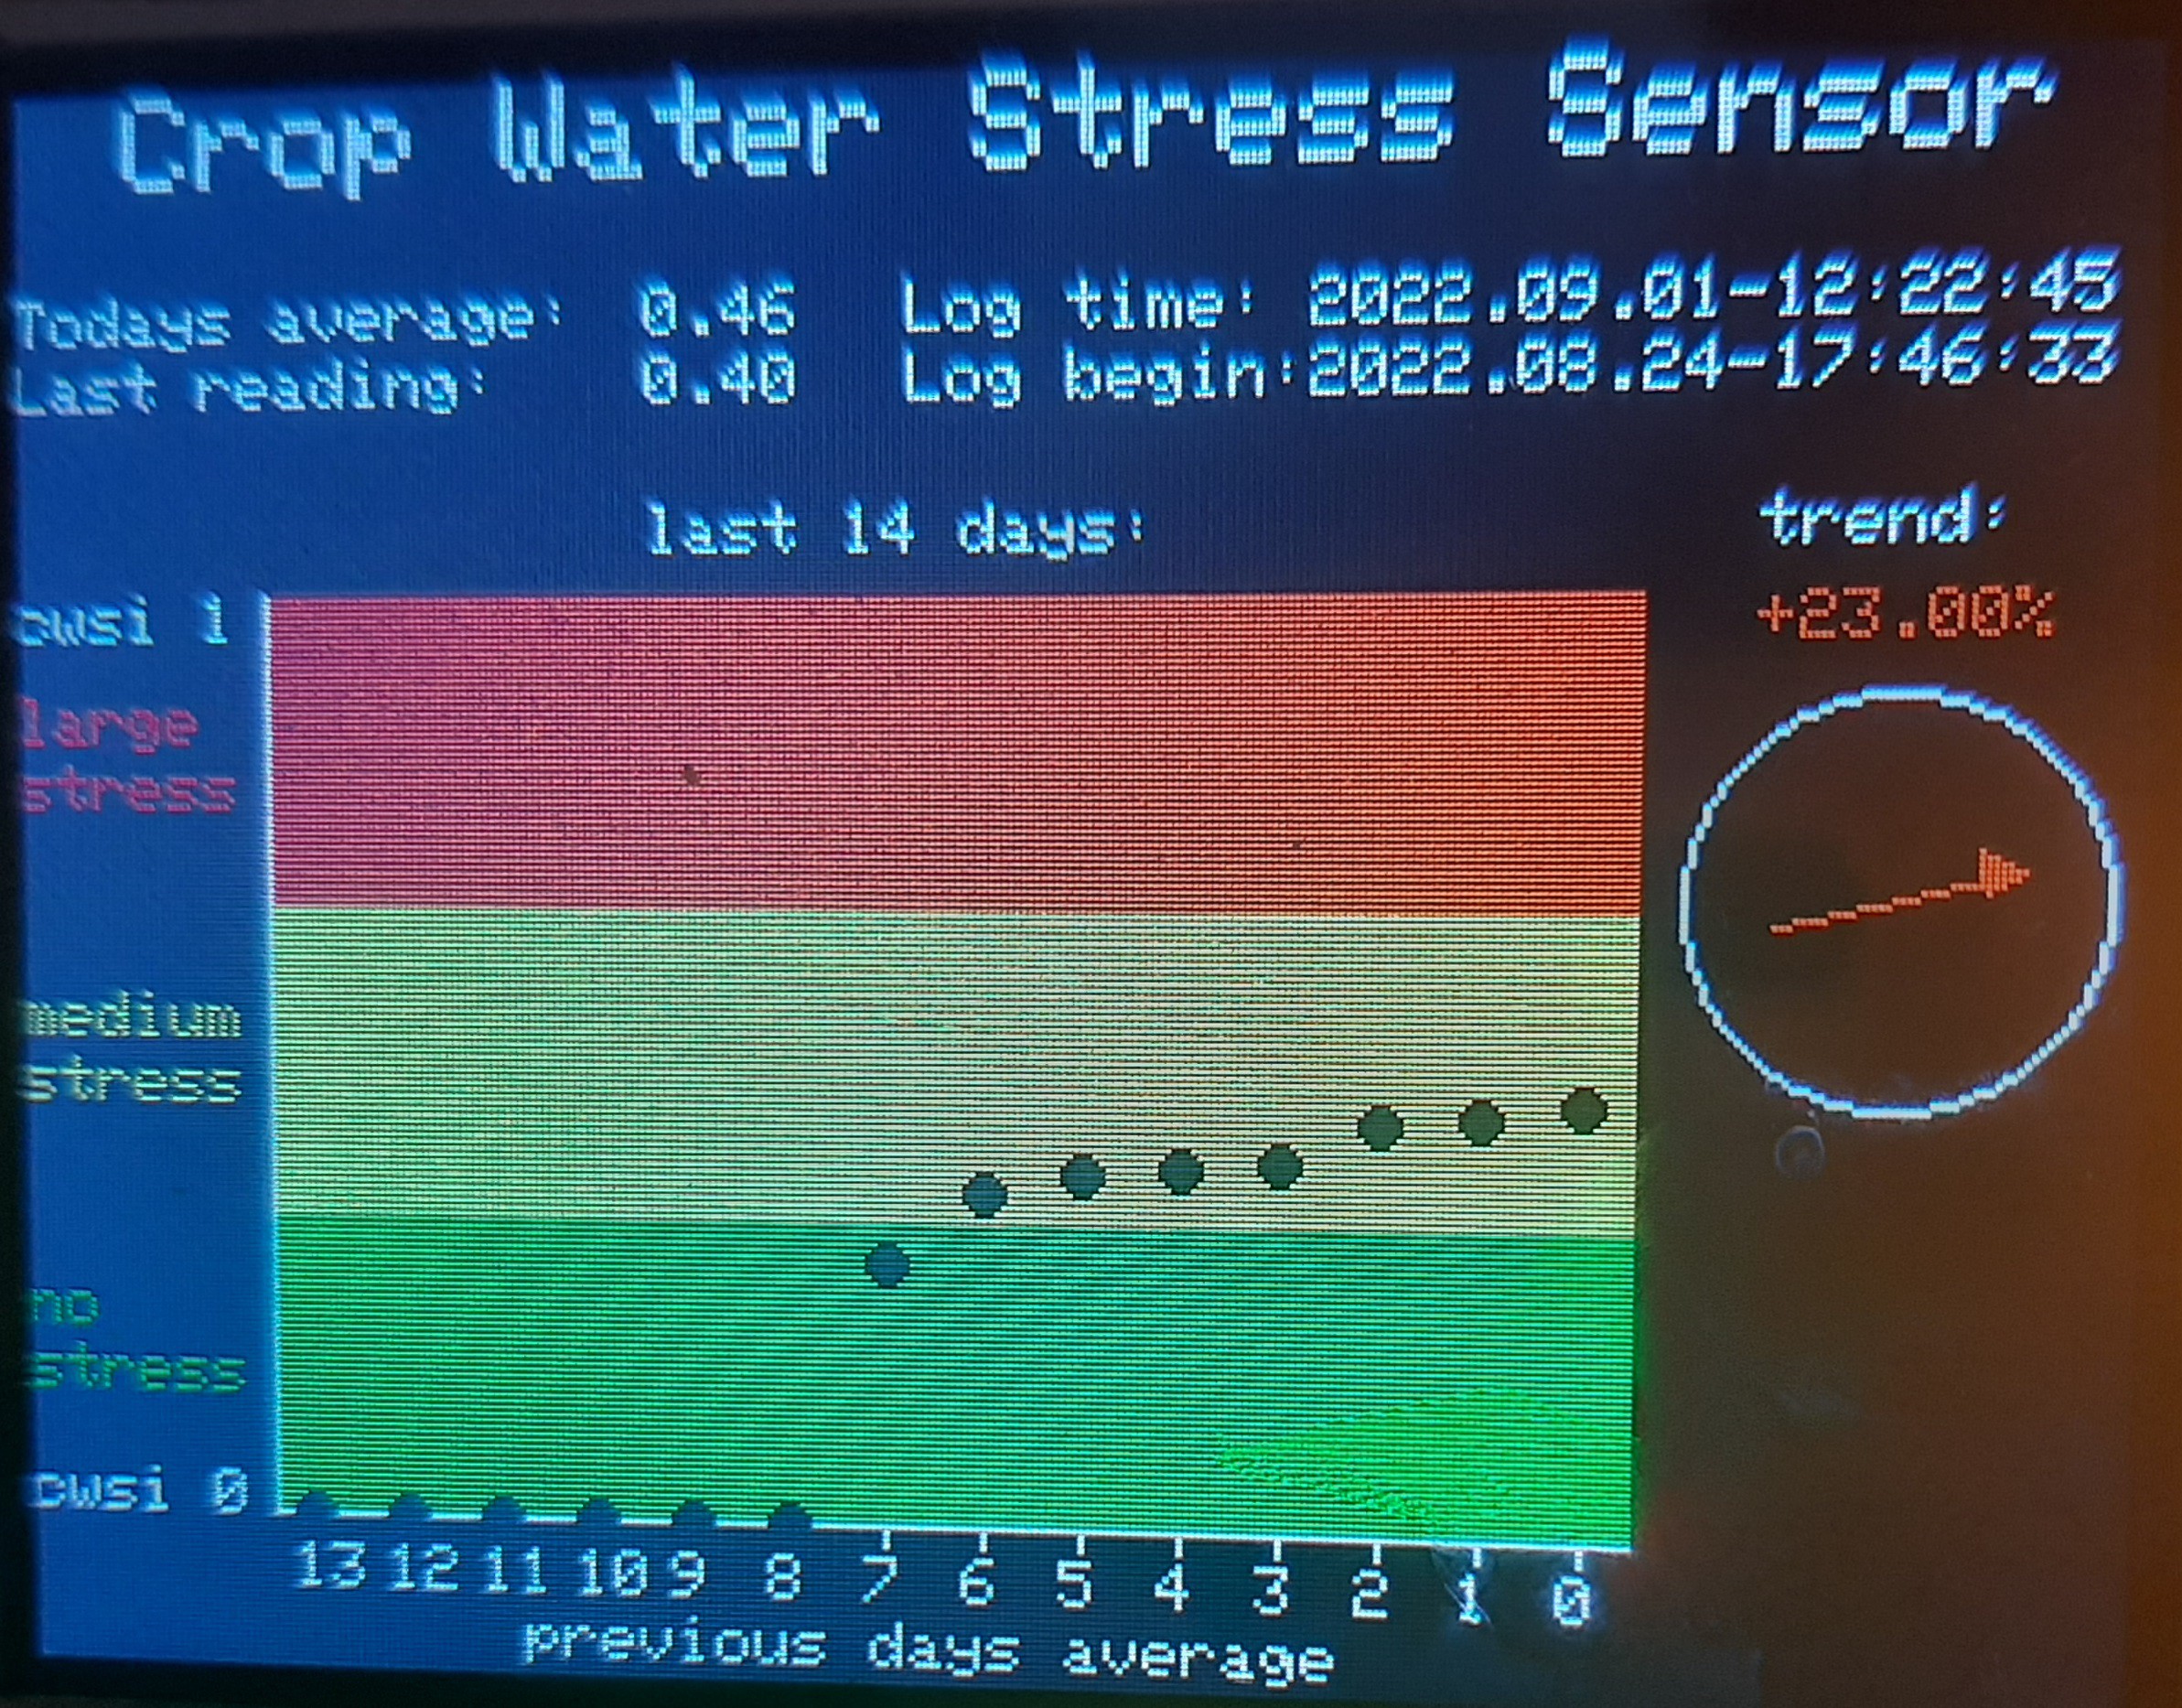
In the picture above you can see what the dashboard on the display looks like. The top section displays the current daily average of the crop water stress index and the last reading with the latest time stamp. I also thought it would be nice to display the timestamp of the first row of data that was logged on the SD card. The main figure of the dashboard shows the daily mean crop water stress values of the past 14 days. The background colors also indicate the severeness of the crop stress and are intended to be a visual aid. Since I didn't have the time to run the sensor for two weeks in the field yet, only the last 7 days and the current average are displayed on the screen so far.
Working in crop and climate science, people often tend to see me as a weatherman for crop performance predictions and one of their first questions is usually if I can predict how the crop is going to perform in the future. Since I also don't have crystal ball, I usually refer to a trend estimate based on a regression. To keep things simple here, I implemented a linear regression for the last five days of measurement and the resulting slope is then interpreted as the trend. There is a plethora of statistical procedures that I could use as alternatives here and maybe I'll change the procedure in the coming versions.
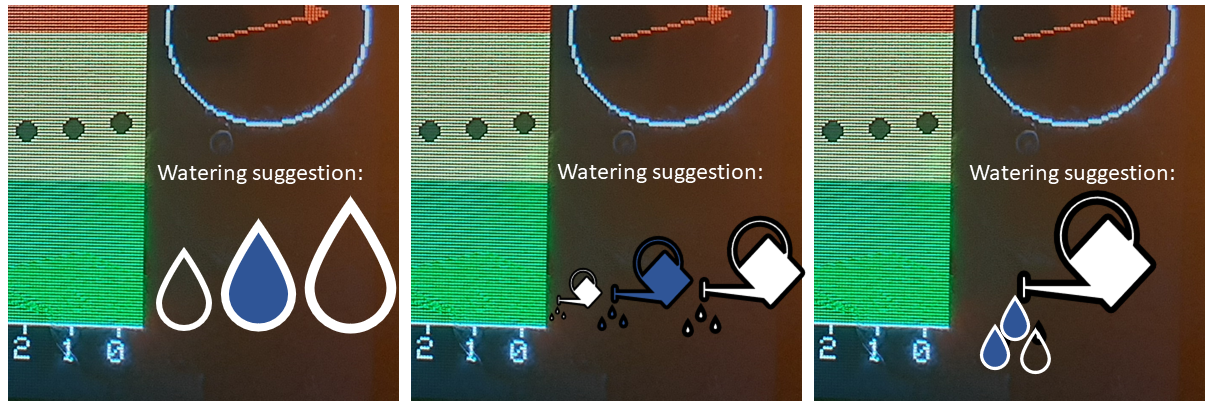
Finally there is still a big black spot that is not used on the display on the right bottom corner. I plan to integrate a watering suggestion here to give more practically usable advice to the people who look at this dashboard. I didn't have the time to implement any of this yet, but it could look like one of these suggestions:
During midday hours, the display is a little hard to read, since the sun light is usually very strong. I'm currently experimenting with other display types (such as E-ink) and anti-reflection films to see if I can improve the visibility of the prototype. However, the simplest solution to display the CWSI results during the sunniest hours of the day would be a simple "traffic light" style based on cheap Neo-pixels. Here, green light indicates no or low drought stress, orange...
Read more »


 patelDipen
 Ostapsky
 Reinier van der Lee