Close
0%
0%

Get an Internet-Of-Things thing on the Internet

Monitoring the temperature of the water in my home's hydronic heating plant.

Similar projects worth following
I've never had a baseboard hot-water heating system before and it seemed to be running poorly.

It would start a fire, run the boiler water up to about 200F and turn off the fire. When the water temp cooled to around 150F, the fire started up again.

I wanted to see how often each of the three zones of water ran, what temperature the outputs and return lines were etc.

So I hooked everything up to an Arduino and pushed the data to "the cloud".

I didn't do much research before diving in, so the system could be improved.

I have WiFi in the house, and the heating plant is in the basement which is 2 floors away from my main living area, so I couldn't get a wired Ethernet cable down there.

I decided to put WiFi on the monitor in the basement and let it connect to the WiFi upstairs.

Rather than doing ot the normal way of having an Arduino/WiFi shield, I used an Arduino/Ethernet shield, so I needed to get a WiFi bridge setup.

I found an old Linksys router and installed DD-WRT and got it configured in "Client Bridge" mode which took about TWO DAYS OF FRUSTRATION. But following the instructions EXACTLY made it work, so the Ethernet downstairs is just like the Ethernet upstairs and the Arduino can connect to servers in the outside world.

  • 1 × Arduino MEGA 2560 From RadioShack
  • 6 × TMP36 temperature sensors From sparkfun
  • 1 × Ethernet shield From RadioShack
  • 1 × Old Linksys WiFi/Router Reflashed to run DD-WRT

  • CC3200 to the rescue!

    Alan Kilian01/06/2016 at 15:13 0 comments

    I managed to the the Xively C client running on the TI CC3200 Launch-XL module.

    This is going to be the perfect platform for the new boiler monitor using Xively.

    I will be able to publish temperatures and even (if I want to) subscribe to channels so I could control the boiler remotely.

    Also, Jeff gave me a board with five Opto-22 input modules, so I'll get those hooked up to monitor the three "call-for'heat" signals and the gas-valve-open signals so I can publish those along with the temperature data.

    I'll need to look into the analog inputs on the CC3200 or build an A/D and connect it Nothing too difficult.

    This is very exciting.

  • New job!

    Alan Kilian03/07/2015 at 16:51 0 comments

    I just took a job at an actual Internet Of Things company (Xively), so I'll soon be replacing this with an actual professional IOT system. I'll keep this project log updated as I learn how to use the professional toys.

  • Remaining problem

    Alan Kilian02/14/2015 at 20:43 0 comments

    Sometimes the system stops sending data to sparkfun.

    If I reset the Arduino it doesn't help.

    If I power-cycle the Linksys running DD-WRT, it comes back, so there's something wrong over there.

    I think I'll change to using a WiFi shield now that I know what I'm doing and get rid of the Linksys/DD-WRT altogether.

  • Here's the Arduino code to read 6 TMP036 sensors, average them and push them up to data.sparkfun.com

    Alan Kilian02/14/2015 at 20:40 0 comments

    Here's the code for my Arduino MEGA2560 and whatever Ethernet shield I got.

    It came from sparkfun's example page and I just added reading the six analog inputs, averaging several samples and converting to degree-F before pushing the data to sparkfun.

    /*****************************************************************
    Phant_Ethernet.ino
    Post data to SparkFun's data stream server system (phant) using
    an Arduino and an Ethernet Shield.
    Jim Lindblom @ SparkFun Electronics
    Original Creation Date: July 3, 2014
    
    This sketch uses an Arduino Uno to POST sensor readings to 
    SparkFun's data logging streams (http://data.sparkfun.com). A post
    will be initiated whenever pin 3 is connected to ground.
    
    Before uploading this sketch, there are a number of global vars
    that need adjusting:
    1. Ethernet Stuff: Fill in your desired MAC and a static IP, even
       if you're planning on having DCHP fill your IP in for you.
       The static IP is only used as a fallback, if DHCP doesn't work.
    2. Phant Stuff: Fill in your data stream's public, private, and 
    data keys before uploading!
    
    Development environment specifics:
        IDE: Arduino 1.0.5
        Hardware Platform: RedBoard & PoEthernet Shield
    
    This code is beerware; if you see me (or any other SparkFun 
    employee) at the local, and you've found our code helpful, please 
    buy us a round!
    
    Much of this code is largely based on David Mellis' WebClient
    example in the Ethernet library.
    
    Distributed as-is; no warranty is given.
    *****************************************************************/
    #include <SPI.h> // Required to use Ethernet
    #include <EthernetV2_0.h> // The Ethernet library includes the client
    
    ///////////////////////
    // Ethernet Settings //
    ///////////////////////
    // Enter a MAC address for your controller below.
    byte mac[] = { 0xDE, 0xAD, 0xBE, 0xEF, 0xFE, 0xED };
    // if you don't want to use DNS (and reduce your sketch size)
    // use the numeric IP instead of the name for the server:
    //IPAddress server(54,86,132,254);  // numeric IP for data.sparkfun.com
    char server[] = "data.sparkfun.com";    // name address for data.sparkFun (using DNS)
    // Set the static IP address to use if the DHCP fails to assign
    IPAddress ip(192,168,2,200);
    
    // Initialize the Ethernet client library
    // with the IP address and port of the server 
    // that you want to connect to (port 80 is default for HTTP):
    EthernetClient client;
    
    /////////////////
    // Phant Stuff //
    /////////////////
    const String publicKey = "YOURPUBLIKKEY";
    const String privateKey = "YOURPRIVATEKEY";
    const byte NUM_FIELDS = 6;
    const String fieldNames[NUM_FIELDS] = {"boilerout", "boilerreturn", "zone2out", "zone2return", "zone3out", "zone3return"};
    String fieldData[NUM_FIELDS];
    #define BOILEROUT     0
    #define BOILERRETURN  1
    #define ZONE2OUT      2
    #define ZONE2RETURN   3
    #define ZONE3OUT      4
    #define ZONE3RETURN   5
    
    #define LEDPIN 13
    //////////////////////
    // Input Pins, Misc //
    //////////////////////
    #define SDCARD_CS 4
    
    bool print = 0;
    
    void setup()
    {
      // Set Up Ethernet:
      // start serial port:
      Serial.begin(9600);
      pinMode(SDCARD_CS,OUTPUT);
      pinMode(0, INPUT);
      pinMode(1, INPUT);
      pinMode(2, INPUT);
      pinMode(3, INPUT);
      pinMode(4, INPUT);
      pinMode(5, INPUT);
      
      pinMode(LEDPIN, OUTPUT);
      
      digitalWrite(SDCARD_CS,HIGH);//Deselect the SD card
      
      // give the ethernet module time to boot up:
      delay(1000);
      // start the Ethernet connection:
      if (Ethernet.begin(mac) == 0) {
        if(print) Serial.println("Failed to configure Ethernet using DHCP");
      }
    
      Serial.println(F("=========== Ready to Stream ==========="));
    }
    
    void loop()
    {
      int i,j;
      float temps[NUM_FIELDS][10];
      float average[NUM_FIELDS];
      char buffer[80];  // Buffer to convert from binary to ASCII
    
      // Read each sensor ten times at a rate of 1 Hz. THis takes (10 times NUM_SAFIELDS) in seconds (60 for this example)
      for(i=0;i<10;i++) {
        for(j=8;j<8+NUM_FIELDS;j++) {
          analogRead(j);
          delay(10);
          analogRead(j);
          delay(10);
          temps[j-8][i] = ((((analogRead(j) * 5.0) / 1024.0) - 0.5) * 100 * 9.0 / 5.0) + 32.0;
          if(print) Serial.print(j-8); if(print) Serial.print(...
    Read more »

  • How to graph the data?

    Alan Kilian02/10/2015 at 18:04 0 comments

    Looking around for sparkfun IOT chart, I found that imp.guru can grab and plot data from sparkfun if you just hand over the public keys!

    So I have imp.guru/f48 showing live data. NICE!

    But I wanted to make charts with Input and Output temperatures together, I stumbled onto phant.io http://phant.io/graphing/google/2014/07/07/graphing-data/ where they describe how to use google charts to plot data.

    I took a few hours and got charts! http://bobodyne.com/boiler

    I'm pretty happy that I can look at the boiler, show other engineers what's going on and keep track of things.

    I want to add temp sensors on zone #1 (Basement) and maybe an outside air temperature also.

  • Where to push the data?

    Alan Kilian02/10/2015 at 17:59 0 comments

    I looked at Exosite.com to see if I could use their service for free for a while and didn't get it working with their Arduino examples.

    It turns out that there are two different Ethernet shields/libraries and the Exosite examples were for the other one.

    But I did find that sparkfun has a data service and Arduino examples at data.sparkfun.com and I was running almost immediately.

View all 6 project logs

Enjoy this project?

Share

Discussions

Alan Kilian wrote 03/11/2015 at 12:30 point

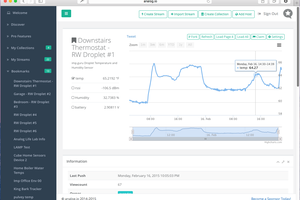
YES! That's my boiler!

Also, http://www.bobodyne.com/boiler

  Are you sure? yes | no

Luke Beno wrote 03/11/2015 at 05:01 point

Congratulations on the new job!

Before you make the transition to Xively, you might want to check out http://imp.guru/f48

  Are you sure? yes | no

Similar Projects

Does this project spark your interest?

Become a member to follow this project and never miss any updates