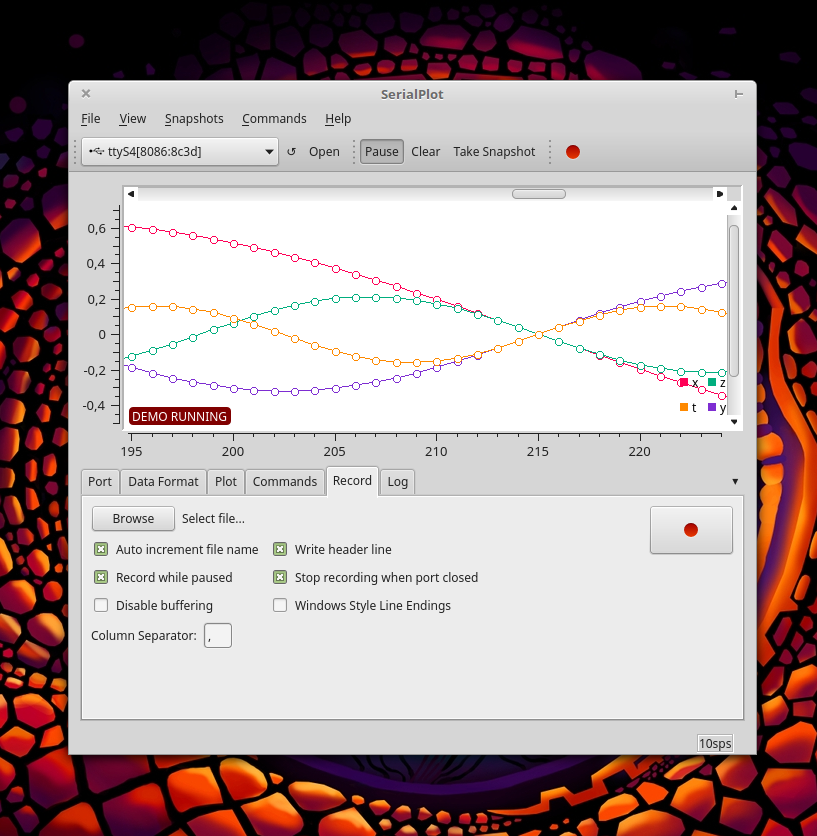
Small and simple software for plotting data from serial port
To make the experience fit your profile, pick a username and tell us what interests you.
We found and based on your interests.
Well, it's been a while.
But I decided to finally put together a new release. There aren't any big news or changes. To be honest what pushed me to finally create a new release is that I forgot to move the "downloads' section from the bitbucket before they axed the mercurial repositories and as a result got a lot of mails/comments from people around to world. Sorry.
Here are some changes that come in v0.11:
Download links:
Linux AppImage (Ubuntu Trusty based, should work on anything newer):
https://serialplot.ozderya.net/downloads/serialplot-v0.11.0-x86_64.AppImage
Windows 32 bit (should work fine on 64 bit windows):
https://serialplot.ozderya.net/downloads/serialplot-0.11.0-win32.exe
Important: I didn't have time to test either of these images. Please let me know if you have any problems with them.
Building serialplot on windows isn't much different than building on linux. But it isn't as straightforward. Installing dependencies can be difficult. And it is also difficult to build a static EXE that doesn't require DLLs to keep it company. But most importantly it is difficult for me, because I don't use windows other than for gaming purposes. Unfortunately most users of SerialPlot use windows and as a result I can't ignore it.
Luckily there is MXE to my rescue. This is a cross compilation toolchain to build windows binaries (and more) on a linux (unix like) host. Whats more is that they also provide 'static' toolchains. When you build your project with a static toolchain it is easier to deploy and can be smaller in size.
So I prepared a dockerfile to make it even easier to build windows using docker. You can build this docker image on linux. AFAIK there are ways to run docker on windows host but I won't go into any details of that. It is also possible to use MXE in msys2, which is a layer to run unix programs on windows. In fact most of the windows releases until now has been built on windows using msys2 and mxe.
Dockerfile is already included in the serialplot source code called:
Dockerfile_mxe
Assuming you have already installed docker, download the serialplot source code using mercurial and build the docker image:
hg clone https://hg.sr.ht/~hyozd/serialplot/
cd serialplot
sudo docker build -t serialplot_mxe -f Dockerfile_mxe ./
Remember this might easily take a couple hours depending on your internet speed and cpu power. To give you an idea resulting docker image is around 5GB in size.
If all goes well you can get the built binary from inside the docker image with this command:
sudo docker run --rm --entrypoint cat serialplot_mxe /serialplot/build_docker_mxe/serialplot.exe > ../serialplot.exe
These are the steps for building SerialPlot on linux. I will also provide more detailed steps for Ubuntu and similar debian based distributions.
Building SerialPlot on linux is quite easy. Most difficult part (not really difficult) is gathering the dependencies. It is possible that you already have some of them installed such as a C++ compiler.
I've also described how to build with docker which might be the easiest method if you are familiar with it.
Install Dependencies
You should have following dependencies installed, preferably using your package manager:
On ubuntu or similar operating systems you can install these dependencies with the following command.
sudo apt install build-essential qtbase5-dev libqt5serialport5-dev cmake mercurial
Note: instead of 'qtbase5-dev' you can install 'qt5-default' package to make sure it is the default qt version.
Also note: SerialPlot doesn't build with Qt4, you need Qt5.
Also also note: you need internet access during build process. It is not necessary, but if you don't you have to also "QWT" library installed.
Get Source Code
You can download the source code using mercurial with the following command. Mercurial is a version control tool very similar to git.
hg clone https://hg.sr.ht/~hyozd/serialplot
Or if you don't want to deal with the mercurial you can download the latest code from this link.
https://hg.sr.ht/~hyozd/serialplot/archive/tip.tar.gz
Build
When you have everything ready, run following commands in the serialplot directory.
mkdir build cmake .. make run
This should build SerialPlot and start it.
Building AppImage
Note: This only works on ubuntu 14.04 at the moment due to restrictions from appimage creator tool that I use at the moment.
When you build SerialPlot this way it probably only works on your computer. It should work on other computers with the same distribution as yours as long as they have the correct libraries installed. If you want to lend your build to your friends you can create a portable executable called AppImage. This should run on most distributions. And it is how I release the Gnu/Linux version of the SerialPlot.
It is easy to build SerialPlot appimage.
Run below command in your build directory.
cmake .. make appimage
That's it. If everything goes well you should now have SerialPlot appimage in your build directory, and it should run in most distributions (fingers crossed).
Building with Docker
There is a Dockerfile inside the serialplot directory ready to go. It is based on Ubuntu 14.04 (trusty). Building it, produces an appimage that you can use on Ubuntu/Debian based systems. Maybe on other distros too?
If you don't have it installed, you can install docker on Ubuntu with this command:
sudo apt install docker.io
After that, get into the directory of 'serialplot' where the 'Dockerfile' exists and run this command. It might take some time depending on your internet speed.
sudo docker build -t serialplot_trusty .
This will build a docker image that should contain the SerialPlot appimage. After building appimage, you should get it from inside the docker image with this command.
sudo docker run --rm --entrypoint cat serialplot_trusty /serialplot/build_docker/SerialPlot-x86_64.AppImage > ./serialplot.appimage
Make it executable and start serialplot:
chmod +x ./serialplot.appimage ./serialplot.appimage
Notes
Although actual build process is quite simple and straightforward, if you are not experienced you may have issues building SerialPlot successfully. It is usually missing dependencies. It is rarely an incompatible library. In that case please leave a comment : ) I will be happy to help.
Also if you have steps for other distributions and recommendations, please share, I will...
Read more »Bitbucket is removing mercurial support along with all mercurial repositories.
I decided to move the source code to sourcehut.
Here is the mercurial repository: https://hg.sr.ht/~hyozd/serialplot/
Here is the new issue tracker: https://todo.sr.ht/~hyozd/serialplot
I haven't moved download files yet. I will probably have to host them myself. Sourcehut doesn't provide file hosting.
SerialPlot 0.10 is released. This release brings some performance improvements, minor features and bug fixes.
Instead of "number of samples" option in the "Plot" tab, now there are 2 options you can set. "Buffer Size" and "Plot Width". "Buffer Size" is the total number of samples that are kept in memory, while "Plot Width" is the maximum number of samples that are plotted at once, in X axis. To see previous samples you simply use the X axis scrollbar. The main reason for this distinction is the performance. Previously you couldn't set number of samples too high because SerialPlot tried to plot all data at one time. Now you can set "Buffer Size" to 1.000.000 and it will most likely will be fine as long as you keep "Plot Width" small. Another advantage is that, sometimes when you have frequently changing data, zooming way out doesn't mean much, you have too keep a certain zoom level in X axis to be able to see any detail. If you enjoy the old behaviour you can always set buffer size option same number as plot width and it should be fine. Remember though "plot width" option has a smaller limit then "buffer size" for performance reasons. A note; performance improvements are not done. I'm still working on some improvements to increase "buffer size" limitations.
Now you can set RS232 control signals (DTR, RTS) and see input signal () statuses from the "Port" tab. Being able to set DTR signal was a requested feature so that SerialPlot can work with Arduino Leanardo board.
Also we now have an update checker. You can launch it from the "Help" menu. It will check updates once a day when you first launch SerialPlot unless you disable it.
Other improvements and bug fixes:
Check the sidebar for download links. I will try update the win32 version and launchpad PPA later this week.
This patch fixes various issues and adds small improvements:
See downloads links at the sidebar.
Hi everyone, it's release time. First of all I want to thank everyone who contacted me via various channels for their kind comments! And ideas of course... some to be implemented... some day... : )
Changes:
Installation for linux:
PPA for Ubuntu 16.04 (xenial) and based distros: https://launchpad.net/~hyozd/+archive/ubuntu/serialplot
Appimage(*) for other distros: https://bitbucket.org/hyOzd/serialplot/downloads/SerialPlot-x86_64.AppImage
Installation for windows:
64bit setup: https://bitbucket.org/hyOzd/serialplot/downloads/serialplot-0.9.0-win64.exe
32bit setup: https://bitbucket.org/hyOzd/serialplot/downloads/serialplot-0.9.0-win32.exe
(*) Appimage may be broken on some systems. Please let me know if you have any problems.
It's time for another release. As always screenshot first:
As you can see from the screnshot now its possible to plot each channel as a separate row. Activated from menu "View -> Multi Plot".
When you zoom enough symbols are shown to indicate data points.
Another addition is the ability to save application settings to a file. Every time the SerialPlot starts, it loads the settings from the last session automaticaly.
"Number of samples" limit is increased upon request. It was 10 000 samples now it is 1 000 000. My experiments show that, around 100 000 samples, things start to get slow. If you set it to 1M samples you are probably going to have a hard time, obviously this depends on your computer hardware. Because of that SerialPlot will warn you if you try to set it to more than 10 000 samples.
There are also numerous bug fixes.
Download Windows installer: https://bitbucket.org/hyOzd/serialplot/downloads/serialplot-0.8.1-win64.exe
Ubuntu PPA: https://launchpad.net/~hyozd/+archive/ubuntu/serialplot
List of changes:
Read more »
Create an account to leave a comment. Already have an account? Log In.
Which data format are you using? If you are using custom frame format, channel order is interleaved. For example In this diagram data type is int16 and number of channels is 2 : https://hasanyavuz.ozderya.net/wordpress/wp-content/uploads/customframe.svg
Thank you for your fast response. Although I am having difficulties, I love your program. It seems simple yet very powerful.
I was using 'Simple Binary', 10 channels of 'float'. I sent from an Arduino Nano using the following code (note on Nano sizeof(double)==4):
void send() {
Serial.write((byte *) &TargetSpeed, sizeof(double));
Serial.write((byte *) &Speed, sizeof(double));
Serial.write((byte *) &TargetTilt, sizeof(double));
Serial.write((byte *) &TiltInput, sizeof(double));
Serial.write((byte *) &TiltError, sizeof(double));
Serial.write((byte *) &TiltOutput, sizeof(double));
Serial.write((byte *) &LMotorSpeed, sizeof(double));
Serial.write((byte *) &RMotorSpeed, sizeof(double));
Serial.write((byte *) &LMotorPower, sizeof(double));
Serial.write((byte *) &RMotorPower, sizeof(double));
}
..., but I gave up on that and tried defining a custom frame.. At the start of 'send' I now send NaN, indicating start-of-frame as 4 bytes (00 00 C0 7F).
My new settings are:
Frame Start: 00 00 C0 7F
# Channels: 10
Number Type: float
Fixed Size: 40
Little Endian
The data seems to be parsed correctly and appears in the correct order in the text view. HOWEVER I now only get a single channel listed on the plot tab and cannot add more.
I tried for some time to get more channels listed and ONCE they actually appeared. Then they disappeared on a subsequent trial.
I decided something might be corrupted in a settings file, so I deleted my .ini file. Strangely the program still seemed to remember settings between runs. Eventually I discovered a file, ~/.config/serialplot/serialplot.conf which contained settings. I deleted this and the program started in a clean state. I added my custom frame specification again, but I still only get 1 channel in the plot tab. All channels are parsed correctly though, and can be seen in the data view.
I am really struggling with this. I think there has to be some bug(s) in serialplot.
PS - I just found out why I once got the right number of channels for the custom frame ; If I save settings to a file (explicitly giving.ini as extension), then when I re-load the settings, I get the right number of channels. This procedure is actually a temporary fix to my problems.
@elpidiovaldez This seems like a bug to me as well. Can you share your configuration files. Both the serialplots own configuration (but first close the application while problem is happening so that settings are saved) and the file you are saving using the File menu. BTW files should be in text format. You can review them to make sure they don't contain anything you don't want to share (they shouldn't but you should check anyway)
A quicker workaround is this; after configuring settings in "Custom Frame" format switch to another format and switch back to custom frame format.
I think I found the problem, already pushed a fix.
@Hasan thank you again for amazingly quick support. I am glad you found the problem.
I am already finding serialplot seriously useful. Thanks for making it available.
I have a few suggestions which might help improve your product. I want to emphasise that I am not requesting these - just trying to give feedback as a user.
1) Apply channel gain and offset when you display the data (the plot AND the text view not, as it appears to be done, when the data is received. This lets user re-scale multiple times to align traces AFTER the data is seen. This is important if it is tedious/costly to capture data again. Maybe add sliders so scale/offset can be adjusted and displayed interactively...
2)Add frame numbers to the text view, but make sure they are not selected when using cut/copy.
3) I find the definable 'commands' very useful. It would also be quite useful to provide a command line input (like a terminal) where text can be entered and sent directly to port. Maybe provide options for how newline, carriage return etc are sent. This would allow direct interaction with a process that expects a terminal to be connected. It is more flexible than a static command if you want to send new parameters. Sadly the process cannot send text to serialplot as it would get mixed with the plot data. Maybe you could define another frame type which contains a text string - however it would require modifying the attached program, so use is more limited.
4) Allow input from pipes and files etc, not just serial ports. This expands the uses considerably (maybe this is already possible, but I could not find how). I came upon 'socat' and used that, but you could probably make the functionality easier to use.
5) Capture seems to stop after a while (buffer full ?). It would help to toggle between this mode and continuous capture (using FIFO buffer ?).
@elpidiovaldez thanks for your suggestions. #5 sounds like a bug. Can you provide more information?
I looked into num 5. I still can't reproduce it reliably, and I suspect the bug may be in my code. One strange thing is that when the plots stop moving left, it is sometimes possible to restart them by pressing the little 'x' (by the pause button), to clear the buffer.
Is anyone able to use the data tracker demonstrated in https://hackaday.io/project/5334/logs. I found no instructions in SerialPlot v0.10.0 on how to realize that. I don't know what to do.
Sorry for late reply. That feature is complete. But you must compile from source code to have it. Unfortunately I haven't been able to do a new release. Mostly because building windows packages is a pain for me.
IS there a way to have it plot from left to right? It appears to only fills the screen from right to left. It would be helpful to watch the data accumulate on the screen from an anchored left starting point.
Has anyone seen this in SerialPlot. It is a SerialPlot issue. Perhaps it is related to a baud rate of 115200. It seems as though SerialPlot is dropping a frame. When it does this, ALL values are plotted as if they are set to zero. This is in CSV form. If I print a constant even it will plot as zero.
Arduino IDE (Serial Plotter) - Thank You!
SerialPlot - Thank You!
Processing IDE Plotter - Thank You!
But my balancing robot program still needs more diagnostics. The plots are a big help. But a plot is different from a text log. A log can be helpful too. Both a log and a plot provide useful information, but they are different and the information that each provides is unique. So, I am trying to do both. My goal is to be able to look at a graph to find a point to inspect and check the log to see what happened. The problem is that all of this is coming through one serial port. I can run one terminal program or one plotting program. But if I use a terminal program, there no plot. If I use a plotting program, it is text intolerant. If my program uses Println, SerialPlot shuts down. The Processing Listener is more robust in that it does not shutdown. But it also refuses to make the plot. If I had both the log and a plot, I could sync them with the program time [millis()].
Is there any way to do this?
I have an idea to add 'message printing' along with data but never had time for it. In windows you might try this software to split your data to multiple serialports: https://www.eltima.com/products/vspdxp/
I don't know if there is a software that can do the similar in linux, but I previously used a python script to separate the plot data and push it to serialplot via pseudo terminals. SerialPlot is okay with opening pseudo terminals which are very similar to virtual serial ports.
It seems all the useful features (port splitting for ex.) are in the pro version :S
Thanks for the program. I'm developing a rs232 load cell interface and I was wanting to plot the output to play with filtering and your program had me plotting the live output in less than a minute.
One feature I'd love to have is a FFT of the plot as well. You've basically made the UI of an oscilloscope here, you would gain a lot by copying the math and processing functions that most oscilloscopes come with these days.
For such purposes (FFT, XY plot, filtering, math on input data) i use export to .csv and open it in Digilent Waveforms or Matlab. ideally, I would like to see the functionality as in code composer studio graph window.
Thanks for the program; extremely useful for visualising data quickly.
Hasan kardeşim tebrik ederim. Çok güzel ve kullanışlı. Kayıt yaparken yalnız okunan değerler kaydediliyor. oysa okunan değerin zamanını da kaydetmeliydi diye düşünüyorum. bu özellik programı daha kullanışlı hale getirecektir. ellerine sağlık.
@burhan güler uzun süredir planladığım bir özellik. Ancak projeye fazla zaman ayıramıyorum. Geçici olarak şunu önerebilirim: "record" sekmesinden yapılan kayıtlara "timestamp" sütunu ekleyebiliyorsunuz. Zaten çok uzun süren kayıtları dosyaya sürekli olarak kaydetmenizi de öneririm.
Hi Hasan and thanks for your great, useful and powerful job.
A feature that will be very useful if added, is the XY Plotting of a pair of channels.
Also here is some suggestions for making this tool more perfect:
- Ability to plot XY mode with selected pair of input channels.
- Ability to making tracks thick and thin.
- Ability to move mouse to points and showing point value.
- Ability to resize each individual graph horizontally in single graph mode.
- Ability to navigate graphs with mouse. Zooming in and out with wheel, moving zoomed graph with holding down wheel and moving mouse.
- Ability to auto connect to last selected port and start plotting, at software startup.
- Ability to set graph min/max limit for each graph individually in single graph mode.
- Ability to disable/enable the graph auto scrolling. This will be very handy when user wish to check some previous part of graph while data will continue to receiving, the graph auto scrolling can be disabled and can be enabled again.
And also i found a bug that the program will crash when loading a huge recorded and saved snapshot.
@Saeid thanks for your comments.
1. planned, I could say its in progresses
2. long term planned
3. currently in progress, check out the latest log for a GIF of it working
4. I didn't understand this one?
5. wheel zoom long term planned, you can move zoomed graph with CTRL+left mouse
6. planned
7. I think you mean "multi plot" mode?
8. I plan to implement this after the XY plotting. But it's going to be difficult.
@Saeid can you create a bug report here with a sample file: https://bitbucket.org/hyOzd/serialplot/issues
Hey great work! That reminds me of the project I upgraded not so long ago. If you can find some inspiration you can take a look at it !!
Thanks @Simon Benoit I should really add the text view for data : )
Hello, @Hasan Yavuz Özderya
I'm running on Linux Mint 19 (Ubuntu Bionic based), and i cannot add your PPA. It displays the following error:
HTTP Error 404: Not Found
Cannot add PPA: ''This PPA does not support bionic''.
Thanks in advance!
PPA hasn't been updated for some time. Please use the AppImage version.
Hello,
I am trying to use the serial plot on Windows 10 using a FTDI connector. The FTDI shows up as port 13 in the serial plot. However, the data doesn't plot.
Any recommendations??
@HC It doesn't matter, notifications are shit on hackaday anyway. I have no idea why it wouldn't plot. SP works fine with USB serialports. Make sure your "data format" settings are correct. Check the "Log" tab for errors. If you continue having problems, please create an issue here https://bitbucket.org/hyOzd/serialplot/issues with your settings file (File->Save Settings).
I cannot complite project with qmake /mingw - there are link problems . have anyone tried in qtcreator/mingw/qmake combination ? please helpme out
Sorry, qmake project file (serialplot.pro) isn't up to date. You could use cmake which also gathers all dependencies (except Qt SDK). Building on windows is a pain. I actually use msys2 when I have to build release images. It all works like it does in linux. But installing msys2 and making it work can be difficult and time consuming to be honest.
I also tried to build a win32 version using msys2, but I'm not able to pass QCW-build:
-- Build files have been written to: /home/d.ziglioli/serialplot/build/qcw/src/QCW-build
[ 6%] Performing build step for 'QCW'
[ 1%] Generating ui_color_palette_widget.h
[ 3%] Generating qrc_color_widgets.cpp
[ 5%] Generating include/moc_color_palette_model.cpp
moc: /home/d.ziglioli/serialplot/build/qcw/src/QCW/include/color_palette_model.hpp: No such file
make[5]: *** [CMakeFiles/ColorWidgets-qt5.dir/build.make:67: include/moc_color_palette_model.cpp] Error 1
make[4]: *** [CMakeFiles/Makefile2:72: CMakeFiles/ColorWidgets-qt5.dir/all] Error 2
make[3]: *** [Makefile:84: all] Error 2
make[2]: *** [CMakeFiles/QCW.dir/build.make:112: qcw/src/QCW-stamp/QCW-build] Error 2
make[1]: *** [CMakeFiles/Makefile2:73: CMakeFiles/QCW.dir/all] Error 2
make: *** [Makefile:152: all] Error 2
are you able tu build it ? could you eventually release an updated win32 version ?
thanks.
PS:
anyway thanks for the tool
@Daniele Ziglioli which version are you trying to build? Did you get it from the bitbucket repository? qt color widget library recently moved their repository, if you have an older version of the source code that might be the problem.
>@Daniele Ziglioli which version are you trying to build? Did you get it from the bitbucket repository? qt >color widget library recently moved their repository, if you have an older version of the source code that >might be the problem.
Yes I've follow your instruction for mercurial download from bitbucket.
For the QT i've follow this: https://wiki.qt.io/MSYS2
Hi there. First of all, thank you very much, Serial Plot is a very useful tool for me. I have some wishes for the application.
1) It could be helpful to see in real time (as log tab does) the list or table generated for Recording (The same text).
2) An option for adding system Date and/or system Time at the begining of each line in Record file.
3) In the Plot tab, a simple linear math opperation will help with calibrations, y=mx+b where Y is the output (plotted and recorded) data, x is the input data, and m and b constants configured in the channel list.
Well, may be I'm asking too much. But if it can be added would be great!
Anyway, congratulations for this nice project, and thanks again.
@Marcelo Pino Thanks for your comment. All 3 items are planned. #2 and #3 is going to take some time though. :)
Great! I look forward to see it! I can test it if you want. Regards.
Hullo everybody,
Could I make a suggestion to add detail to the install instructions to help out idiots like me?
If the instructions said if you distro has ... set BUILD_QWT to false "in the CMakelists file it would help a lot :)
This may sound silly or obvious but it's not! (if you aren't familiar with the config files for Cmake :) )
Good news it is quick to build on Raspberry Pi 3 under stretch and Ubuntu Mate for RPI once libqwt-qt5-dev is installed along with other dependencies.
Excited to try it out now!
Jamie
Jamie thanks for your comment. BUILD_QWT option is already mentioned in the README. Were you looking at the instructions here: https://bitbucket.org/hyOzd/serialplot ?
Hi
Thanks for the reple
Yes I did follow the instructions at this link https://bitbucket.org/hyOzd/serialplot, I should have been more clear.
My suggestion was to change the instructions from
"set BUILD_QWT cmake option to false."
to
"set BUILD_QWT cmake option in the CMakelists file to false."
Not everyone knows which file to look for the change the flag, does that make sense? :)
P.s. the software is great.
Jamie
Well, you are right, I should write more detailed instructions. For the record you don't have to change the CMakeLists.txt file. Usual method is to set the options from the command line like this:
"cmake -DBUILD_QWT=false .."
Or you can start the cmake gui and do it from there:
"cmake-gui .."
Haha, I did not know those options either, simpler than editing the text file!
I don't mean criticism, the instructions are good :)
Anyone with basic knowledge like me can complete them, just that one line explaining the usage of this option that may confuse people.
With VNC it makes a perfect remote data logger
All the best,
p.s. do you have a donation page somewhere?
Jamie
I also have problem with this part, but I grep'ed BUILD_QWT, find it in some cache file and in CMakelists. Changing in CMakelists and running cmake didn't help, in cache still was the same, so I deleted all in build, run again and it compiled.
ps. adding ppa shows some errors on Ubuntu 18.04 x64, so I compiled from sources.
Thanks for your program!
Jarek
Jamie, if you are on linux, you can use a utility called "socat" to redirect serial port over tcp, that way you don't have run serialplot on the remote device. Now thinking about it, it would be nice to add this to serialplot...
No I don't have a donation page. I couldn't find an alternative to paypal since its banned in my country.
Morning,
Thanks for the suggestion, I have not used socat.
I should say the remote device is sitting in my desk, it is just a box with usb oscilloscope, diy meters and small LCD. It has WiFi so I use it.
That's a shame about American money company being banned. In Cuba they use the friends in Europe but it makes things less simple.
Jamie
Hi! I love SerialPlot. Its the best free prog that i found. But i have a problem: In Version 0.9 i had wrong values printed on high data rate. I tried it with version 0.10 and then i only have chunks of serial values coming in. Also with arduino Serial Monitor and the 0.9 version. I uninstalled 0.10, and the problem still exists. Before all that, it was a steady flow of the serialplot which i want back ;-( any help is much appreciated.
SOLVED:
I just changed the buffer of the com port, and now it works again. Does the software changes this???
That sounds like a serious problem. Are you saying that 0.8 version doesn't have this problem but later versions have? I would be glad if you can create an issue in the bug tracker: https://bitbucket.org/hyOzd/serialplot/issues/ with more details such as data format you use and baud rate, and actual sample rate etc.
I've been searching for such an intelligent tool for a long time. I would like to see in future updates the ability to produce simple mathematical / trigonometric operations on input data arrays. Excellent application, success for developers!
Math operations are already in my todo :D Thanks for kind comment!
Hi @lysergicenemy! Just wondering if you found something like that out there. Cheers!
yes, im using instrument Control Toolbox in matlab/simulink. It make possible plotting serial data for custom frame such as in this app and use any math operations on the input data ( this is the only thing I miss in the SerialPlot ), but this path slowely because need start/stop simulation and other unnecessary actions (for some reason matlab distorts data at high speed while SerialPlot displays normally).
Become a member to follow this project and never miss any updates
The data in the text view is not in the order that I send it in the frame. The channel numbers do not seem to relate to this order either. I find it very difficult to work out which channel my variables appear on. I am probably doing something wrong somewhere but after hours staring at it I can't find the cause.
I can't see why the channels would not be in the order the data is sent., but are they ? If not how can I work out which variable appears on which channel ?