0%
0%
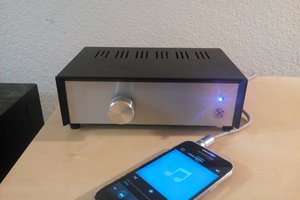
Home Power Line Clean Up Device
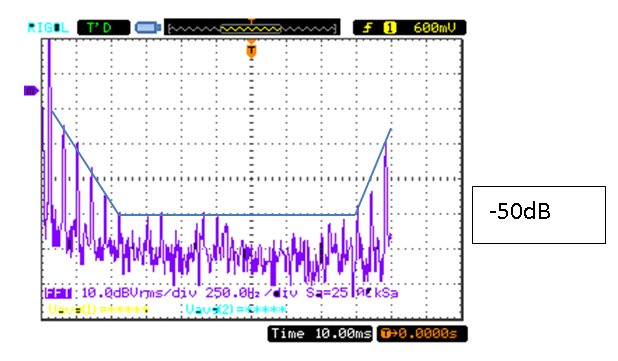
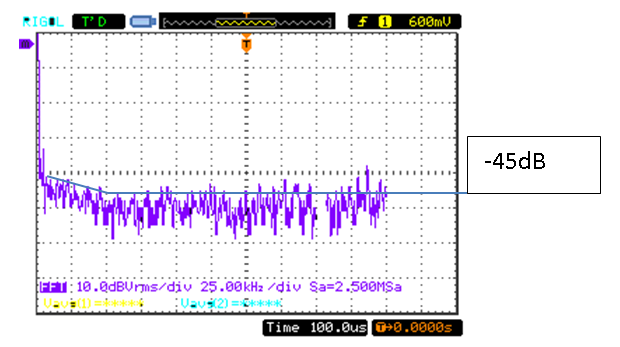
Besides the desired mains frequency, electronic devices create lots of high frequency noise on the power line. This device will clean it up.
Become a Hackaday.io member
Already have an account? Log in.
Just one more thing
To make the experience fit your profile, pick a username and tell us what interests you.
Pick an awesome username
hackaday.io/
Your profile's URL: hackaday.io/username. Max 25 alphanumeric characters.
Pick a few interests
Projects that share your interests
People that share your interests

 Szoftveres
 Pero
Pero