 Myrijam
This is a project about a magnetic scanner to examine flux density as a vector field – something we are not taught in school (we are 14 and 15 years) - I am doing this project with my friend Finja.
Here in Germany many unexploded bombs from the Second World War are found just by aerial image evaluations. Therefor we asked ourselves whether there is an easier way to find them. We knew that the bombs were partial made of metal so we wanted to know if this metal could elicit anomalies in the earth´s magnet field - these would lead to the position of these UXO's.
So we wanted to develop a device that visualizes magnetic fields and its anomalies.
Other application possibilities could be the use in physic lessons, because we know from our own experience that students often can’t imagine how a magnetic field looks like or how it can be influenced by metal and for product tests e.g. to look how a magnet is polarized or to check if a stepper motor is properly functioning.
The only way we could “look” at magnetic fields so far is by iron fillings – a qualitative way only, but by no means you can bridge physics and math by it… And we wanted to be able to look at the magnetic field (= flux density) in 3D, which is hardly possible with iron fillings.
There are similar measurement devices for industrial use. But they cost about 50.000$ and the measuring area is just 1cm x 1cm and for schools or private use this would be far too expensive!
So our aim is to build a Magnetic Scanner (3d MAG) that can be used in educational settings or citizen science ship with the least costs and complexity possible. But of course, we paid a lot of attention to our measurement not influencing the magnetic field itself – that’s why our first prototypes were mainly build from plastic tubes and 3d-printed mounting parts.
You can find the full report here (in German; translations will follow). There is also some additional information on my blog with pictures of Finja and me working on it.


 Antonio
 Facundo Noya
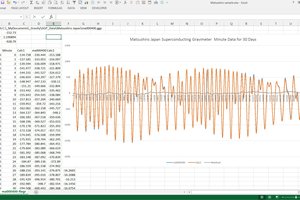
 RichardCollins
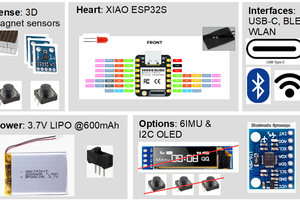
 BastelBaus
This is 5-shades of awesome... I'd like to be able to generate this data from 17 different input sources. It can be assumed that the position and orientation of each sensor (although not constant) is known with a good grip on error. Could your technique be used in conjunction with this sort of input?