 aloismbutura
The problem
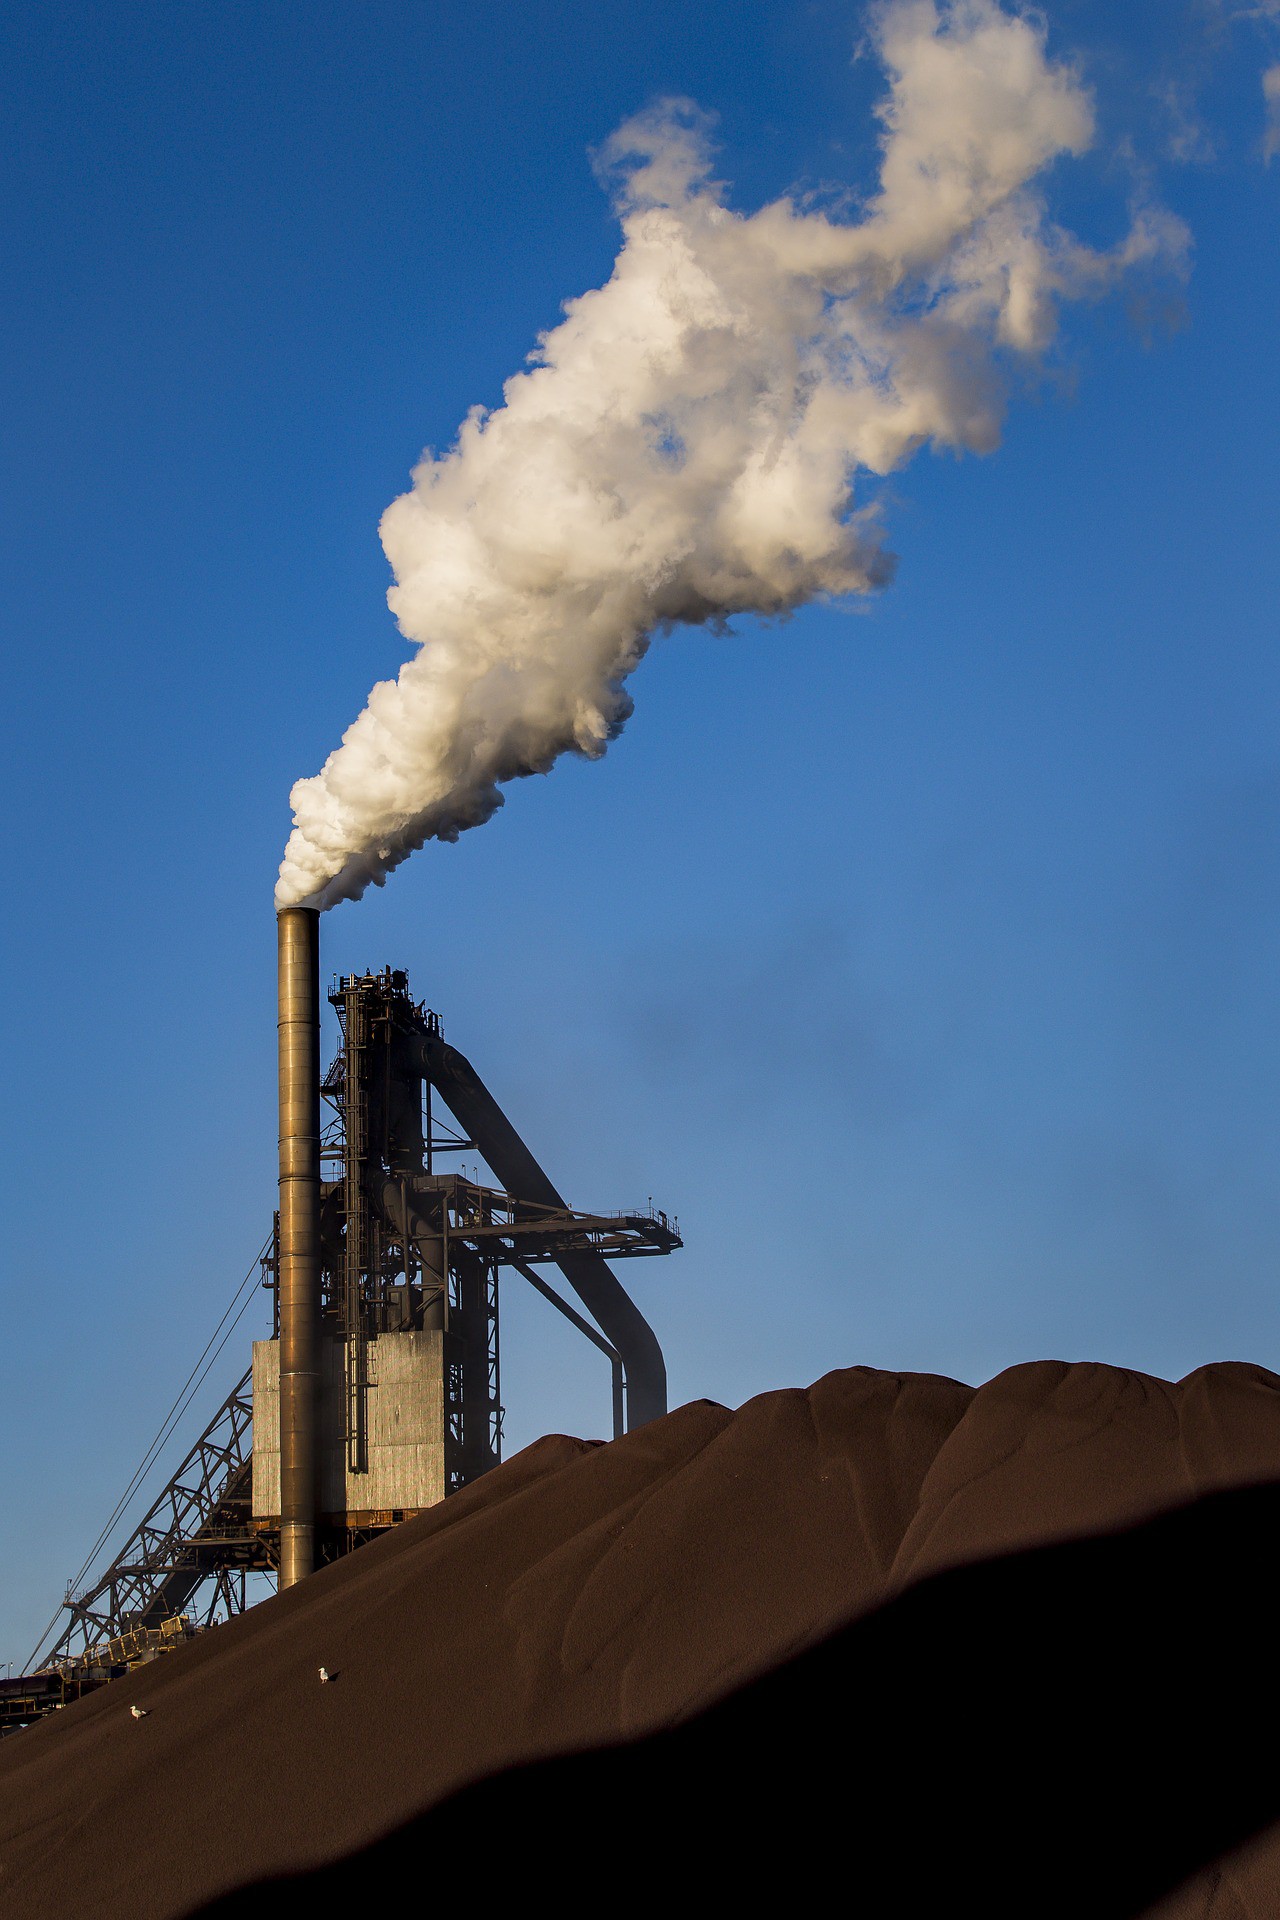
For nearly 3 billion people of the world's poorest, the simple act of cooking a meal is an uncomfortable and deadly daily experience that accounts for approximately 5% of the global burden of disease and close to 4 million deaths globally each year, which is greater than the mortality rate due to HIV/AIDS(1.6 million) and malaria(627,000) combined.
Of these deaths:
- 27%-Pneumonia
- 27%-Ischemic heart disease
- 20%-Chronic obstructive pulmonary disease (COPD)
- 18%-Stroke
- 8%-Lung cancer.
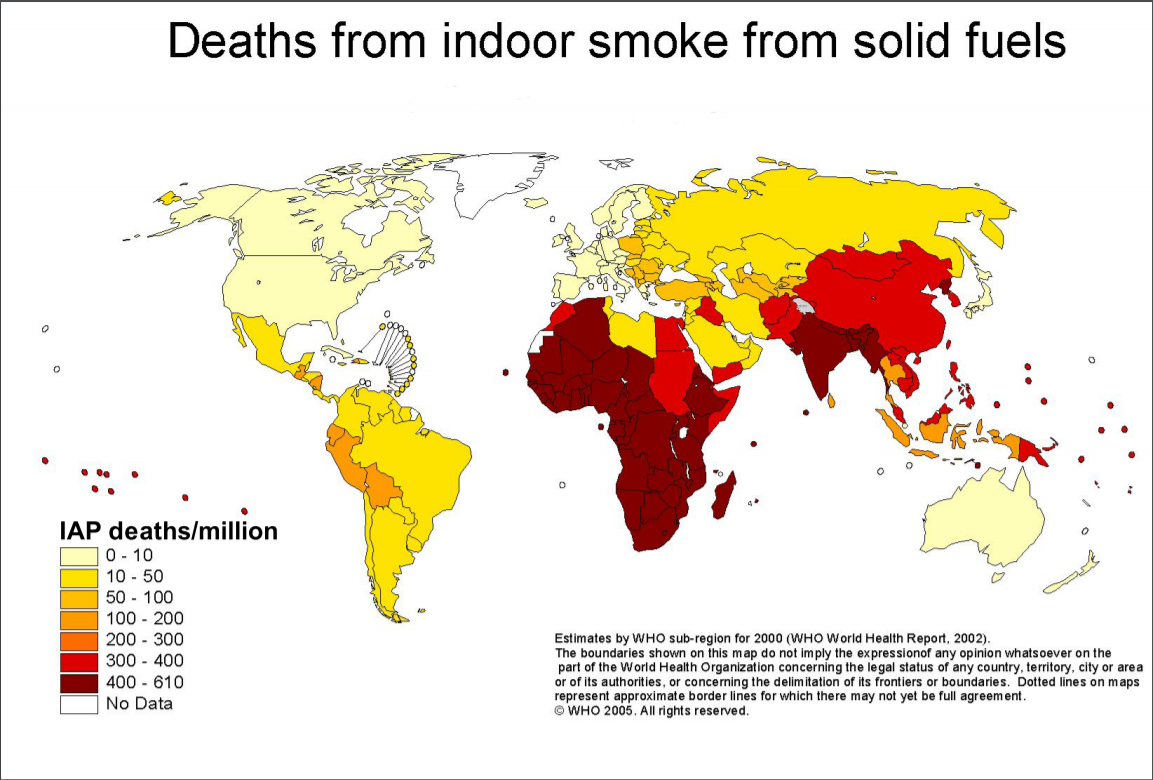
But why is cooking so dangerous? Simply put-Unclean fuels. These fuels include wood, crop wastes, charcoal, coal, unpressurised kerosene among others. Charcoal in Africa -for example- is a $24.5 billion market that causes 2 million hectares of deforestation annually – more than 200 times the size of Manhattan – and also causes deaths from household air pollution.
While bold steps have been made so far in having some populations in Asia, Africa and Latin America move from unclean fuels to relatively cleaner fuels, progress is relatively slow due to a knowledge and technology gap in developing countries on how to generate data quickly on the causes of household air pollution within their own contexts( Is it human behaviour/stove technologies used/ Types of fuels used or a complex combination of the three that is the cause ) and at minimal cost in order to create effective counter-measures. We believe that open source DIY is the way by which this gap will be filled.
About OpenHAP
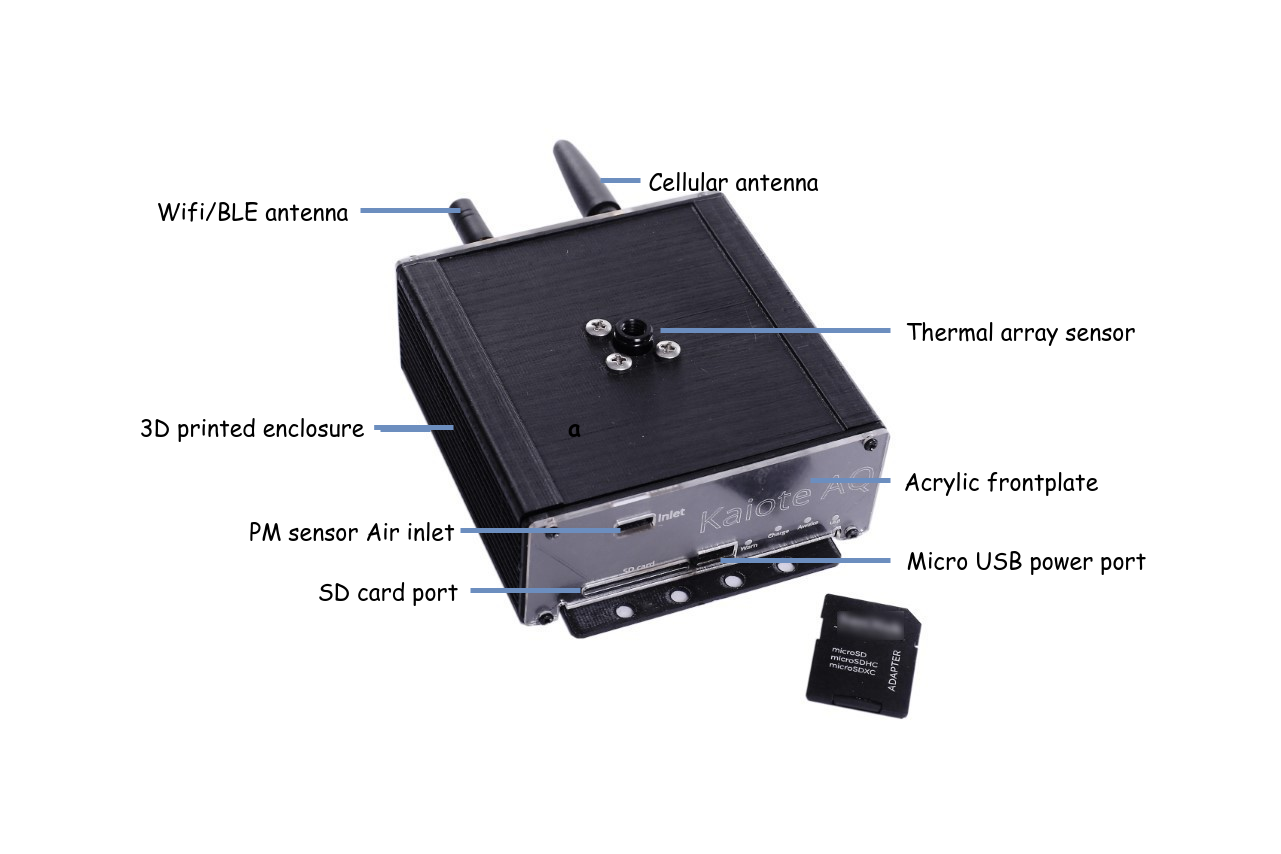
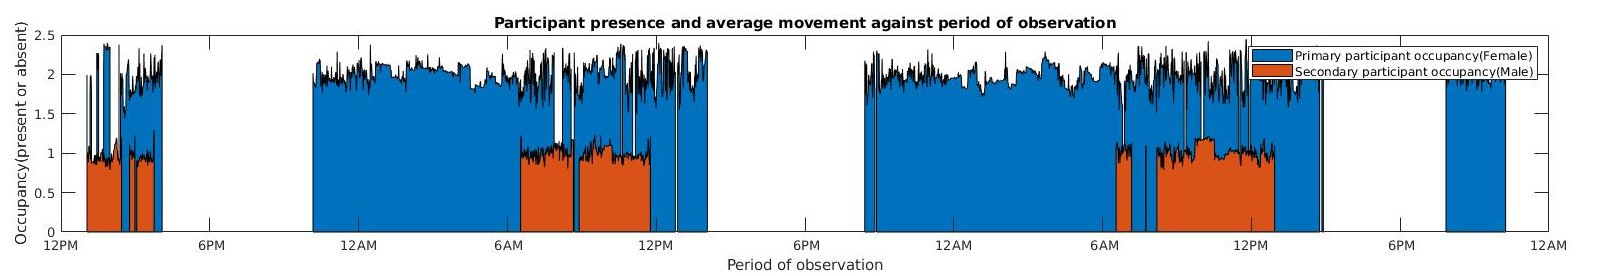
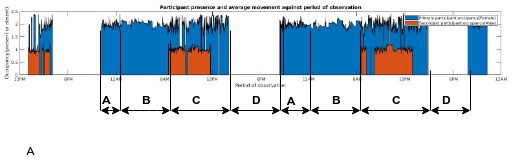
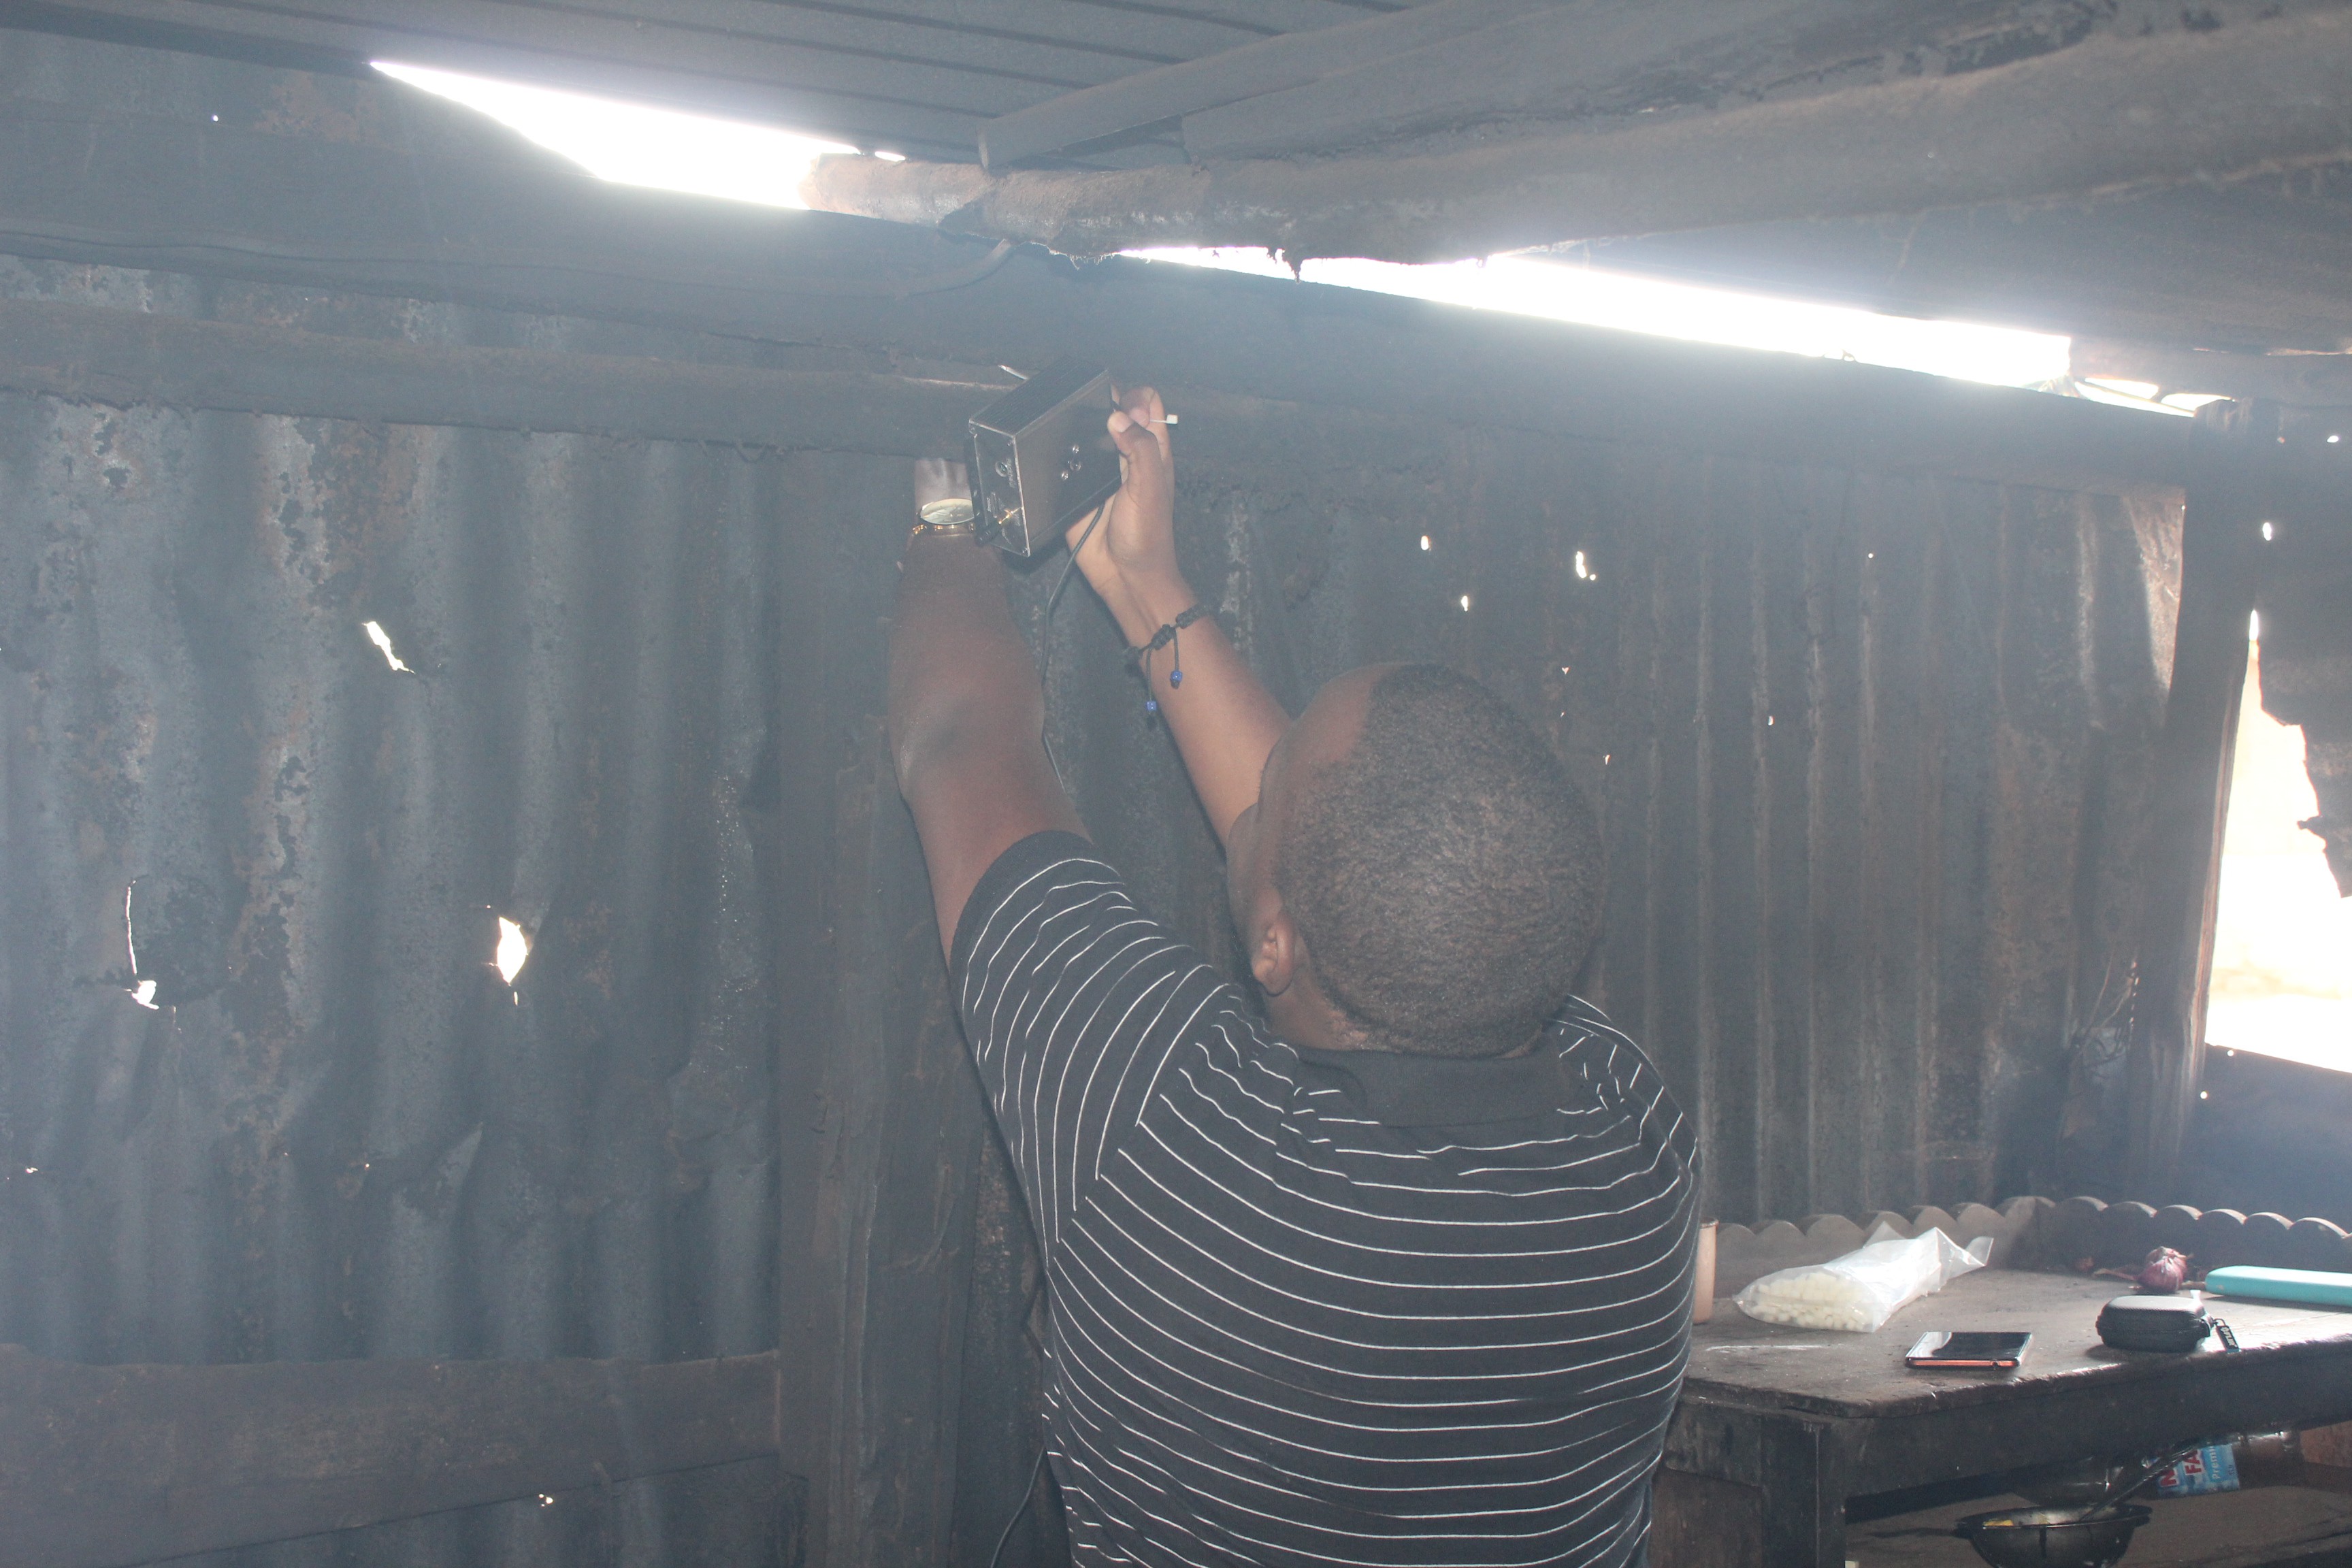
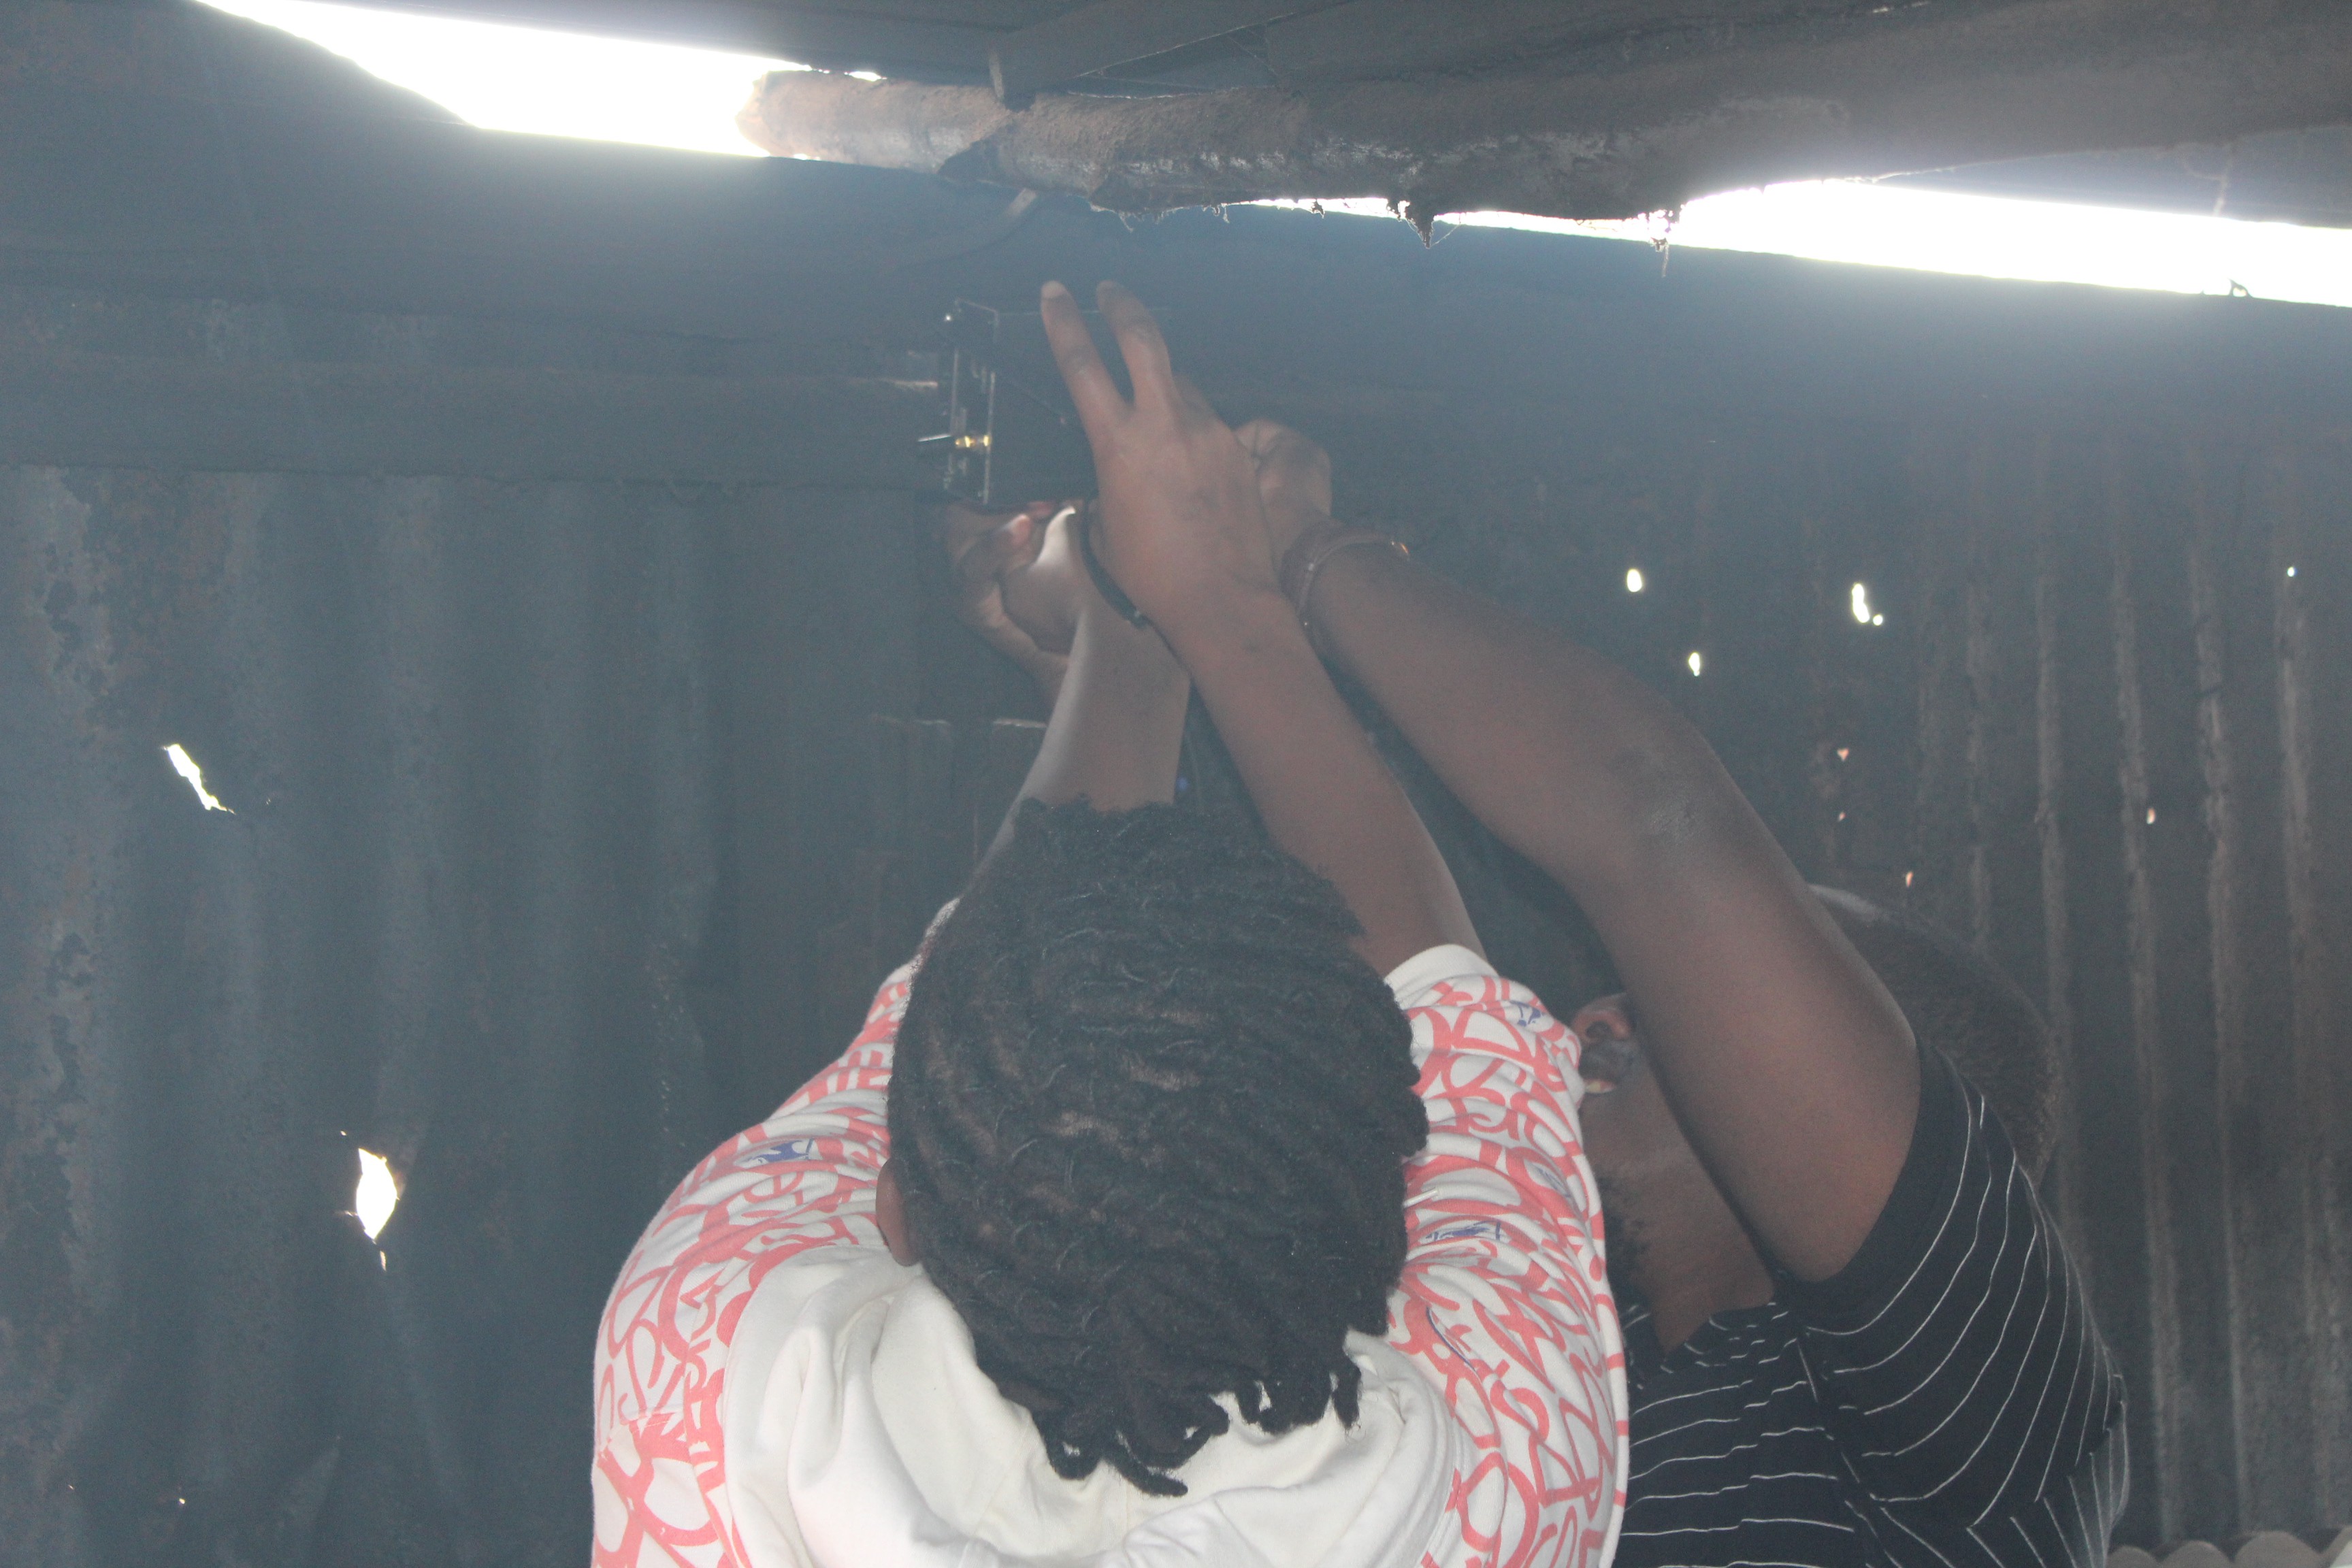
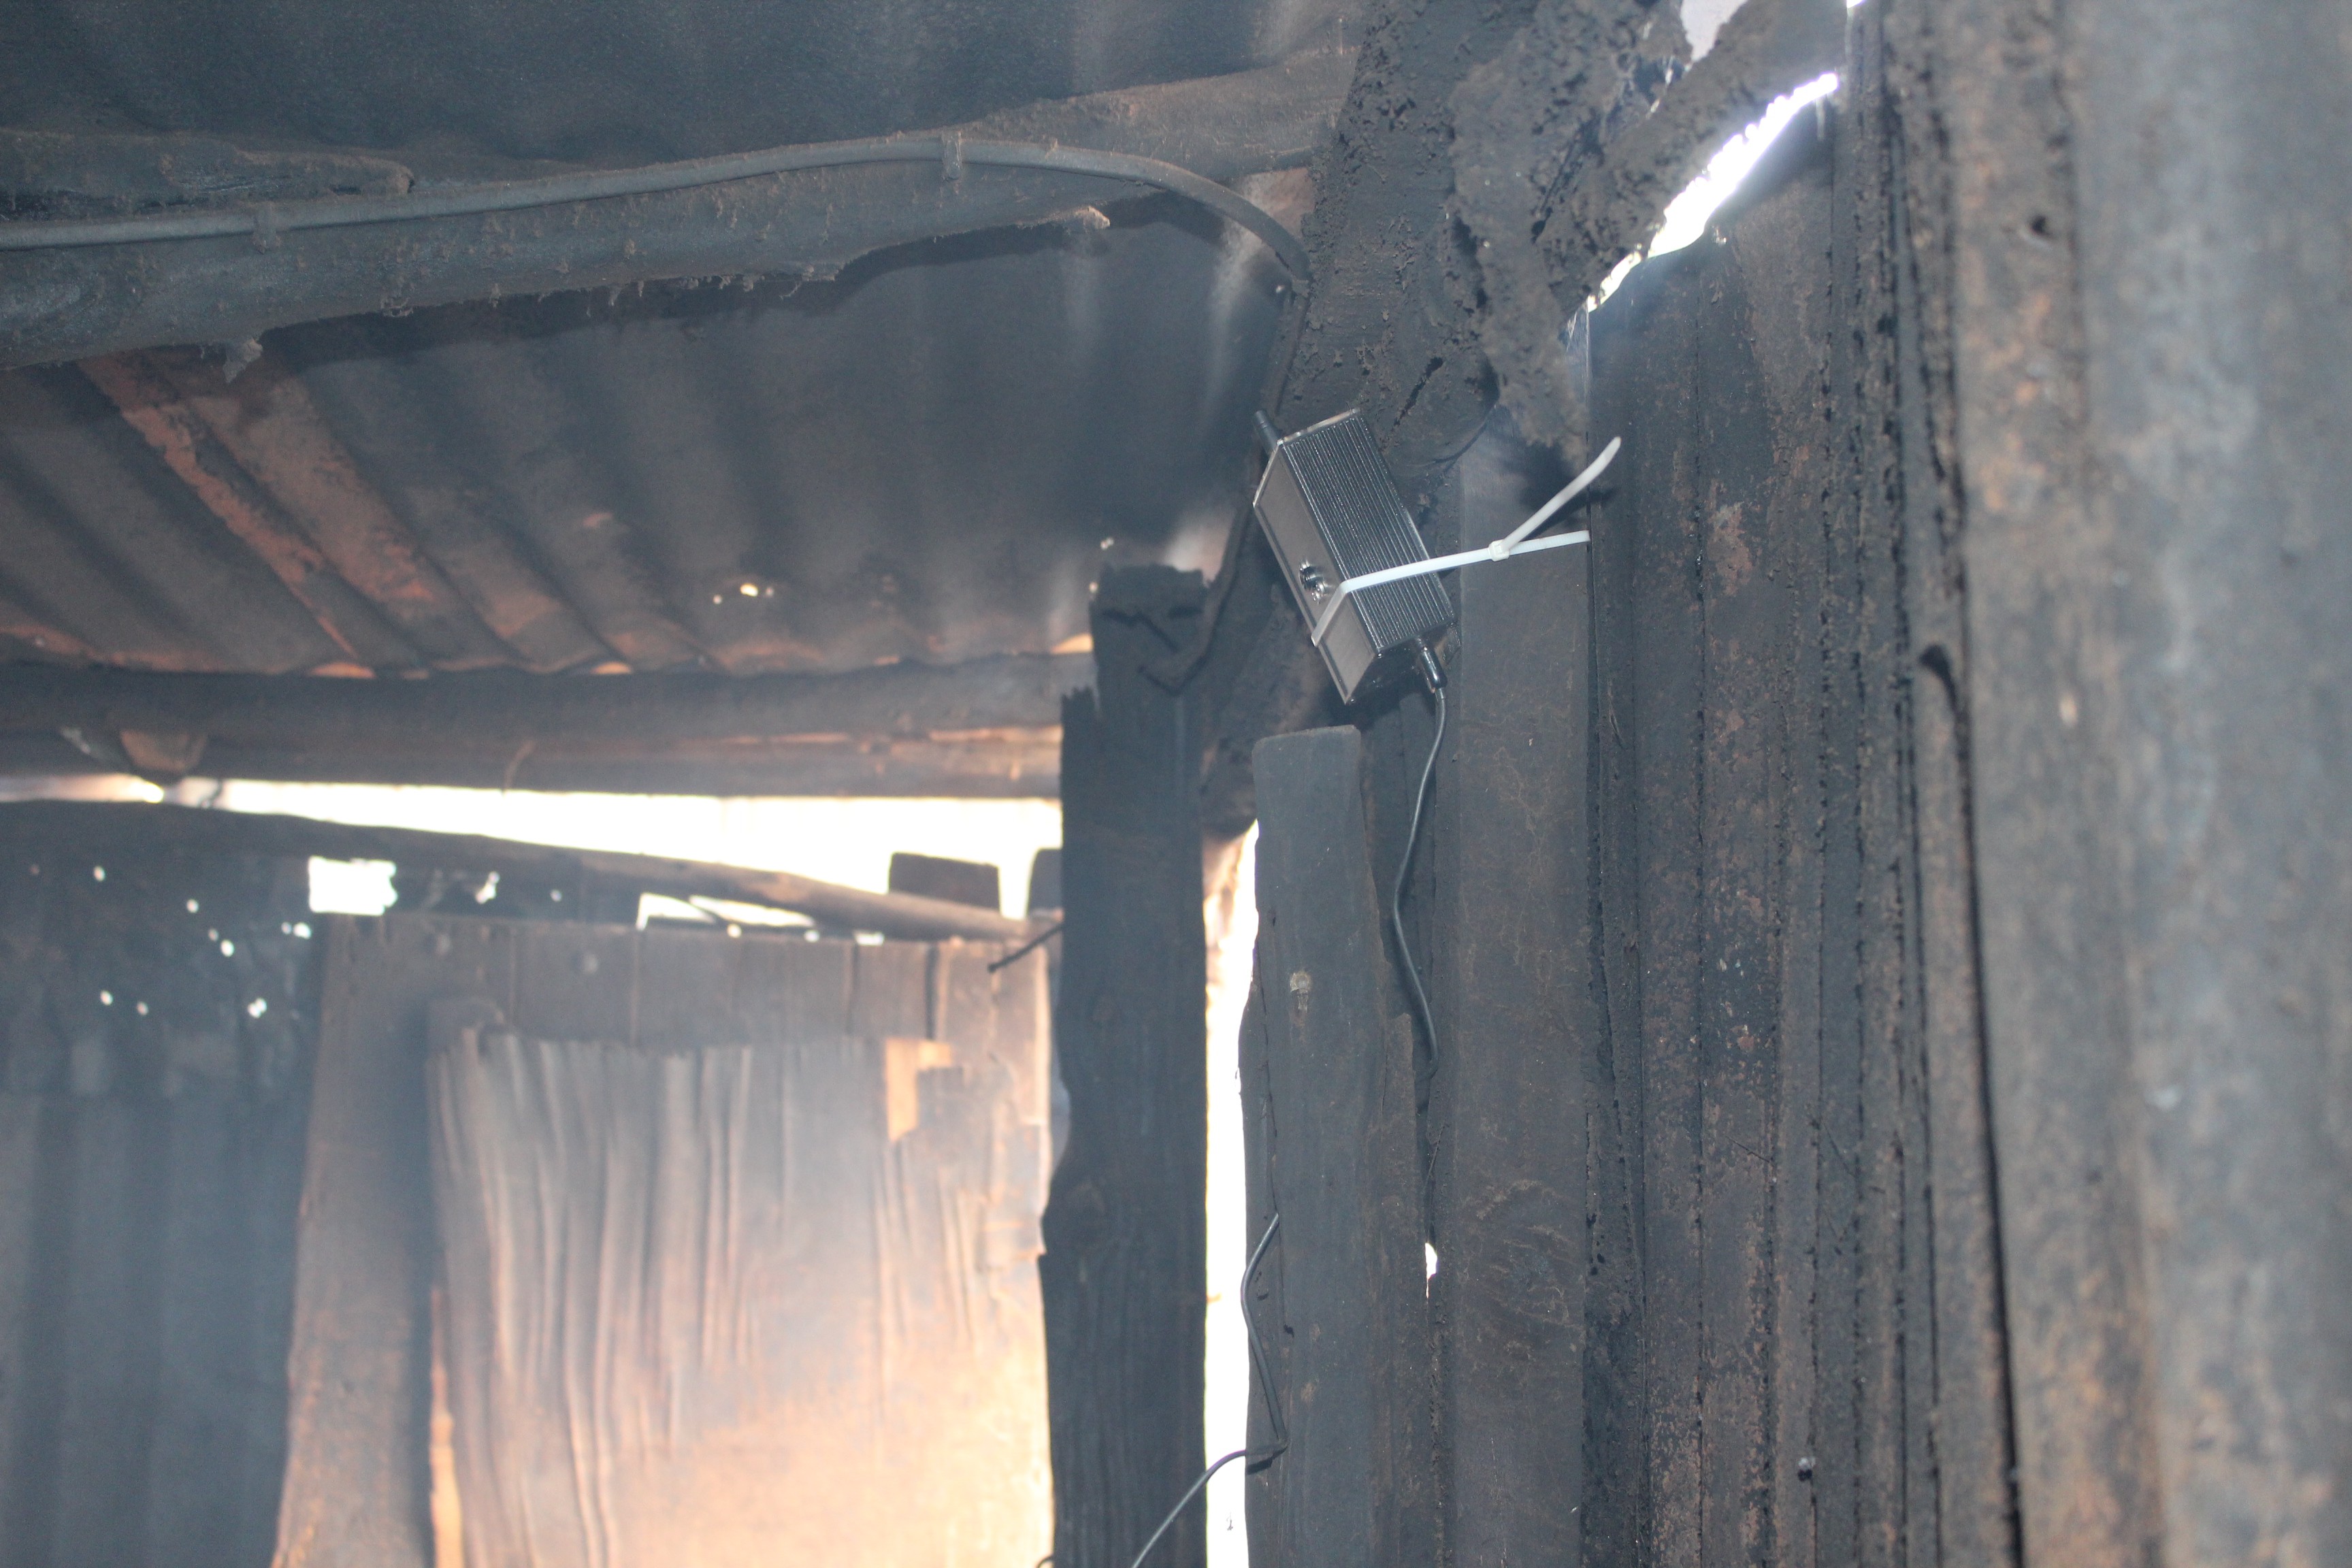
OpenHAP is an open source device used to monitor exposure to pollutants within the indoor household space. It is also very useful for non invasive monitoring of human habit and actions that may have contributions to pollution, without the need to ask direct questions that may offend or go against culture thus difficult to obtain answers to.
Documentation log (In order)
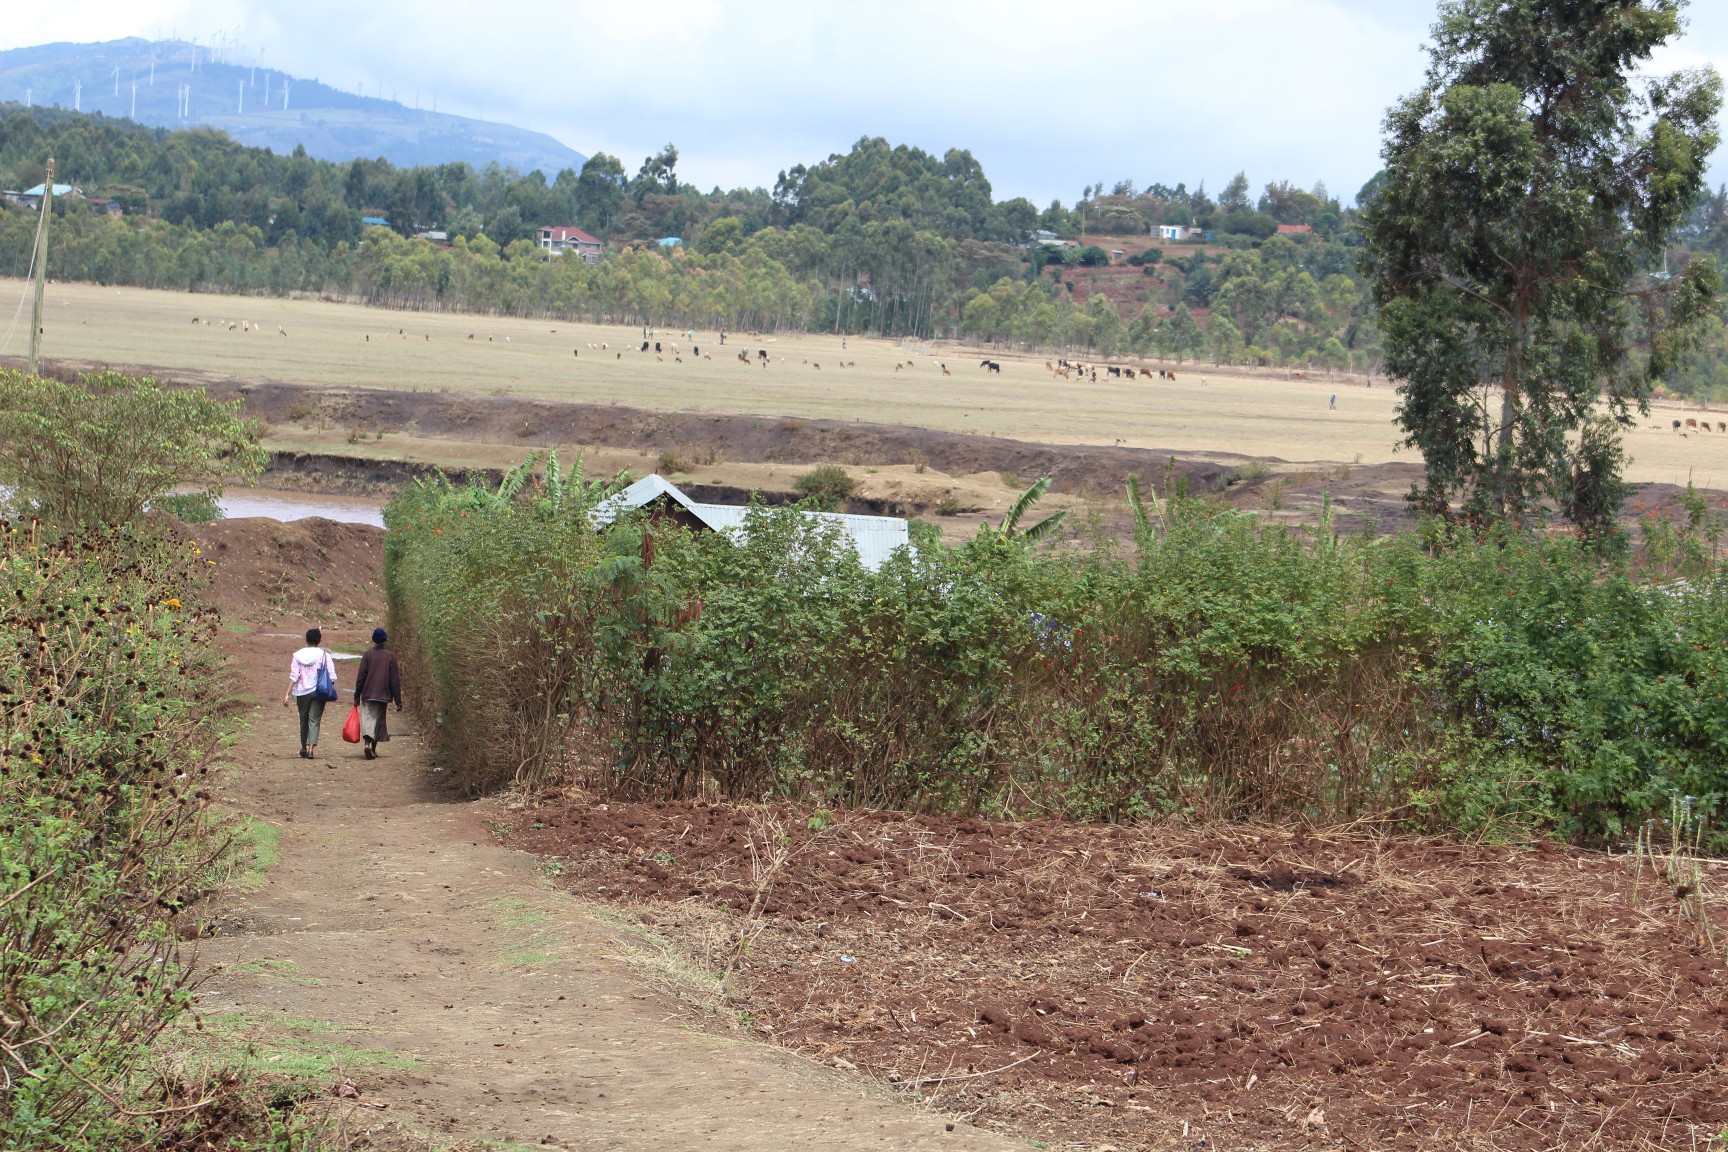
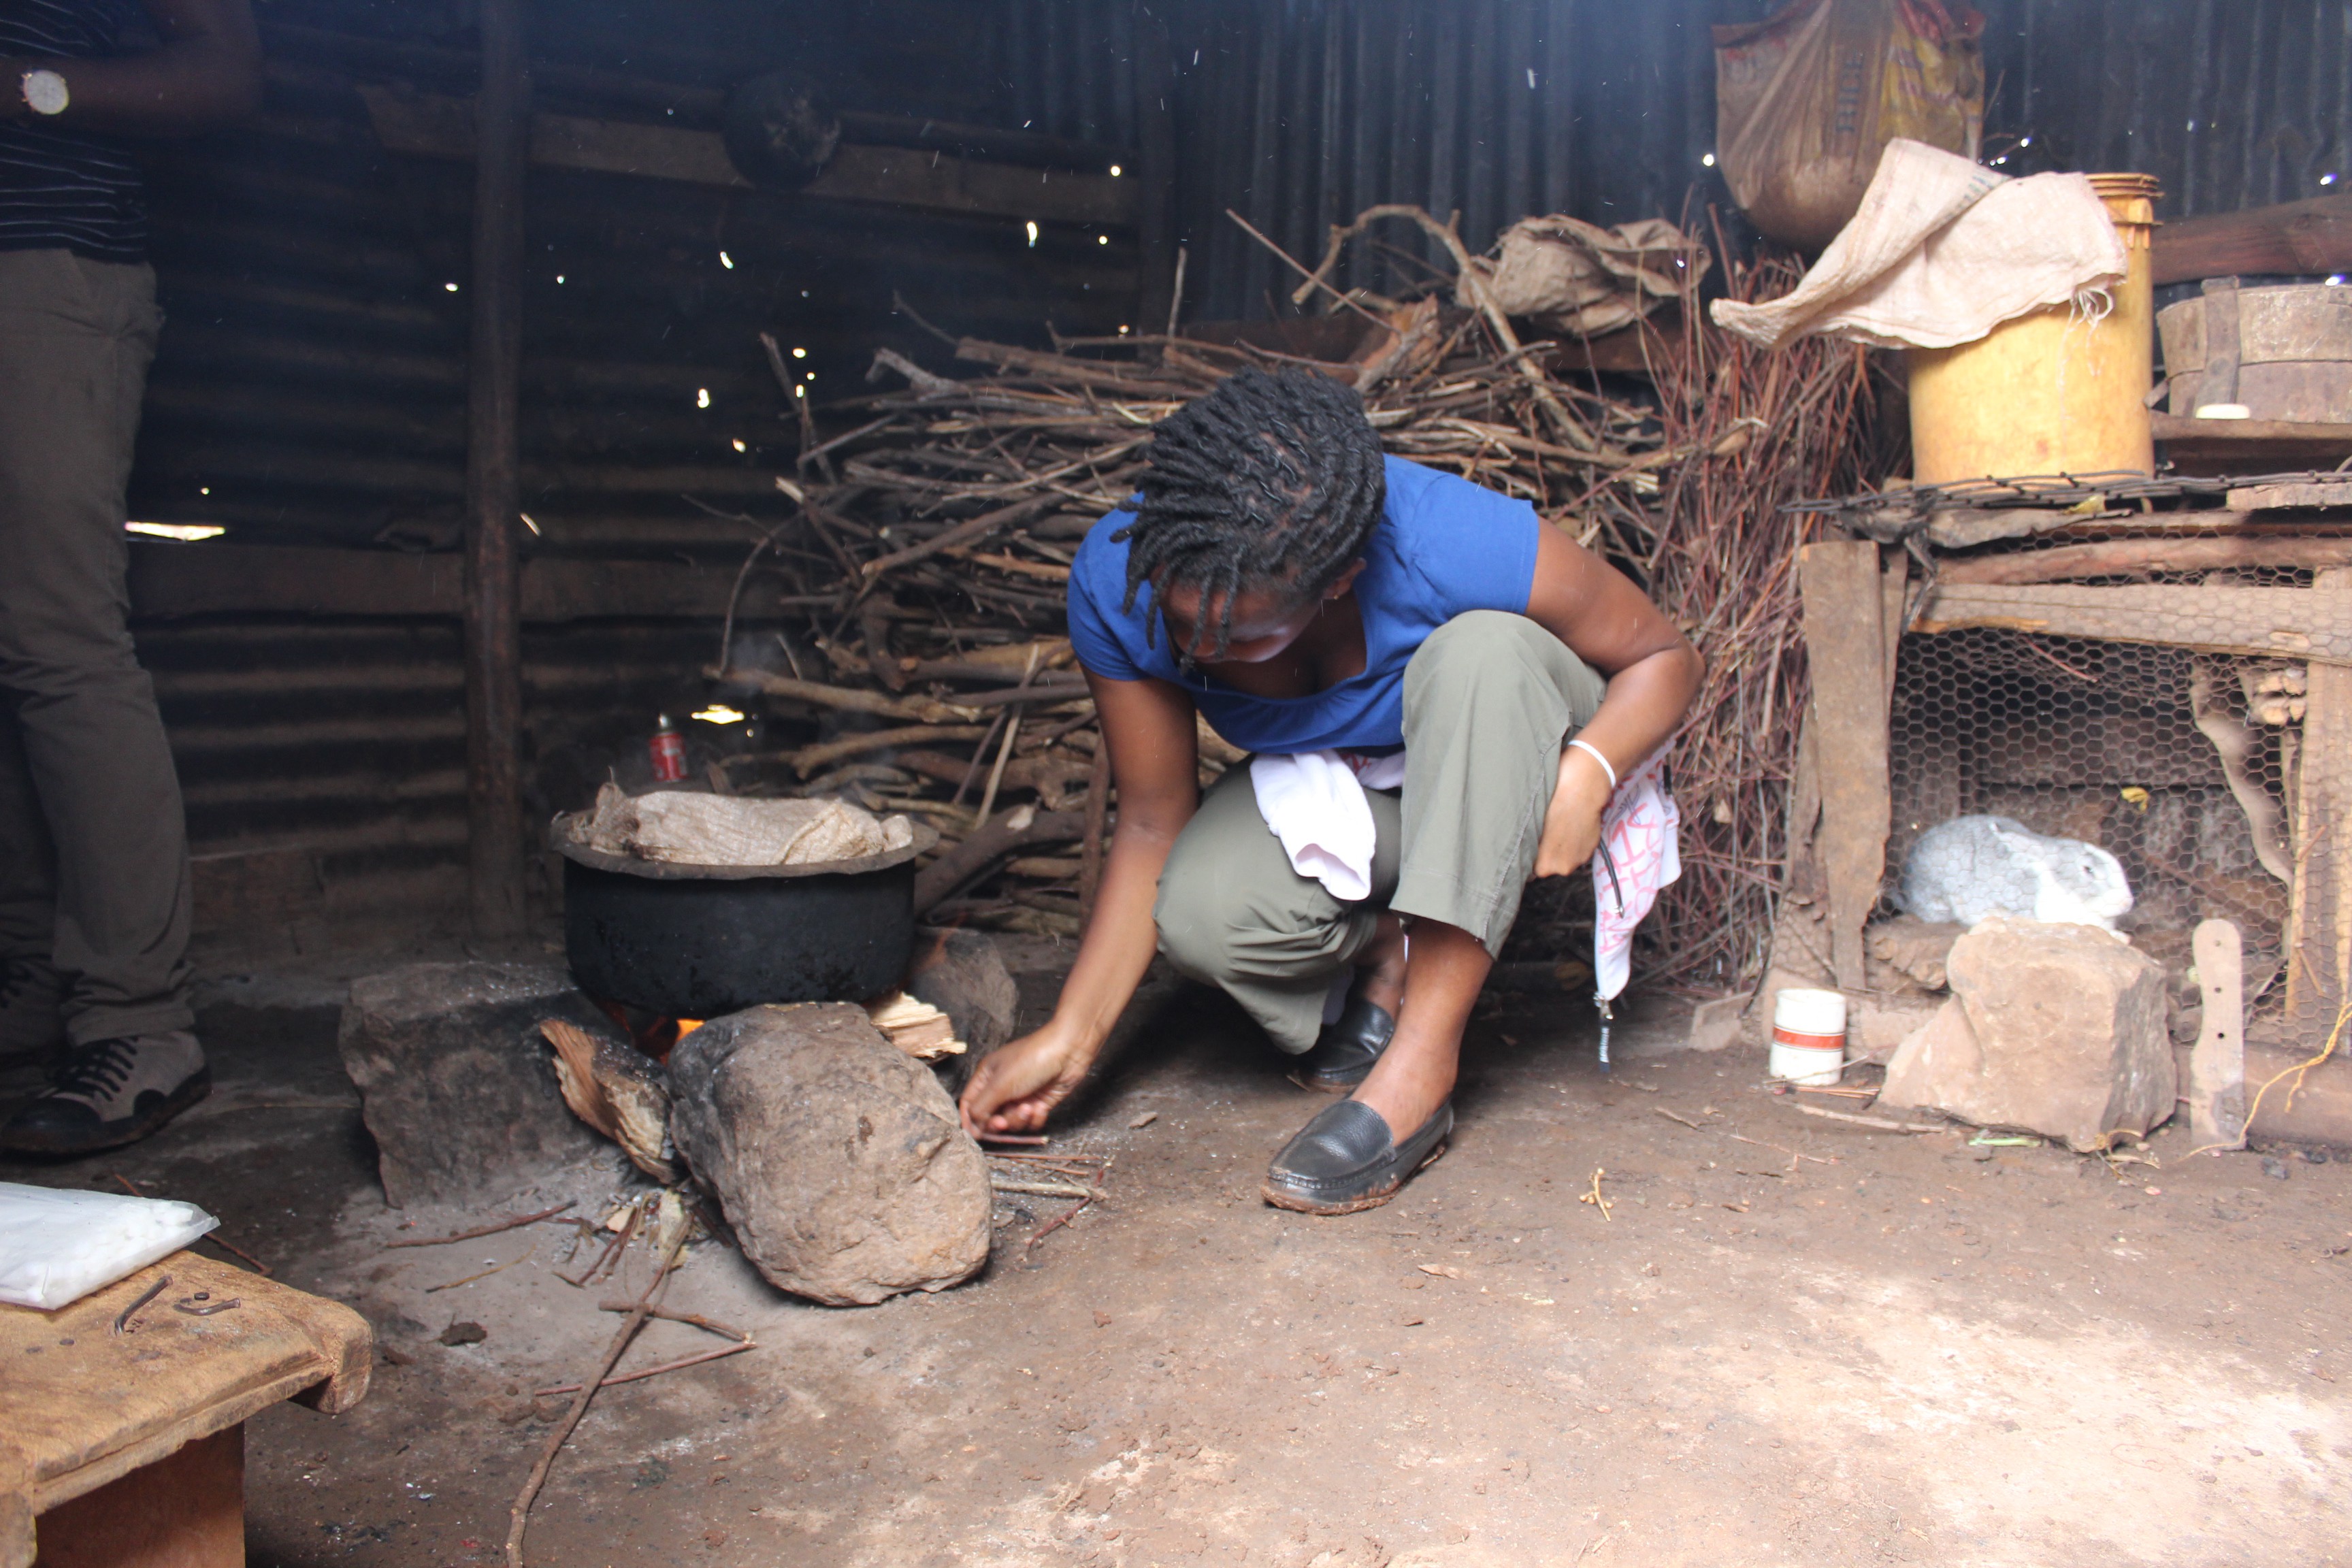
- My personal experience with household air pollution
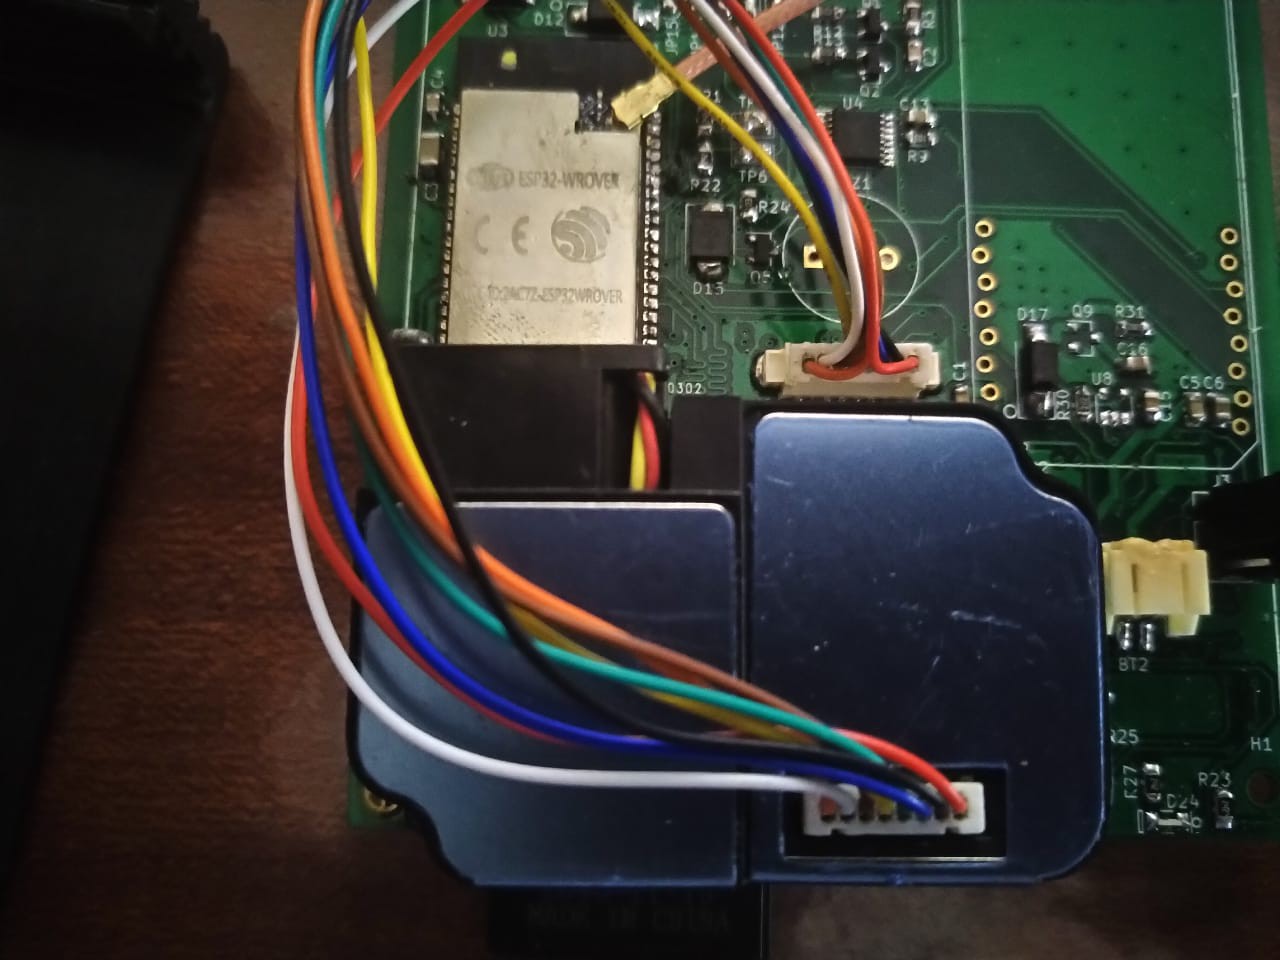
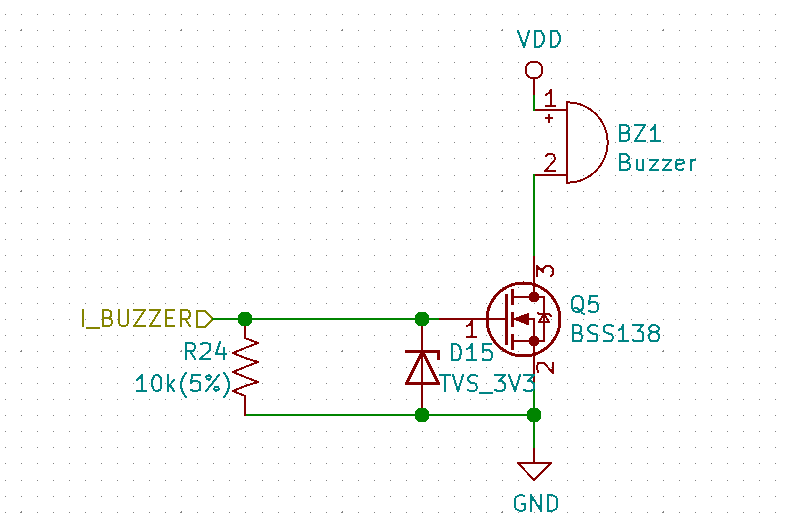
- Prototype schematic entry
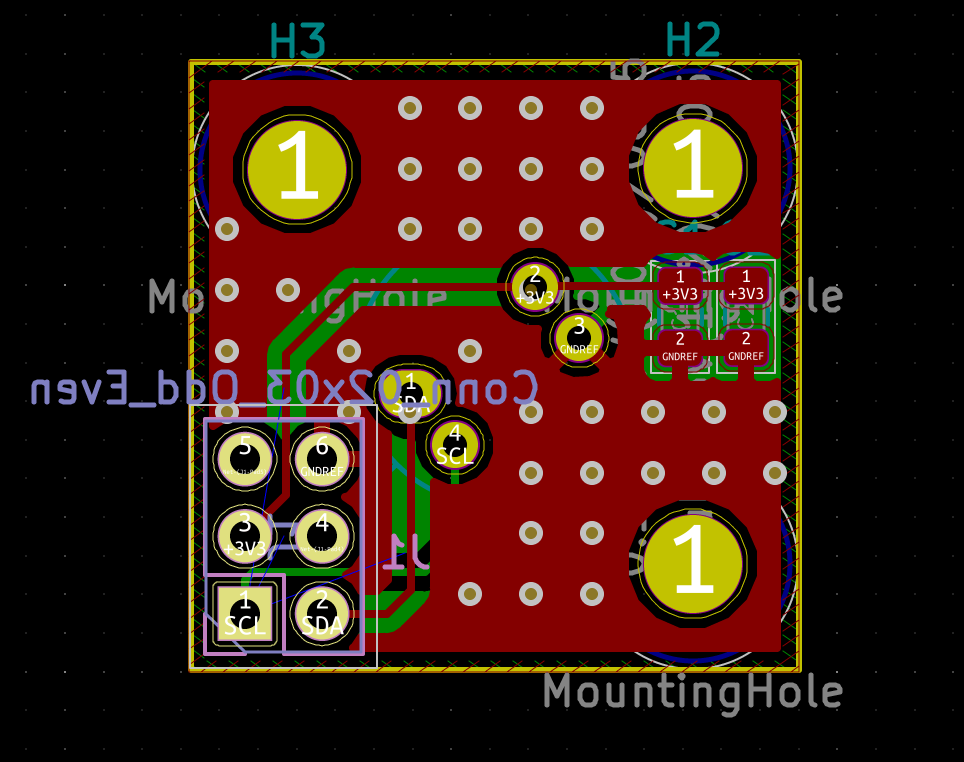
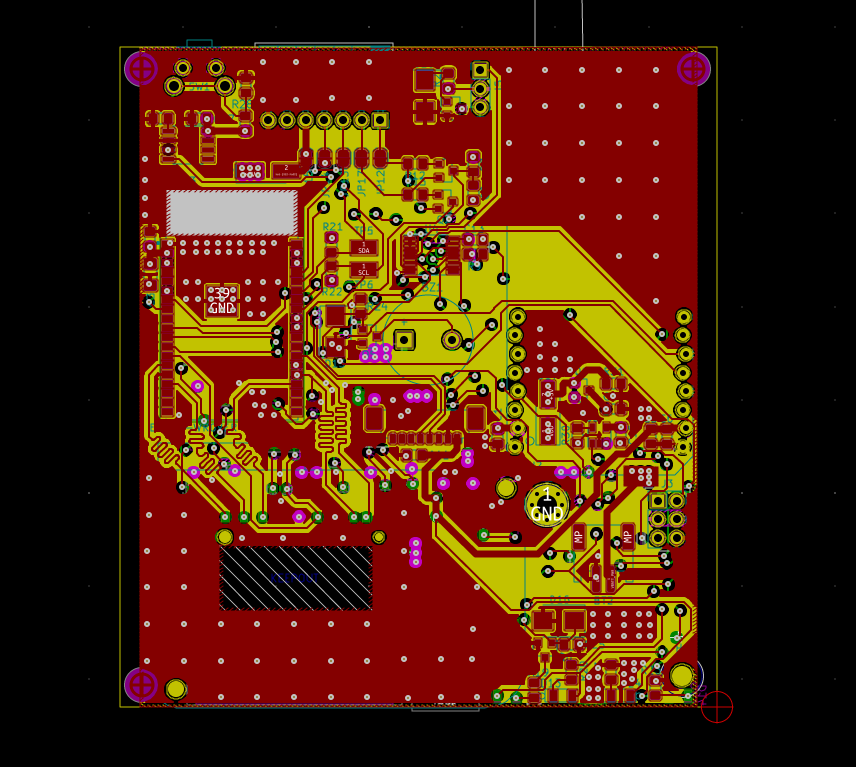
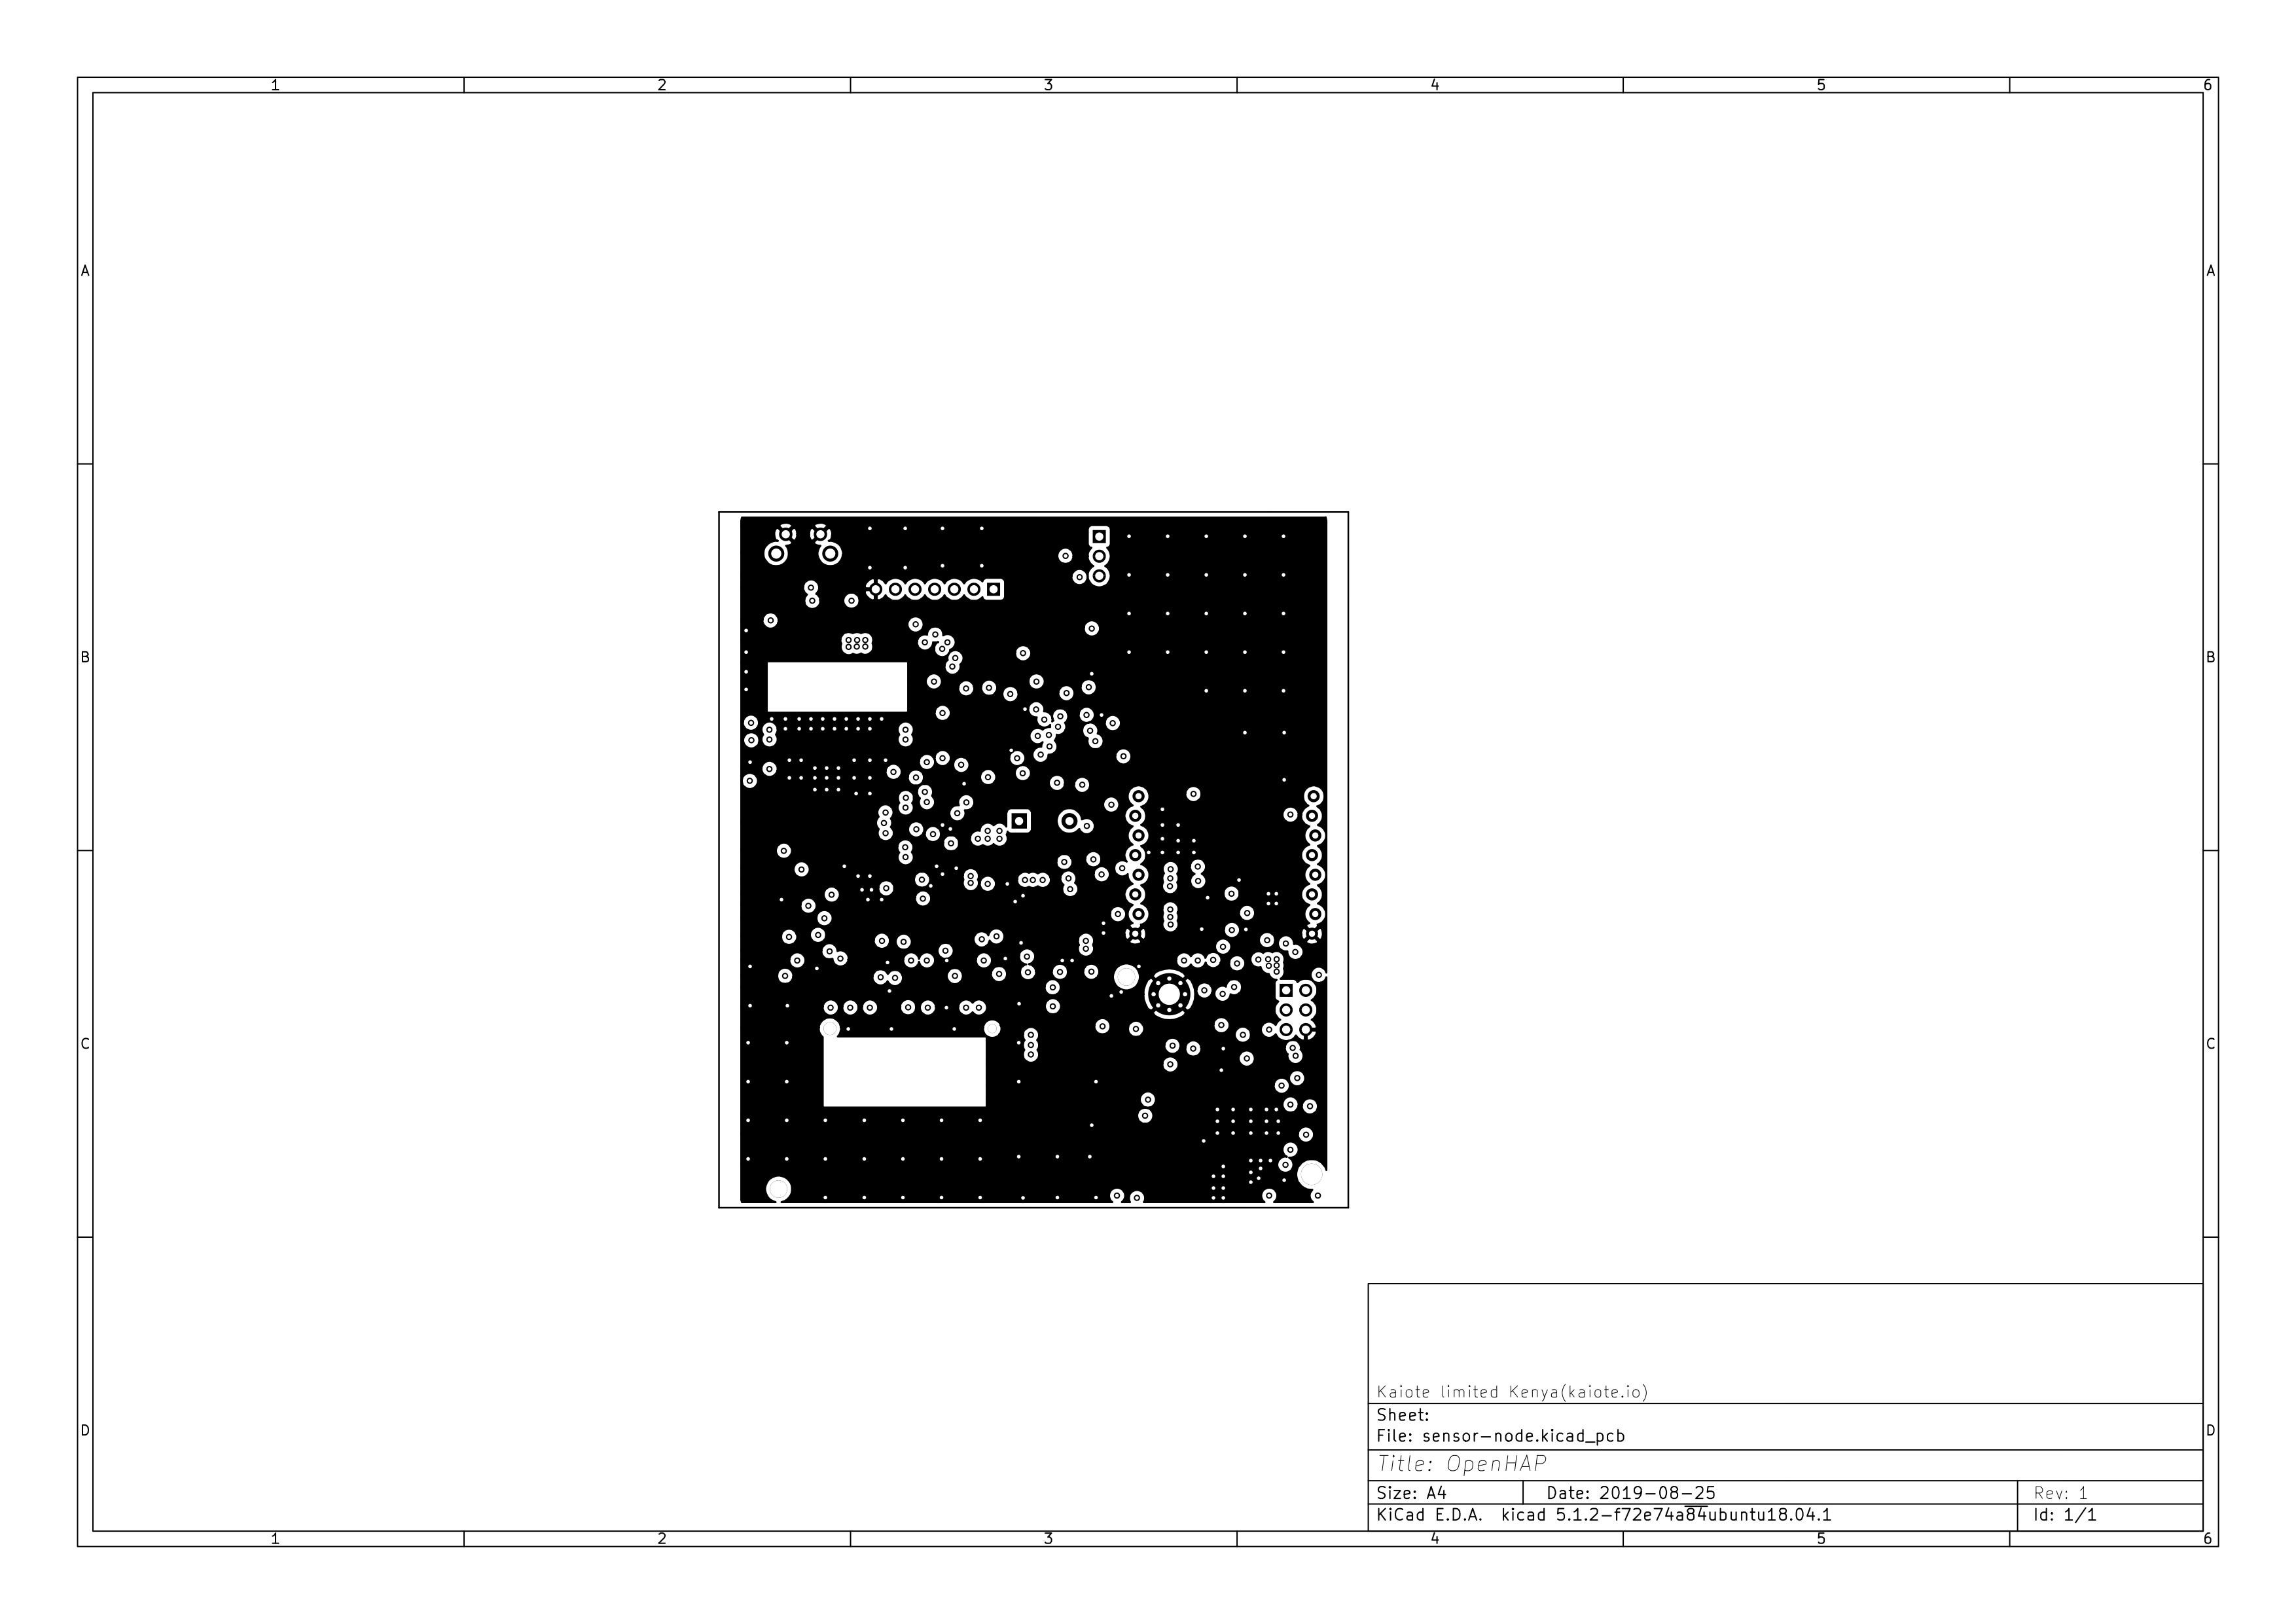
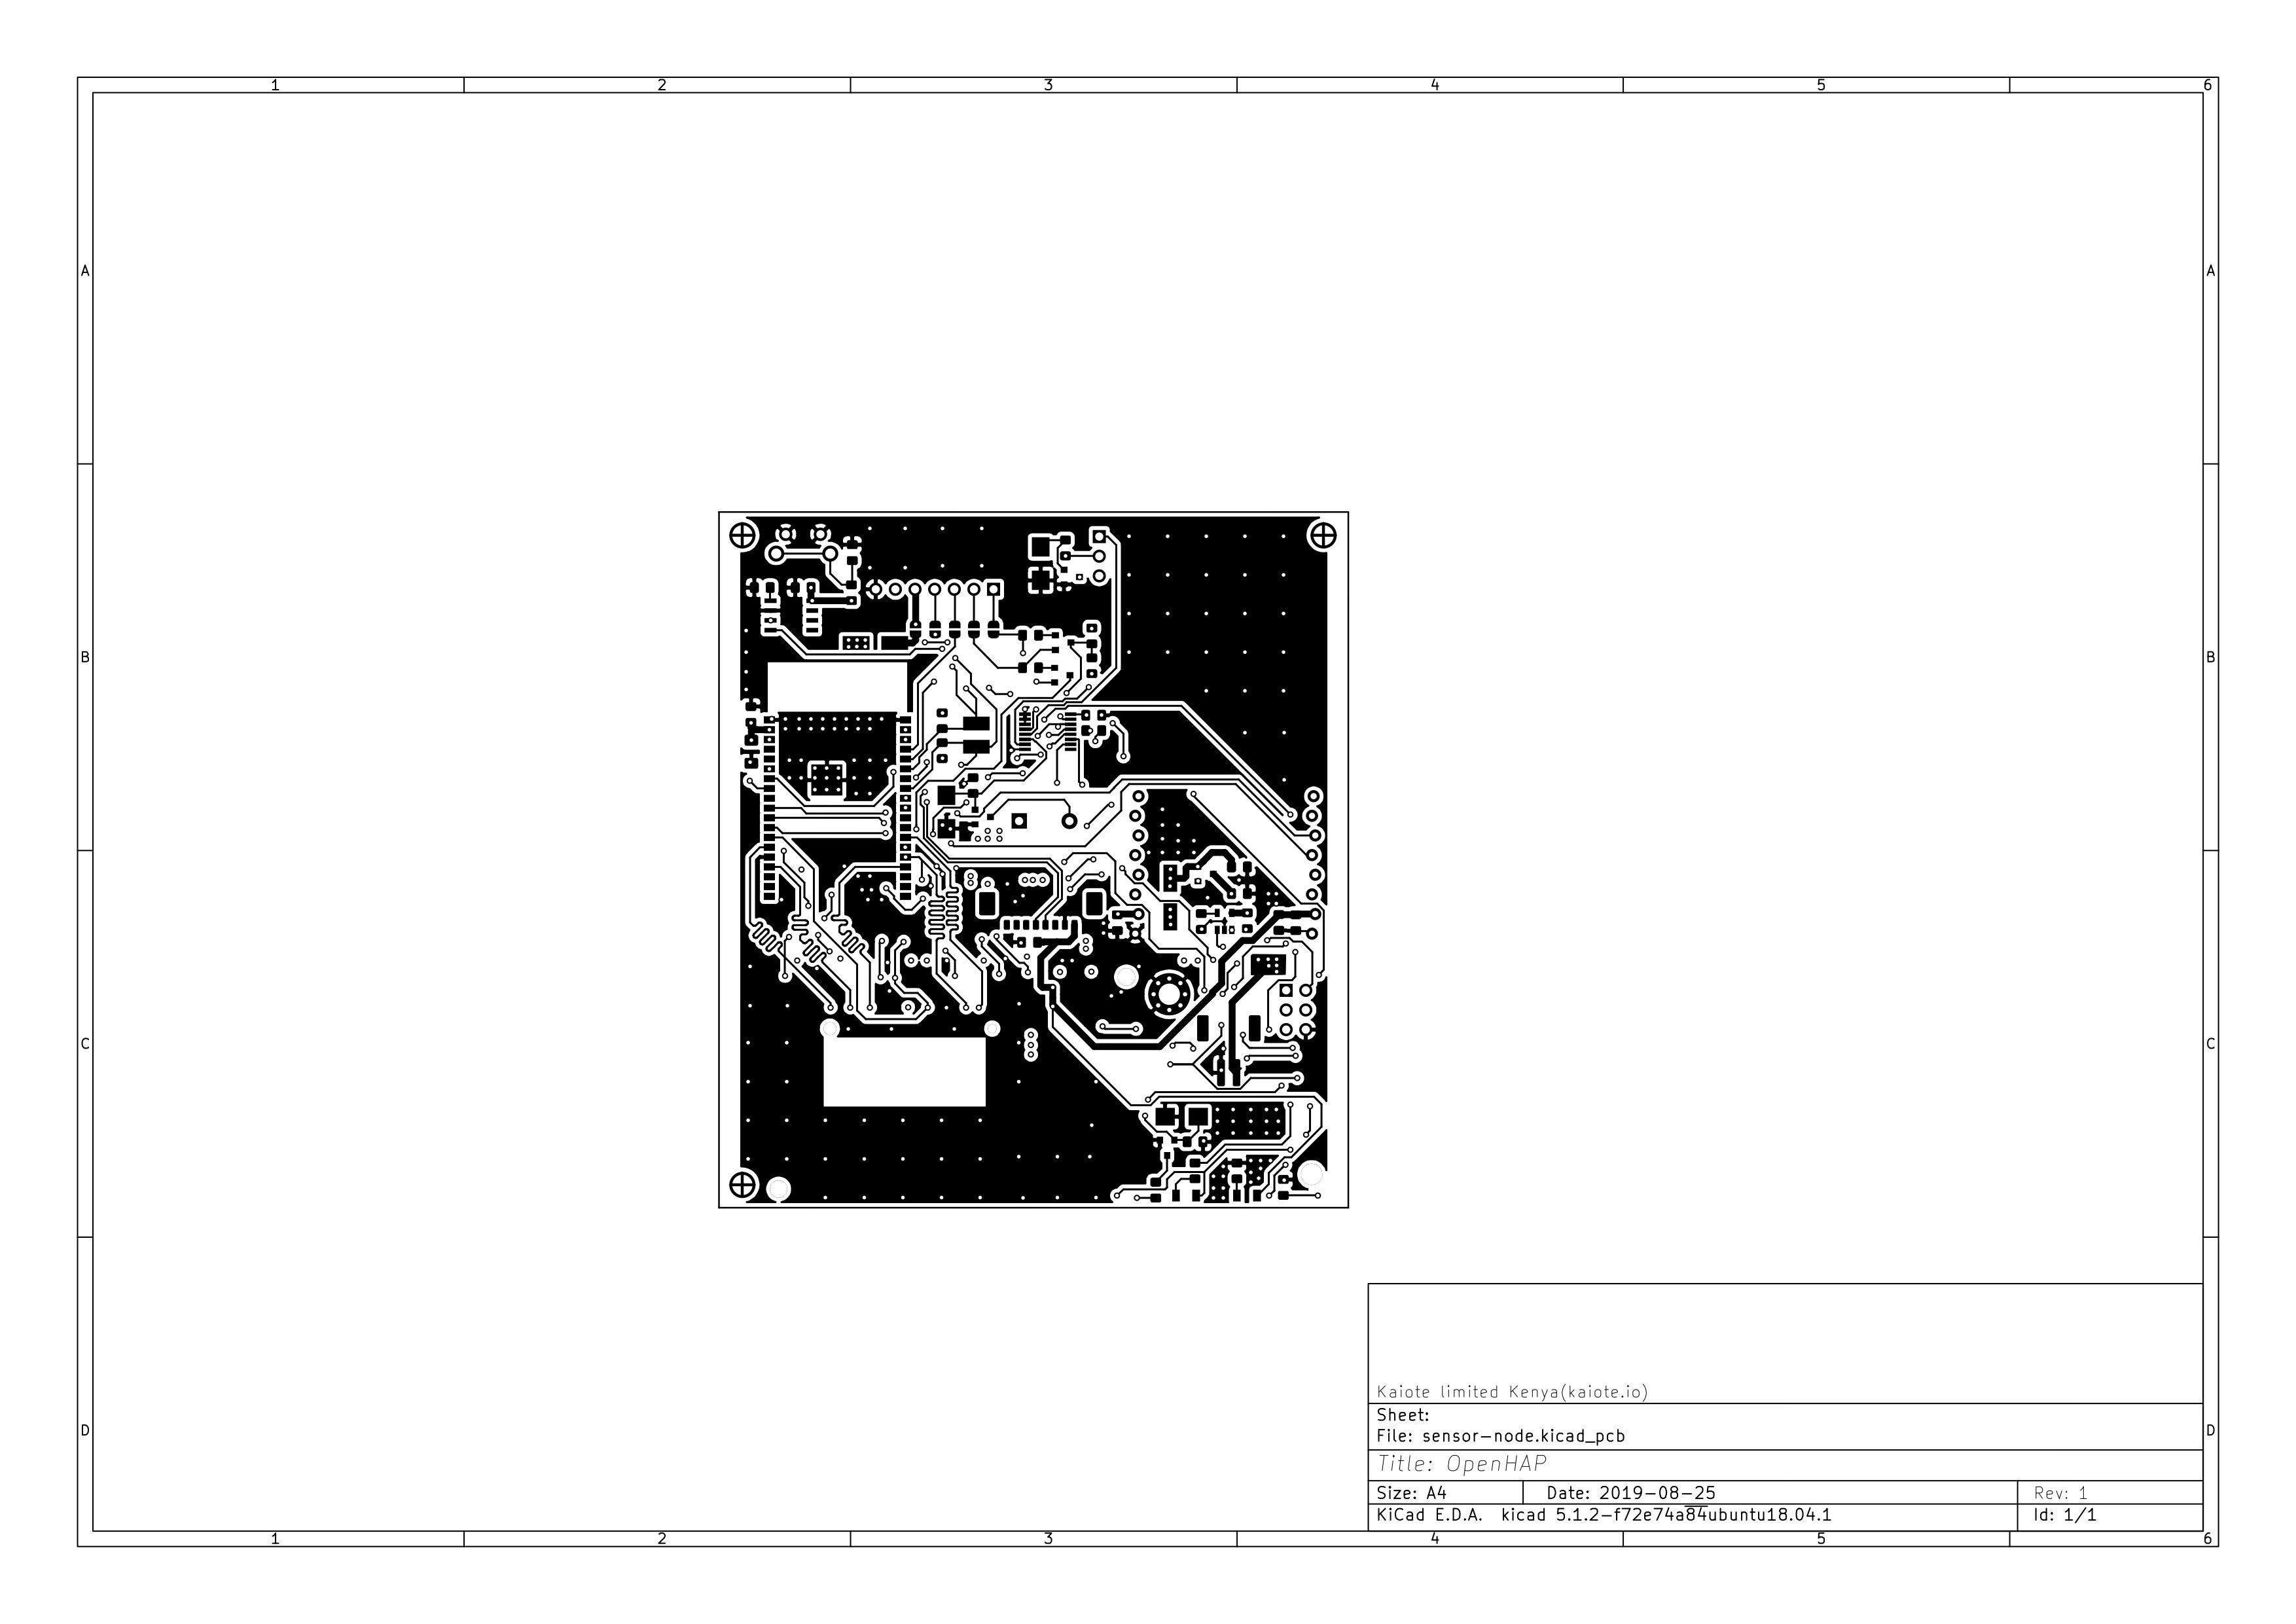
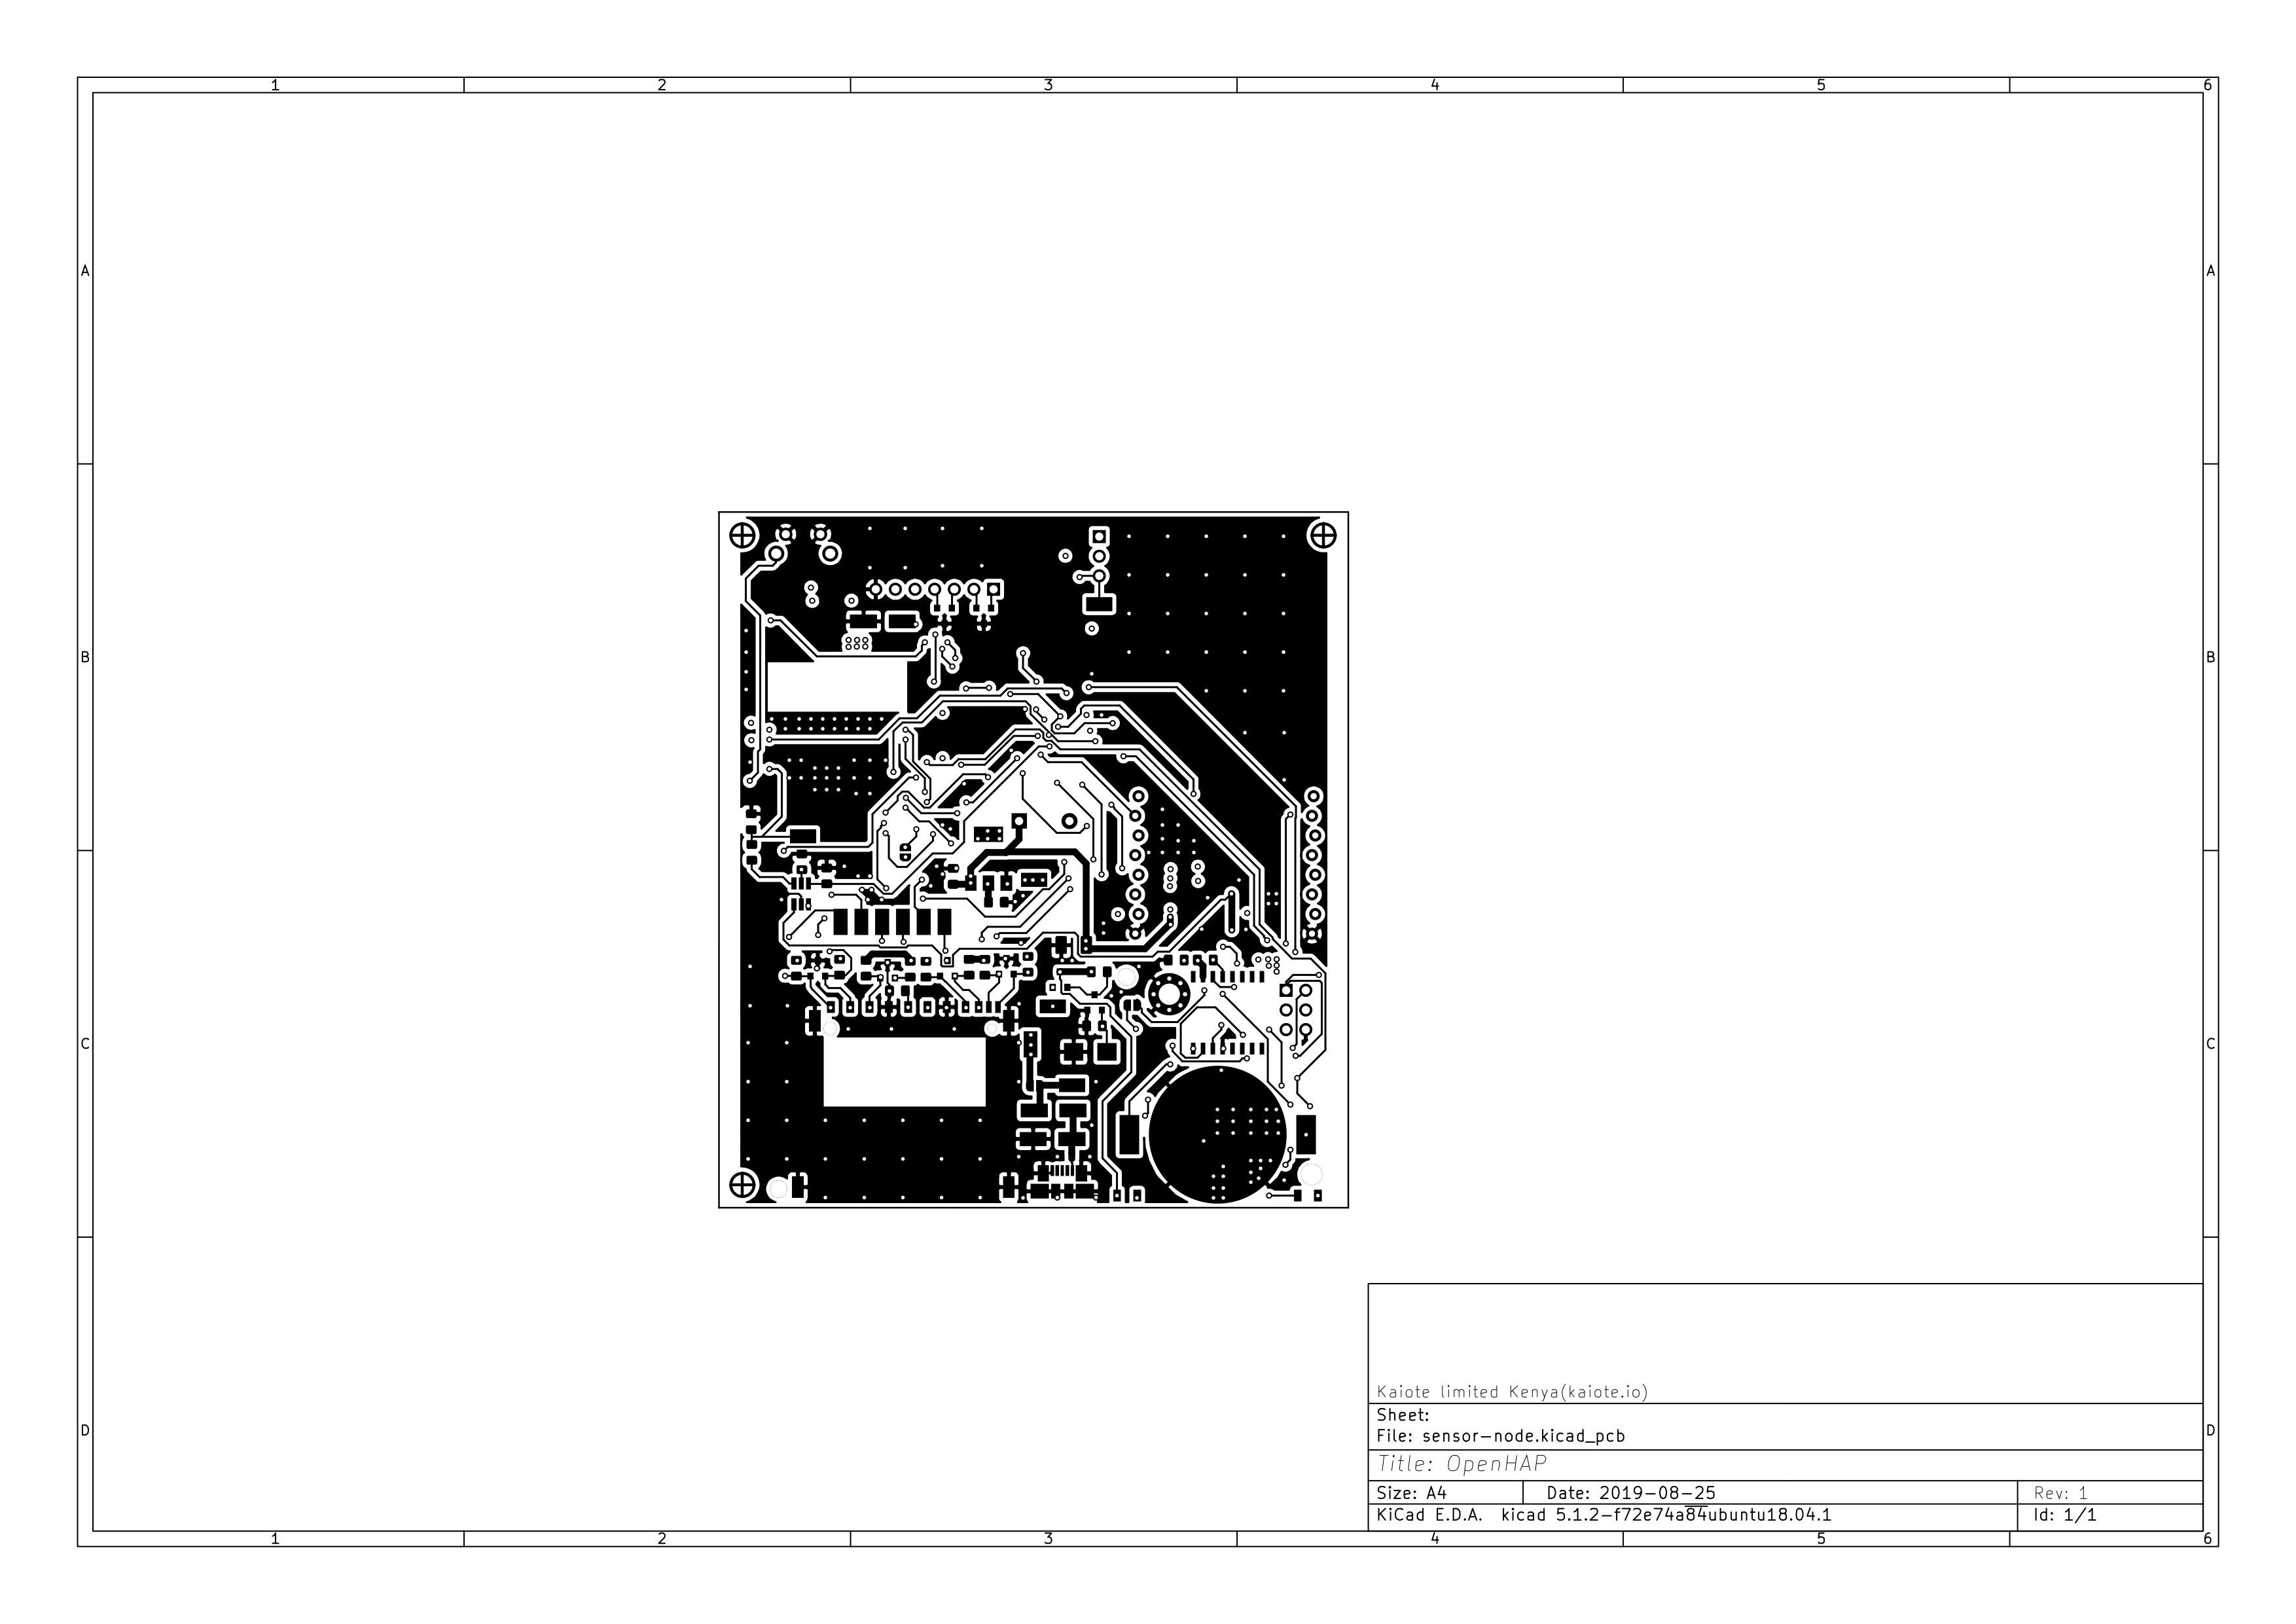
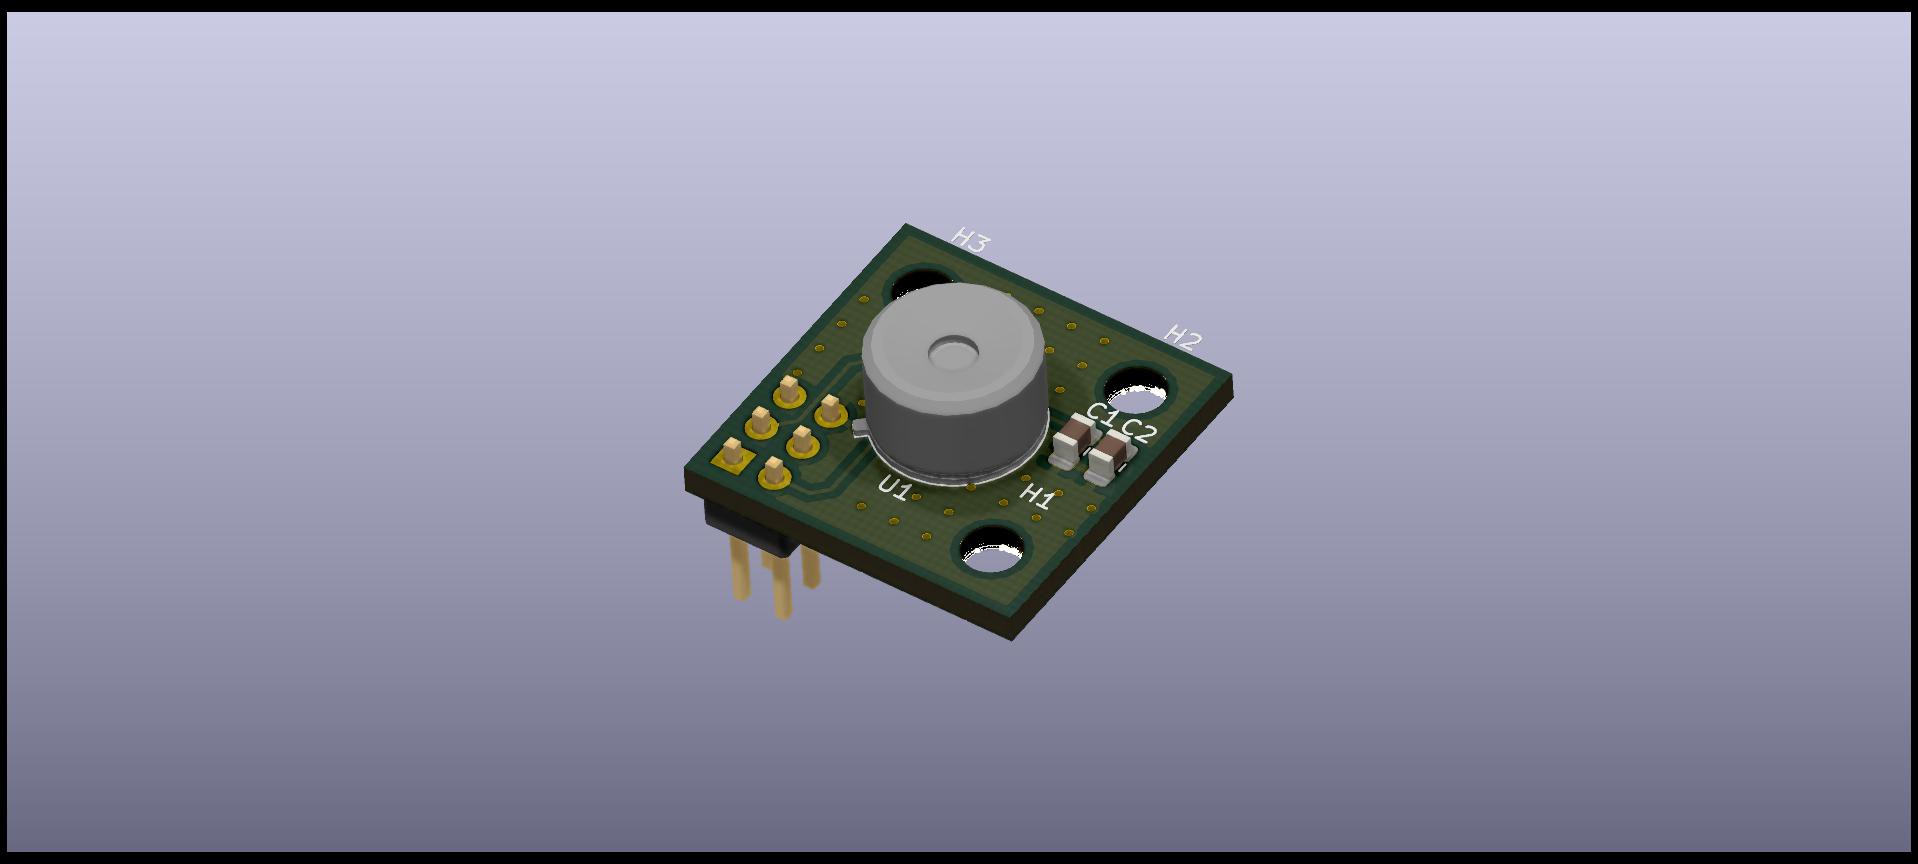
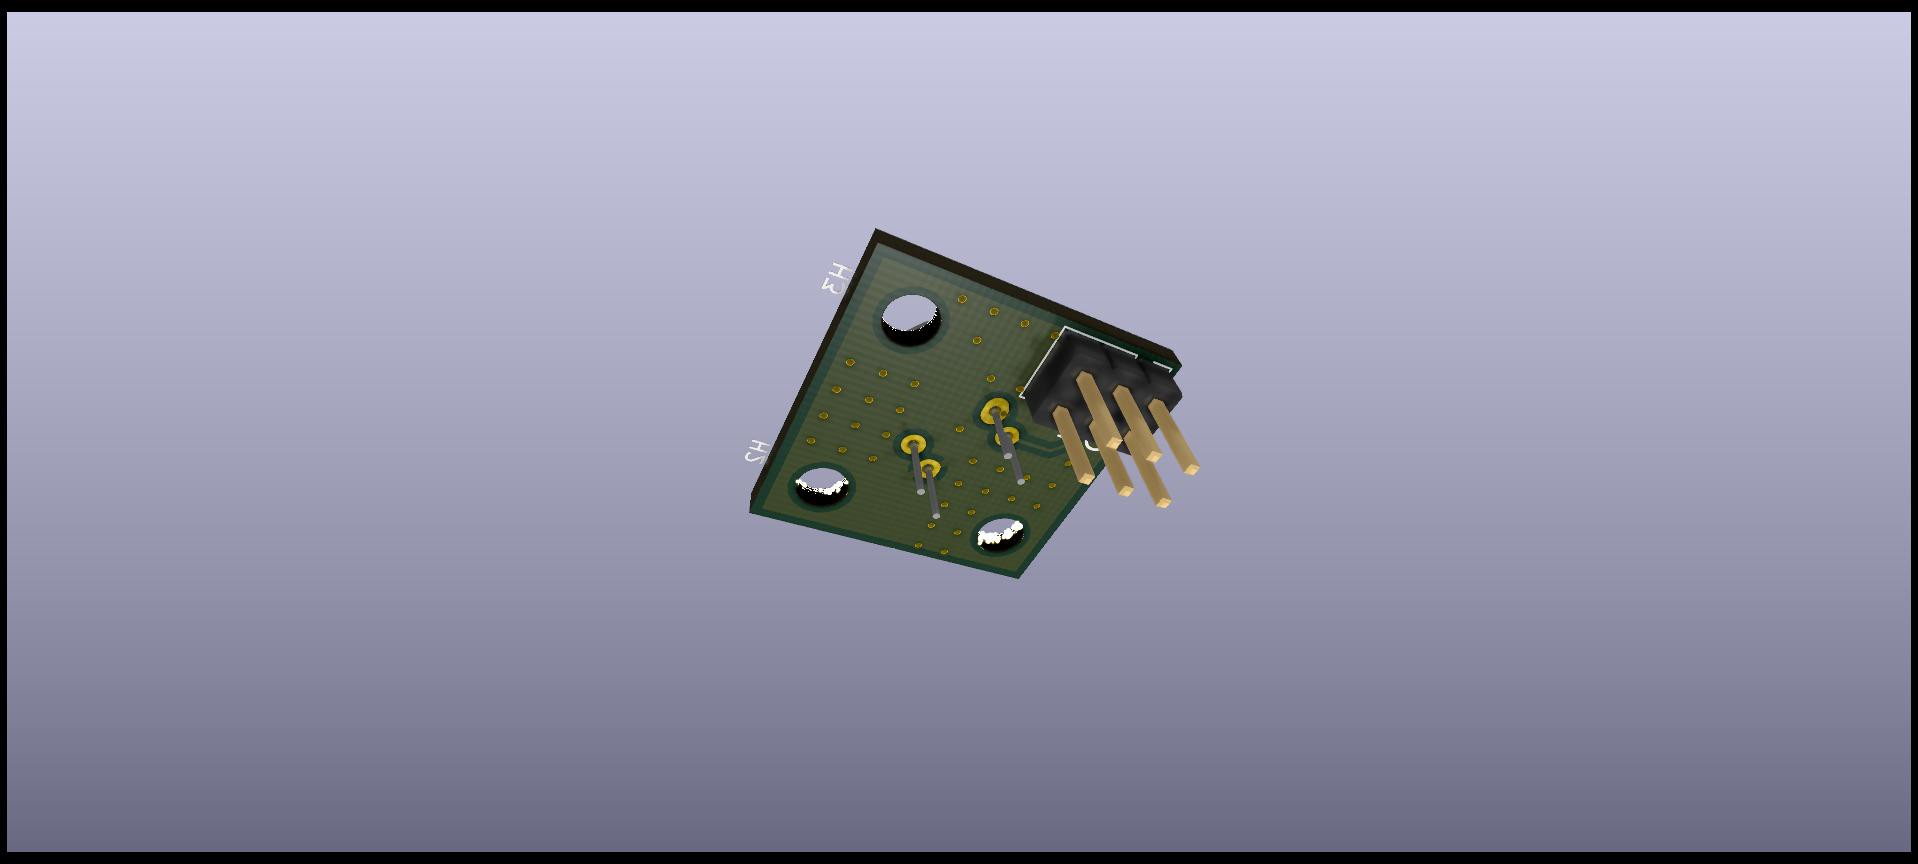
- Prototype PCB layout
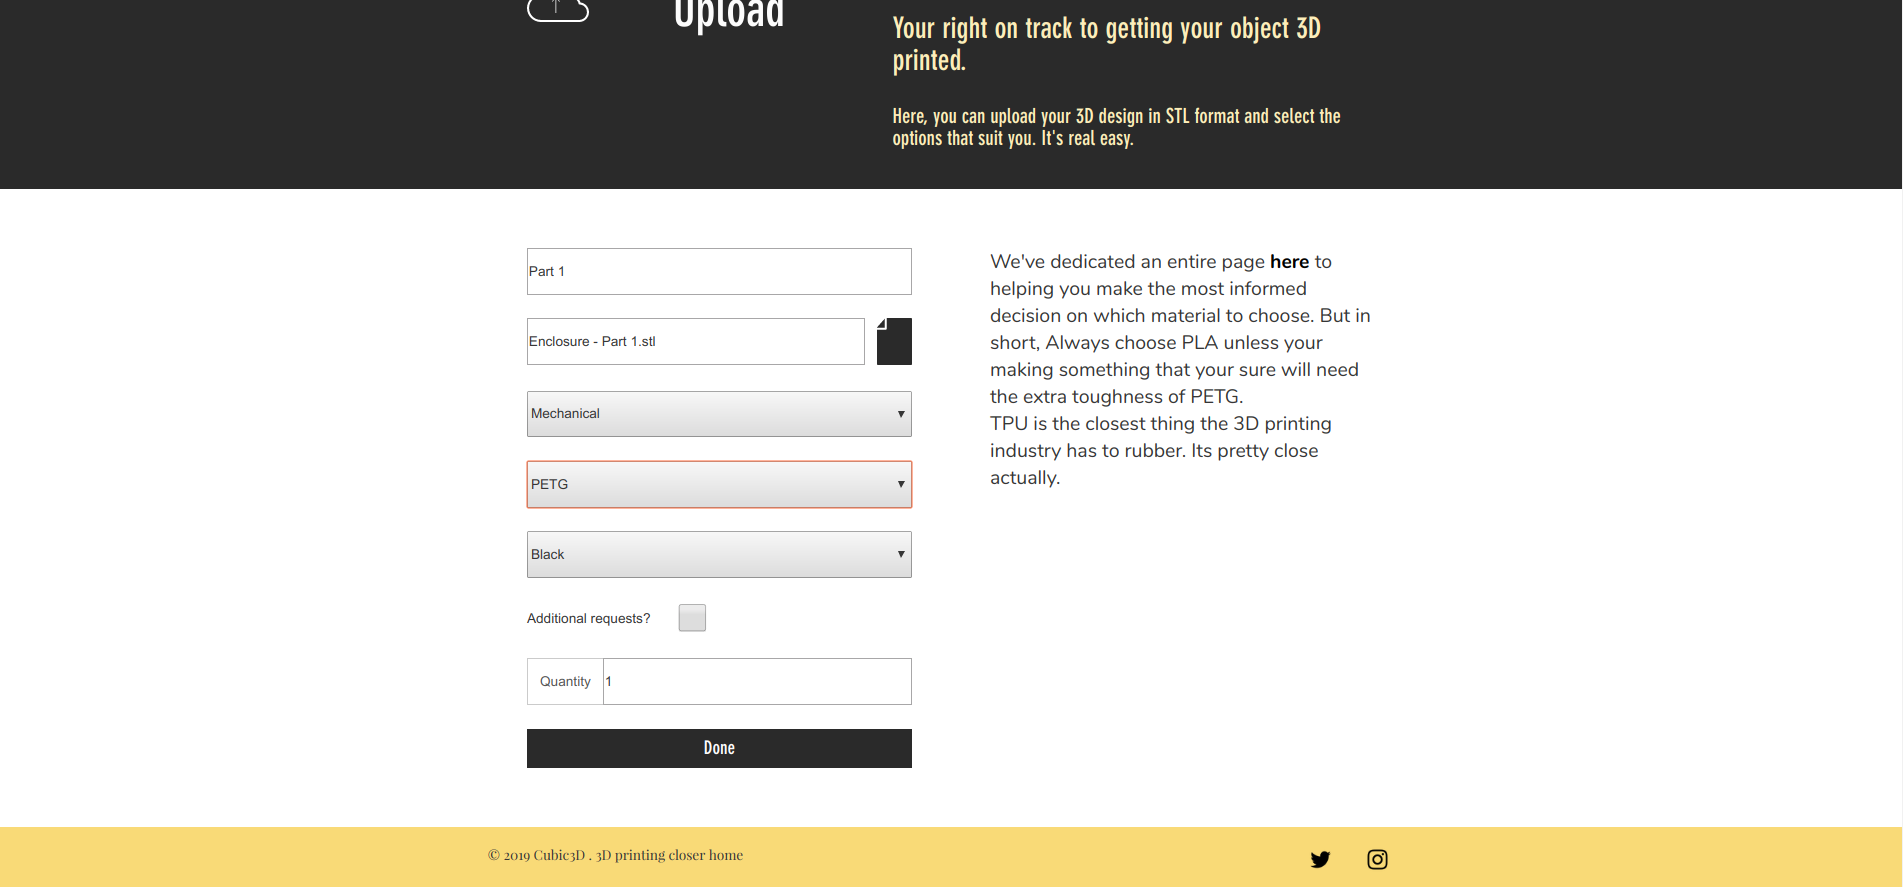
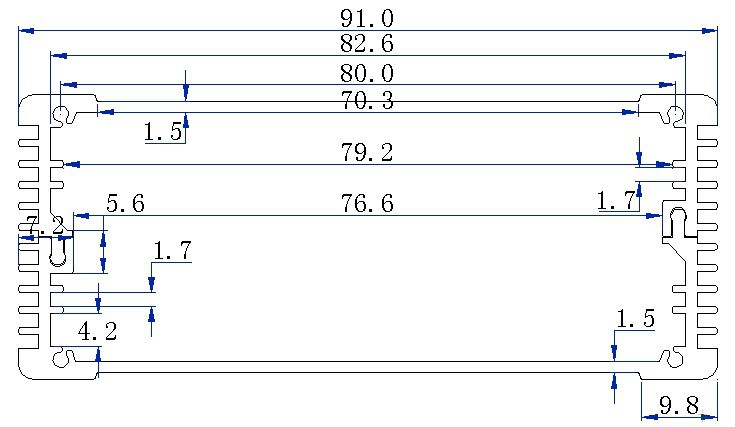
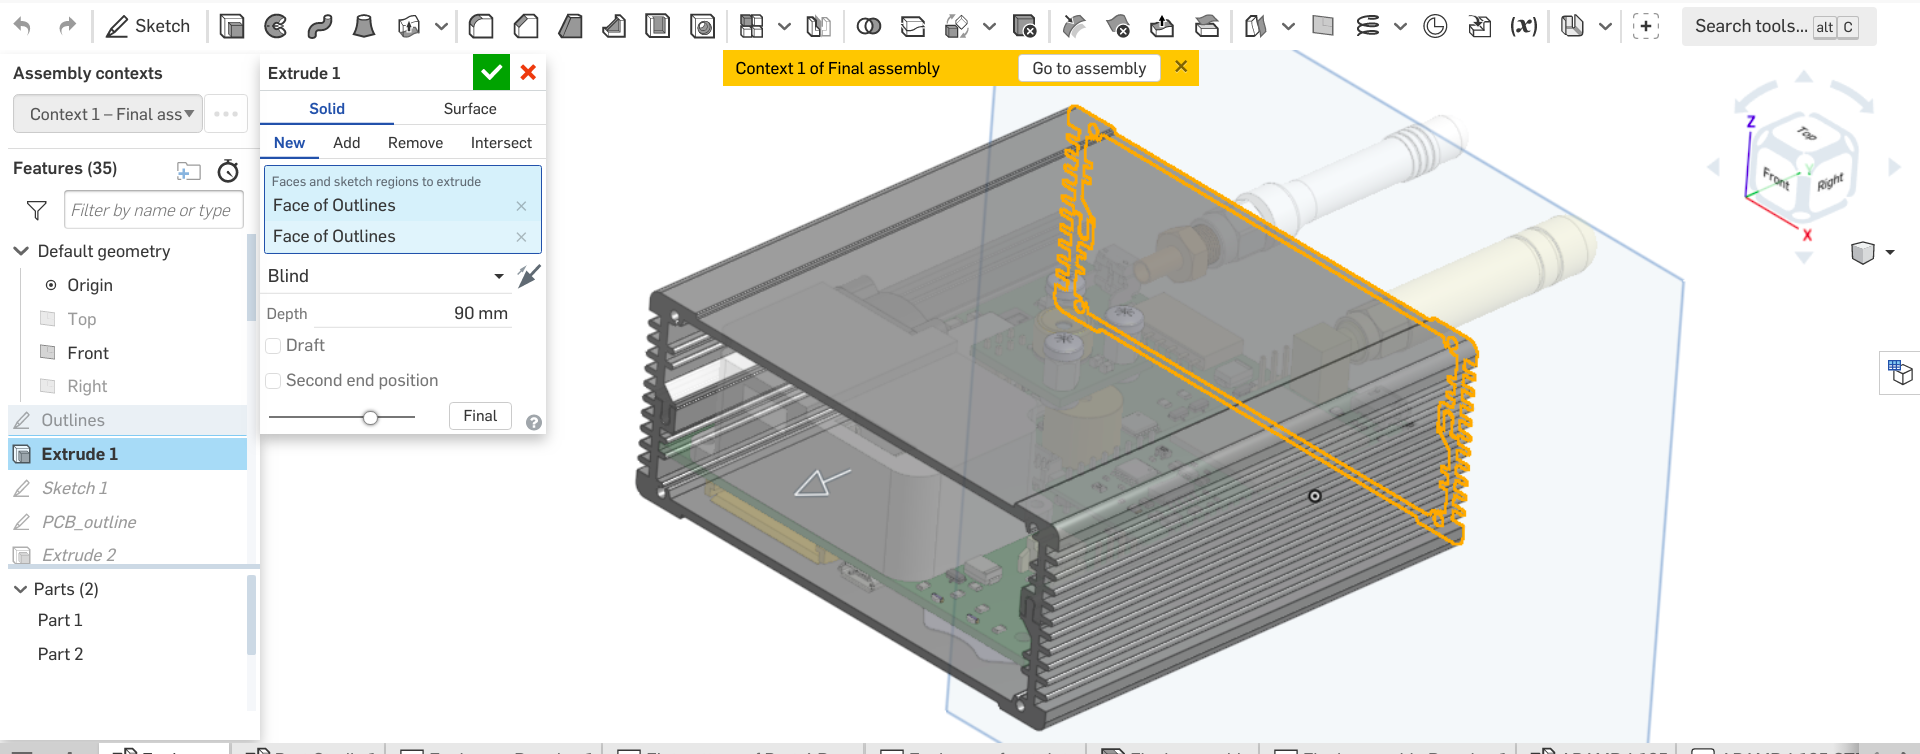
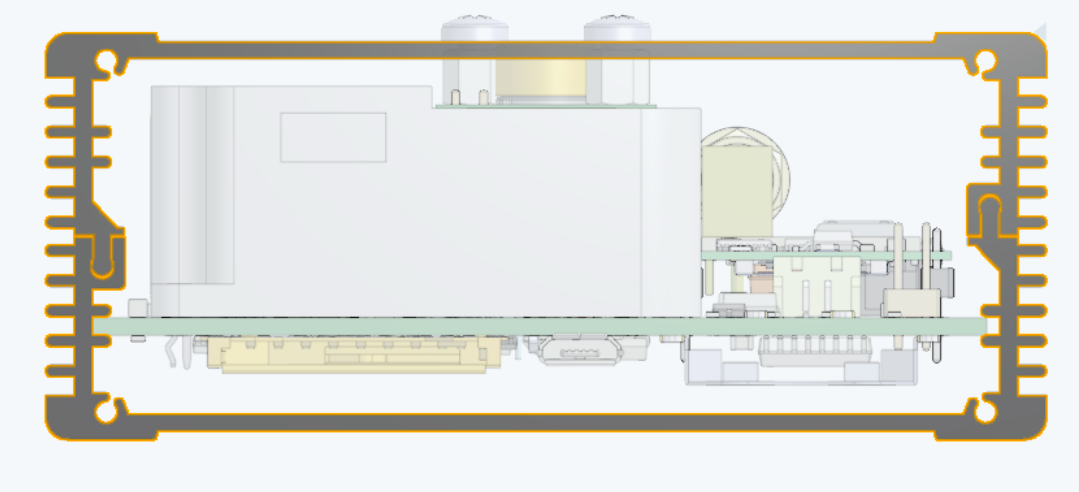
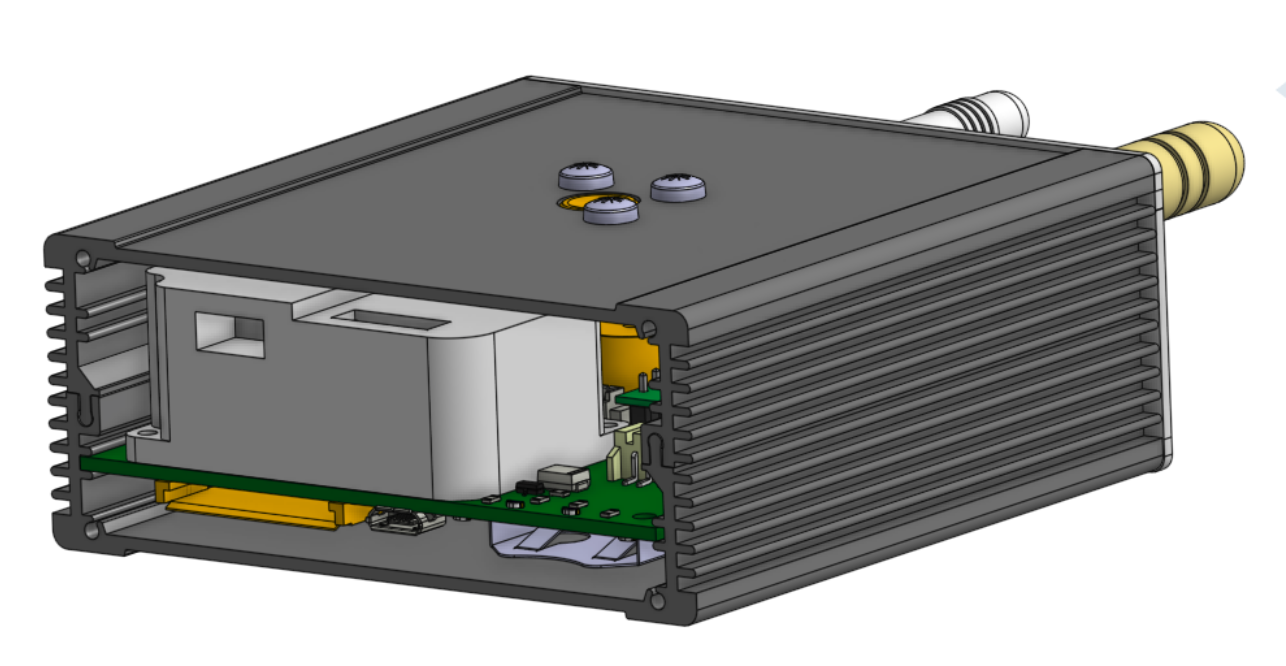
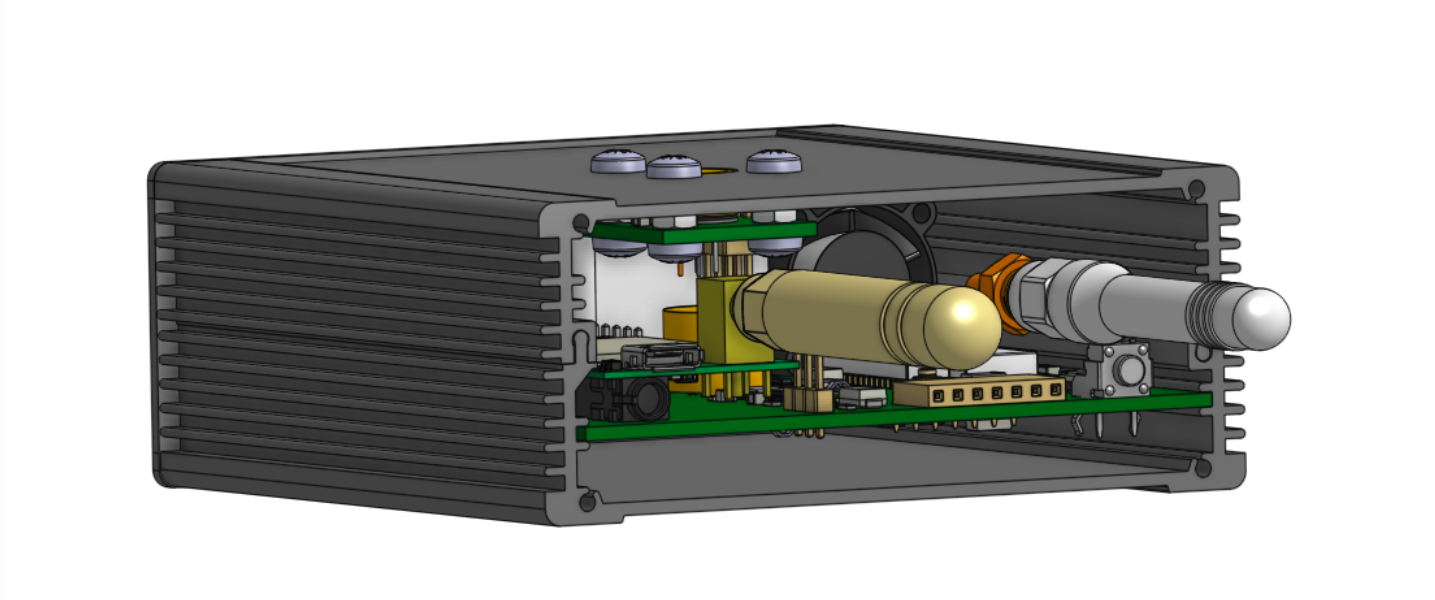
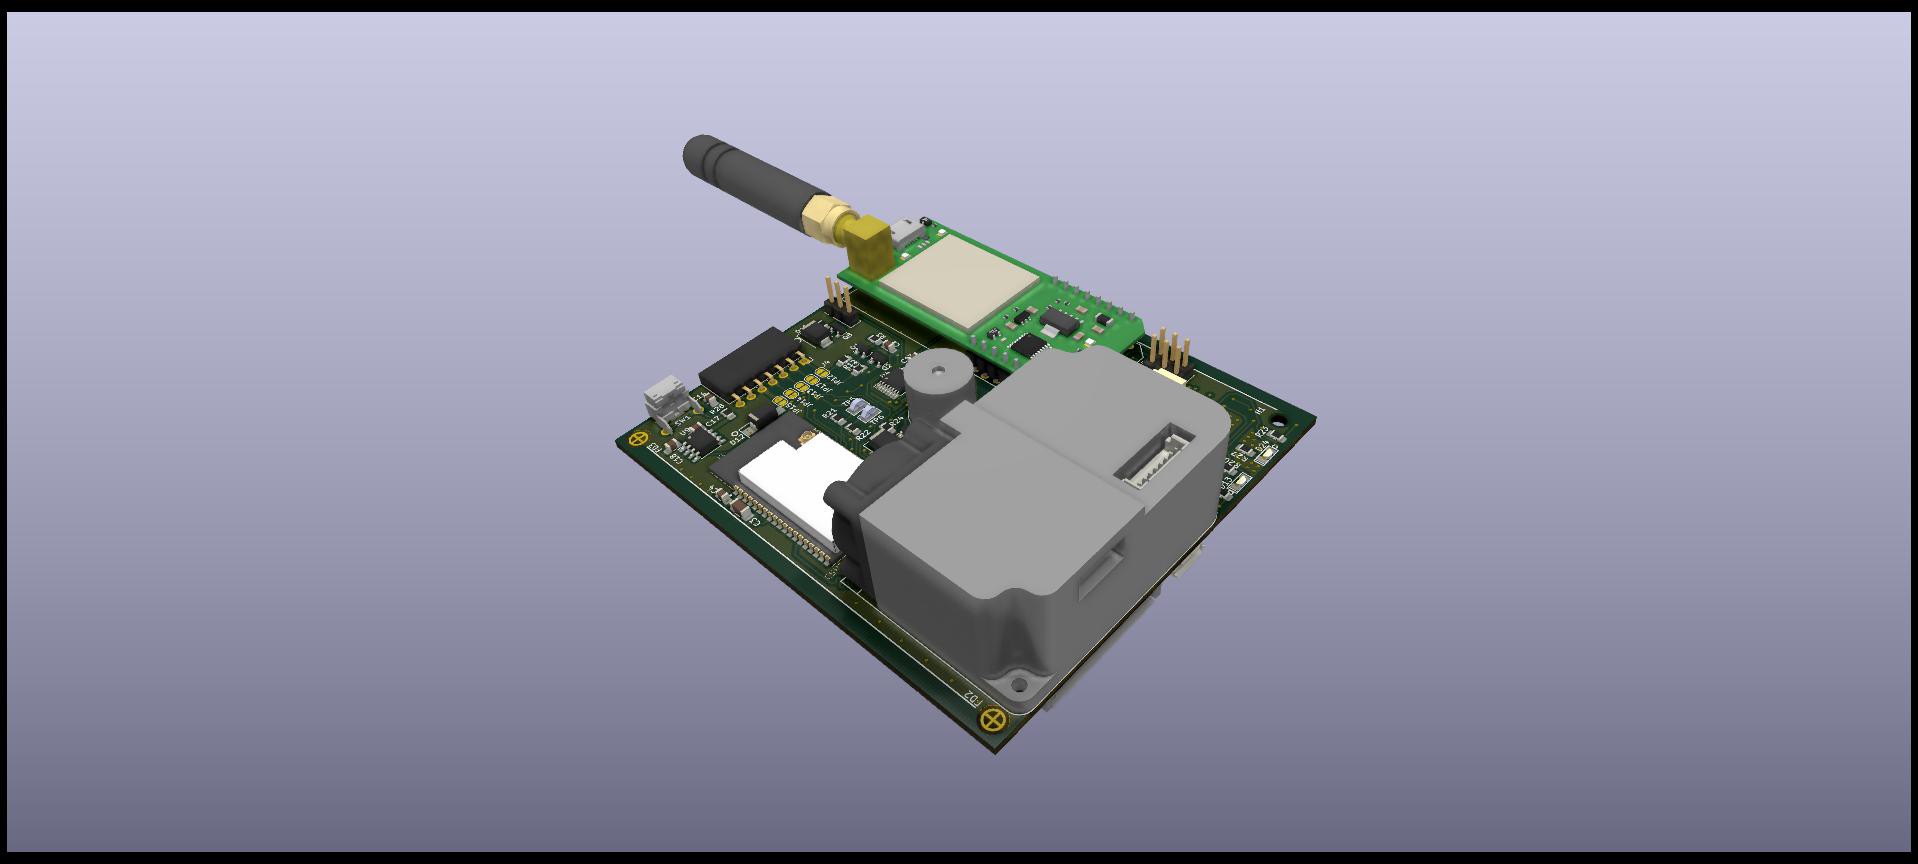
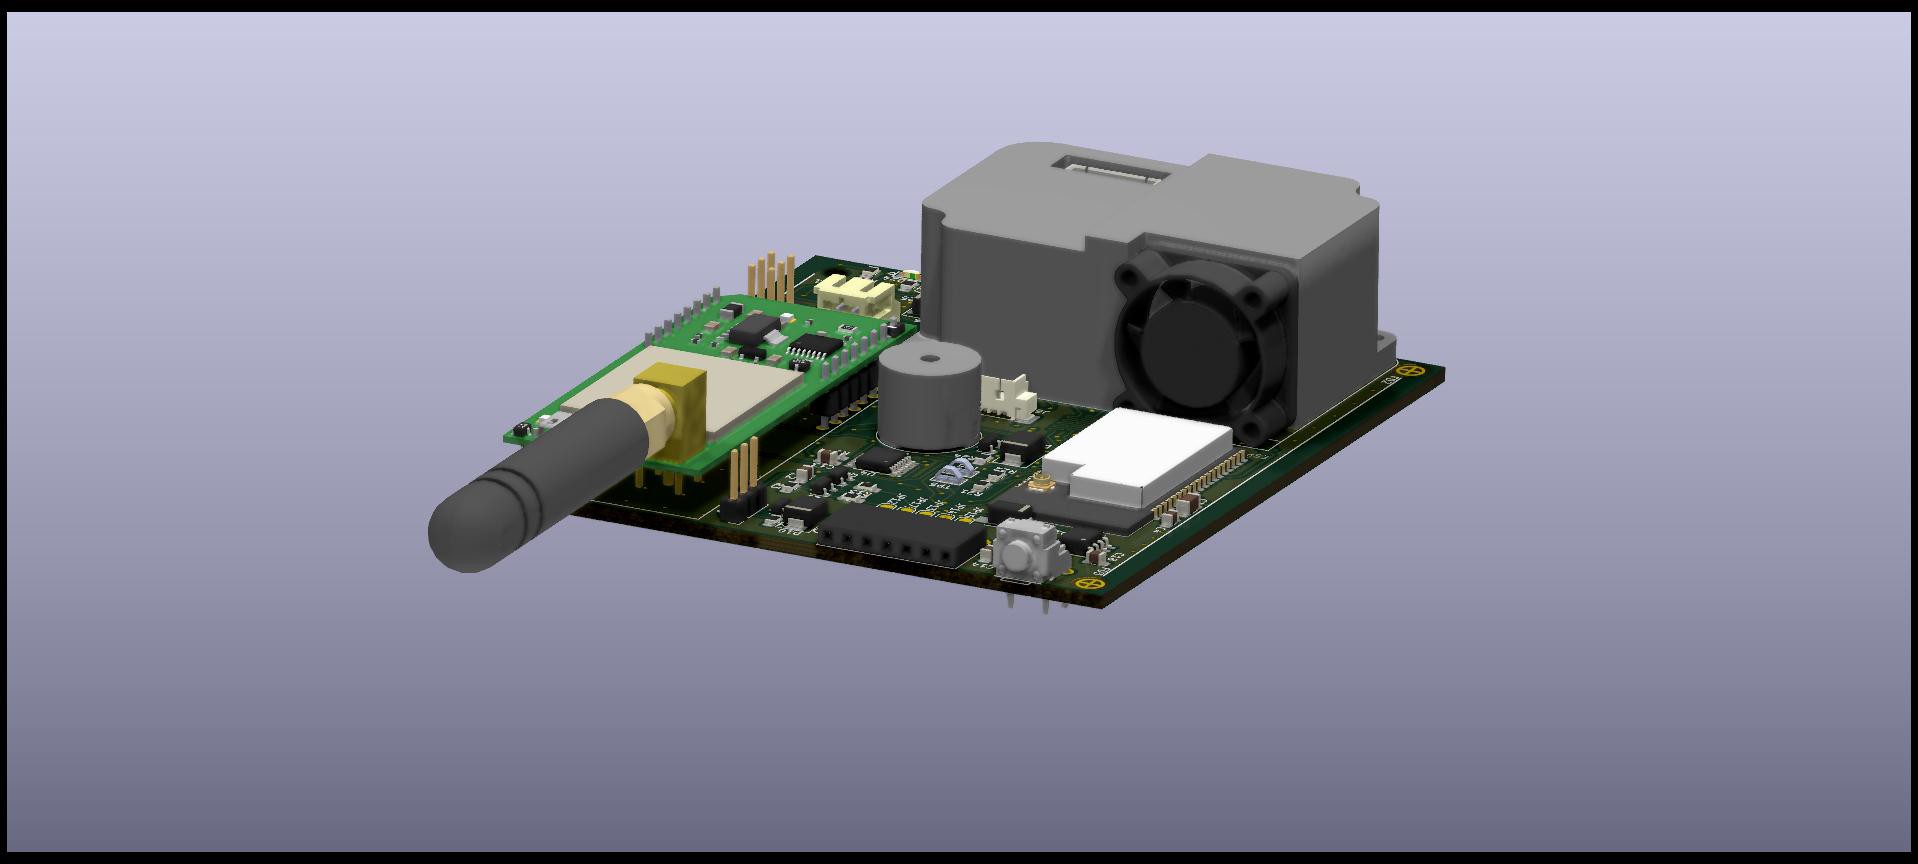
- 3D printing the prototype enclosure
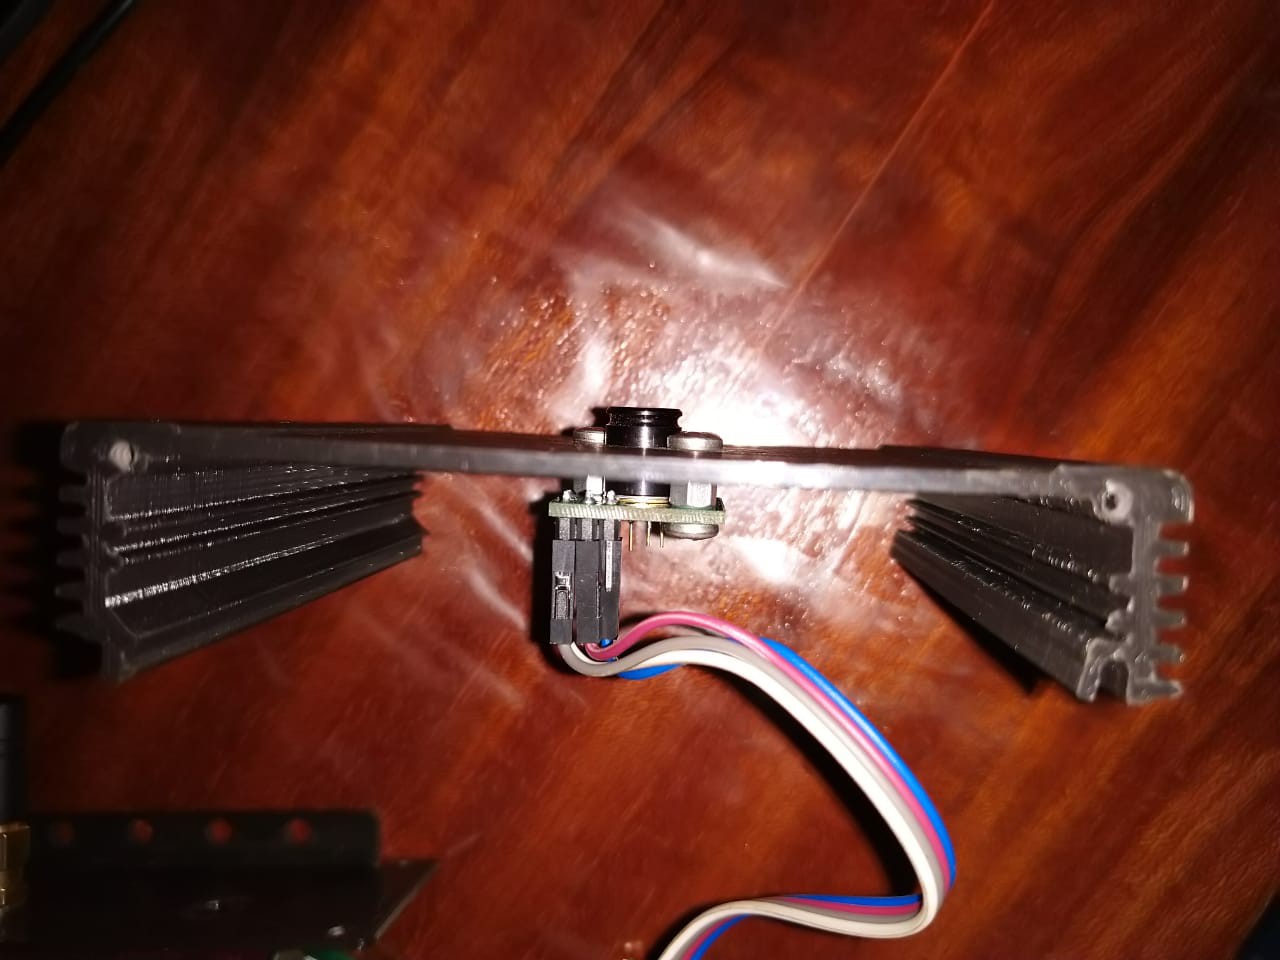
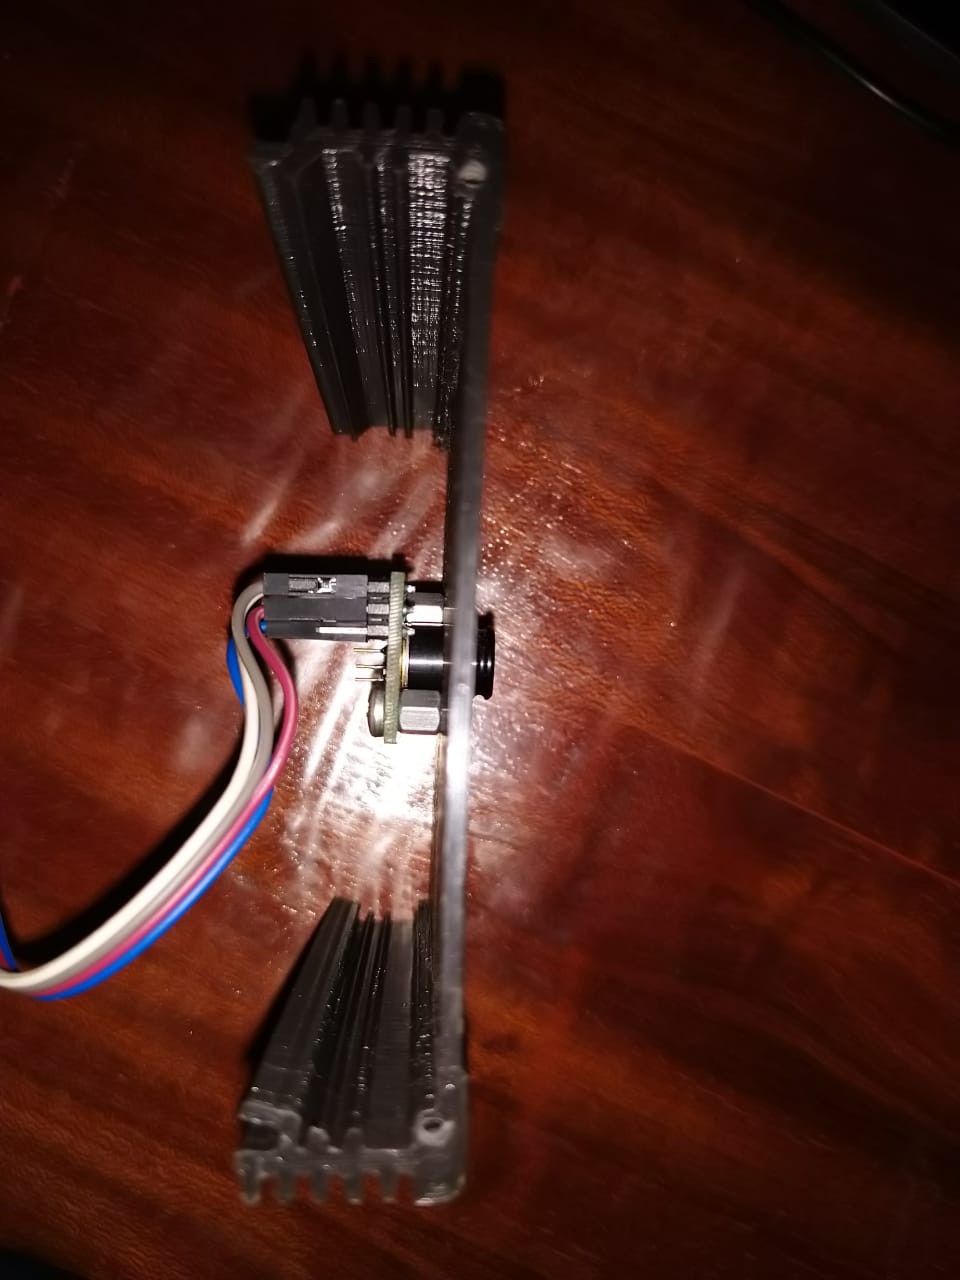
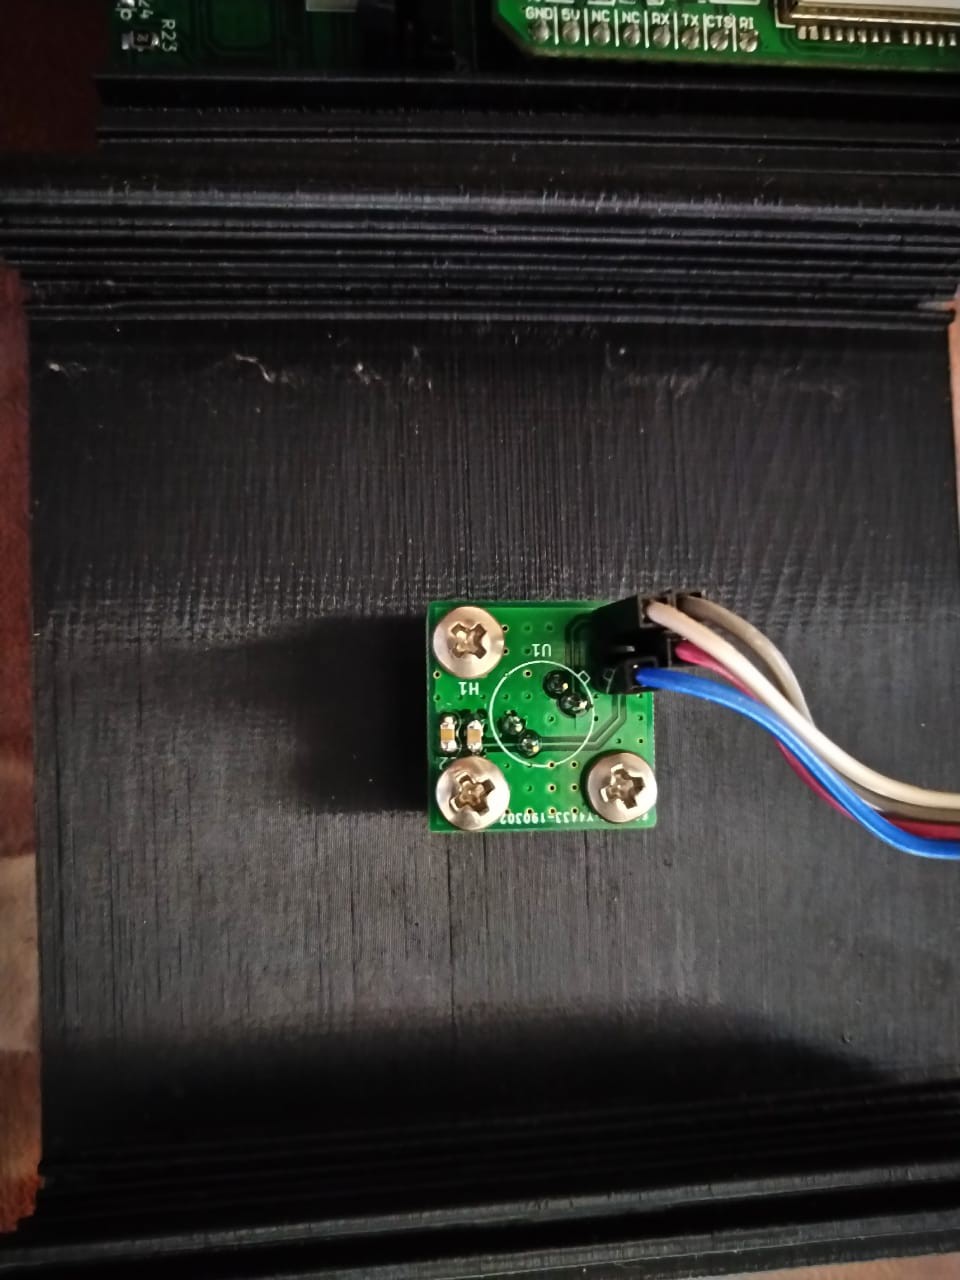
- Prototype assembly
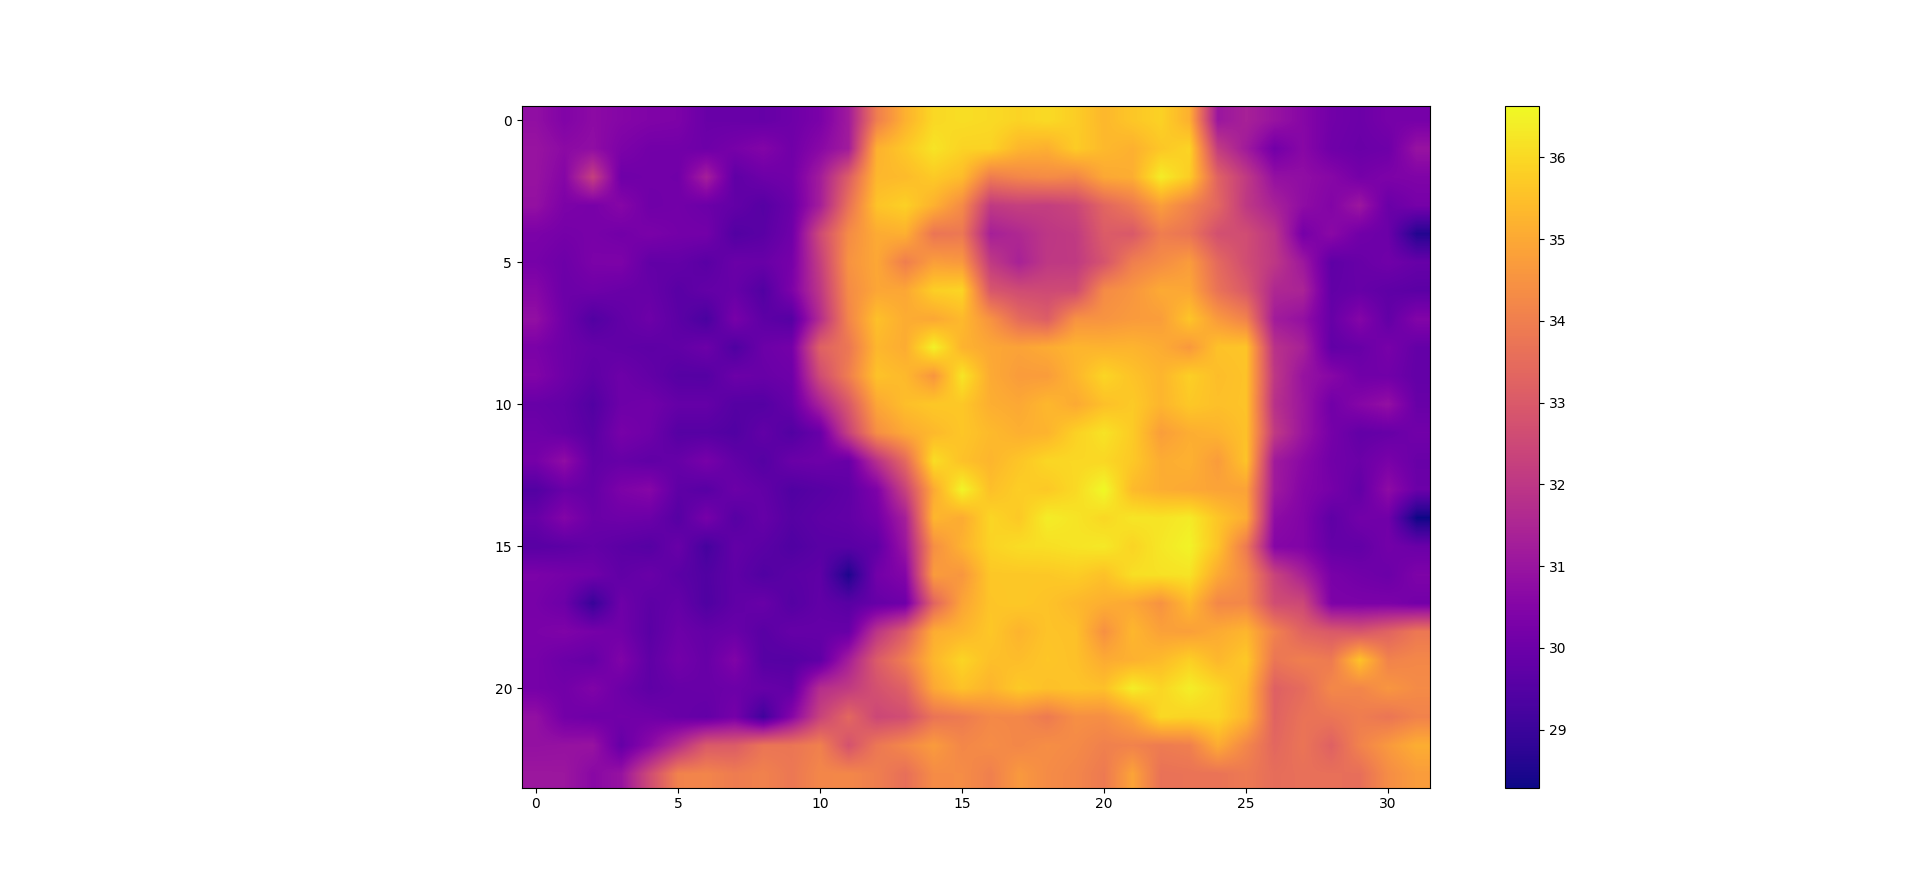
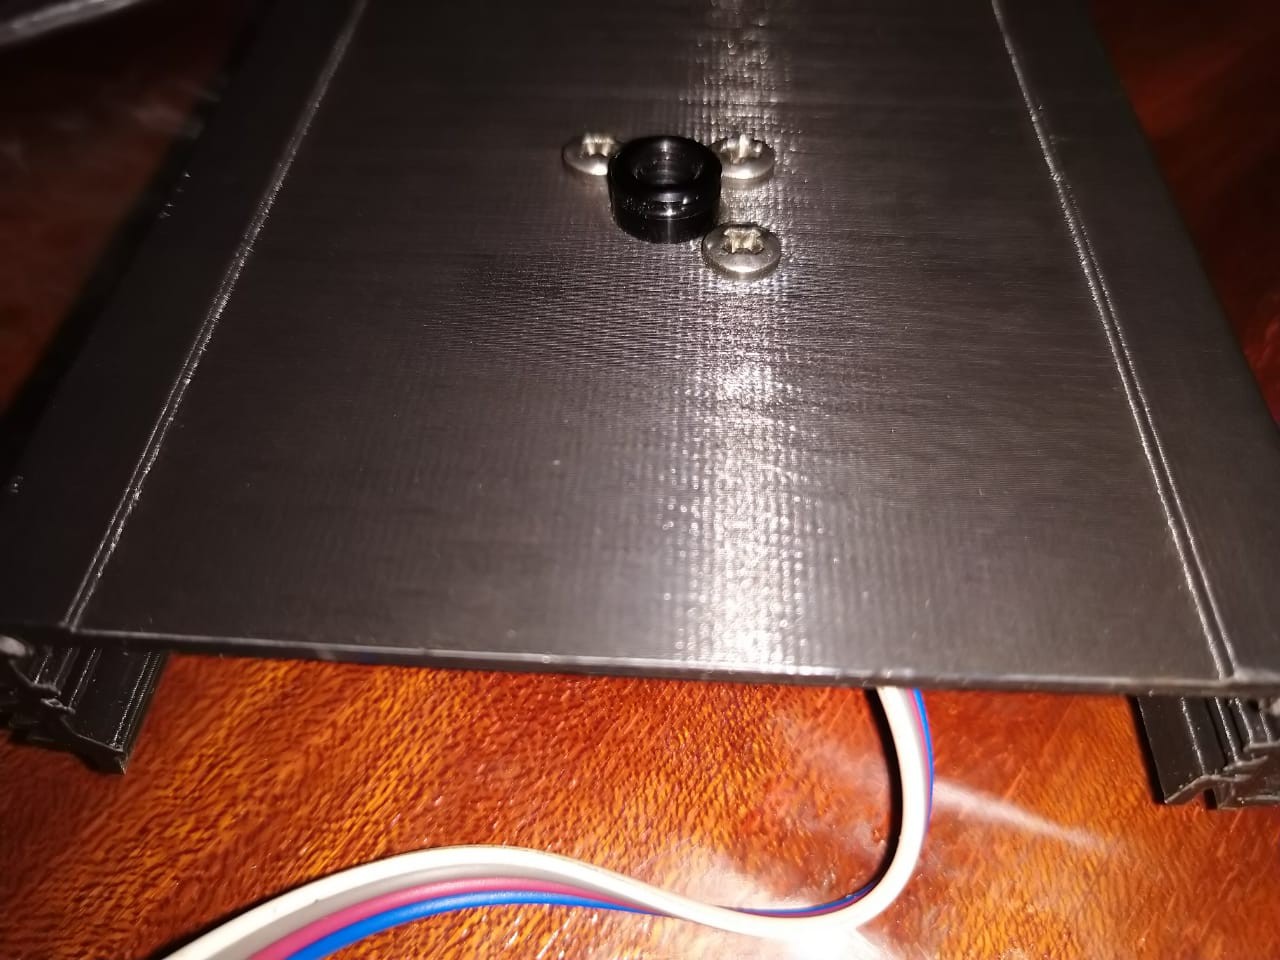
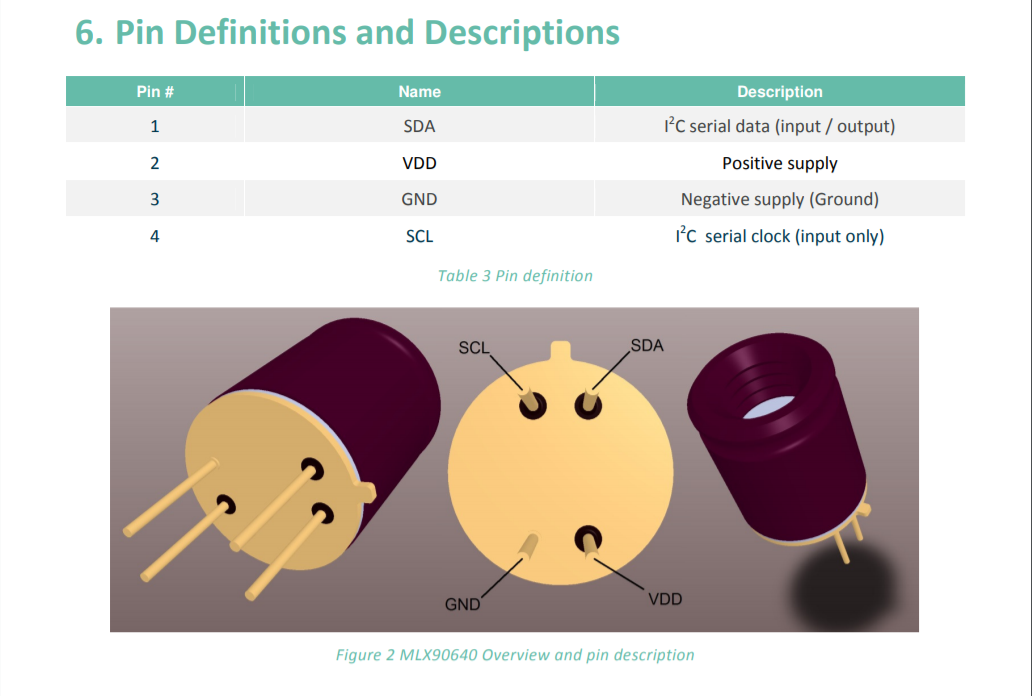
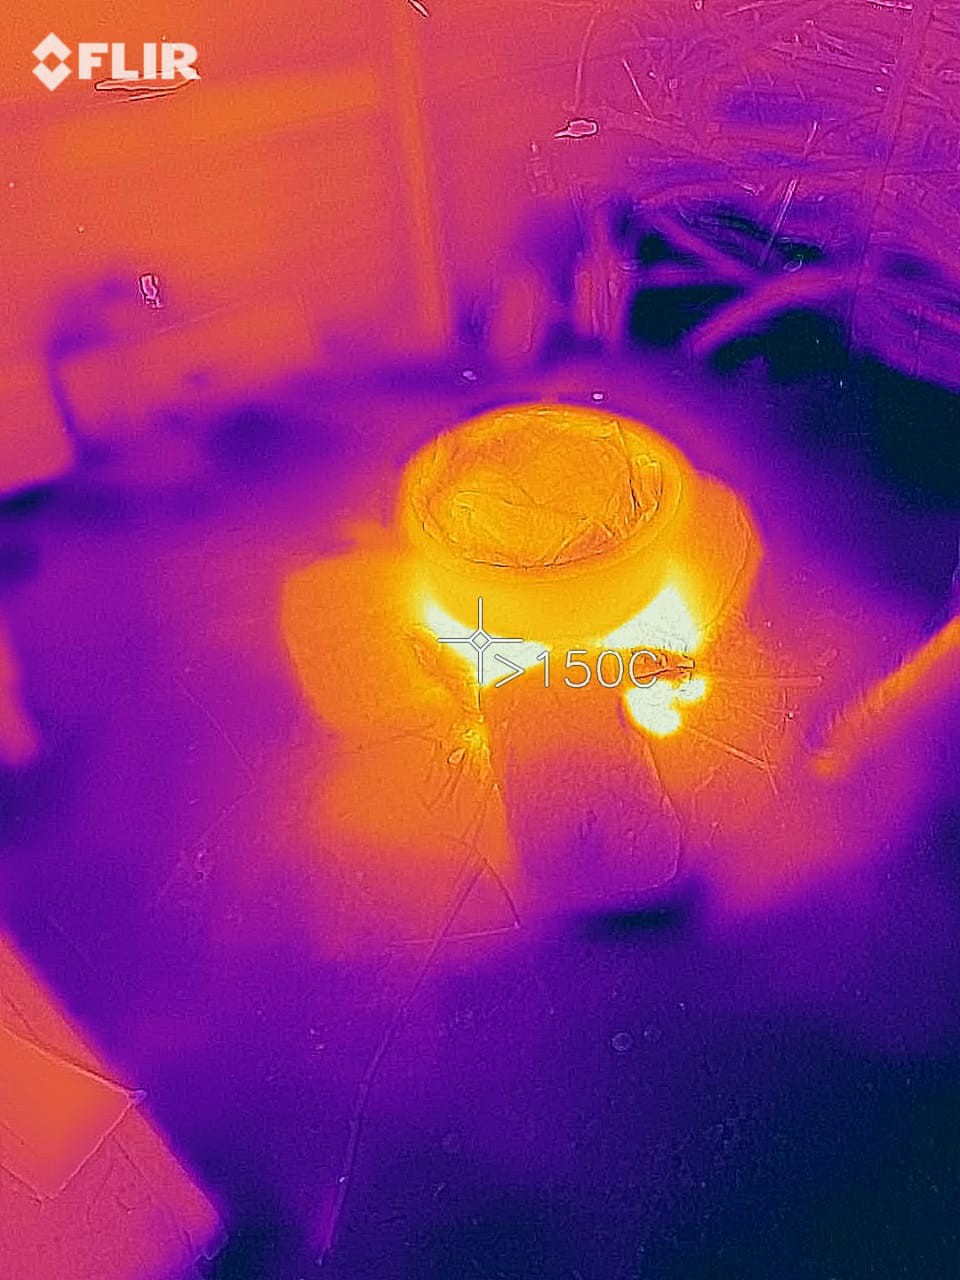
- Testing the thermal image sensor
- Choosing the embedded web server stack
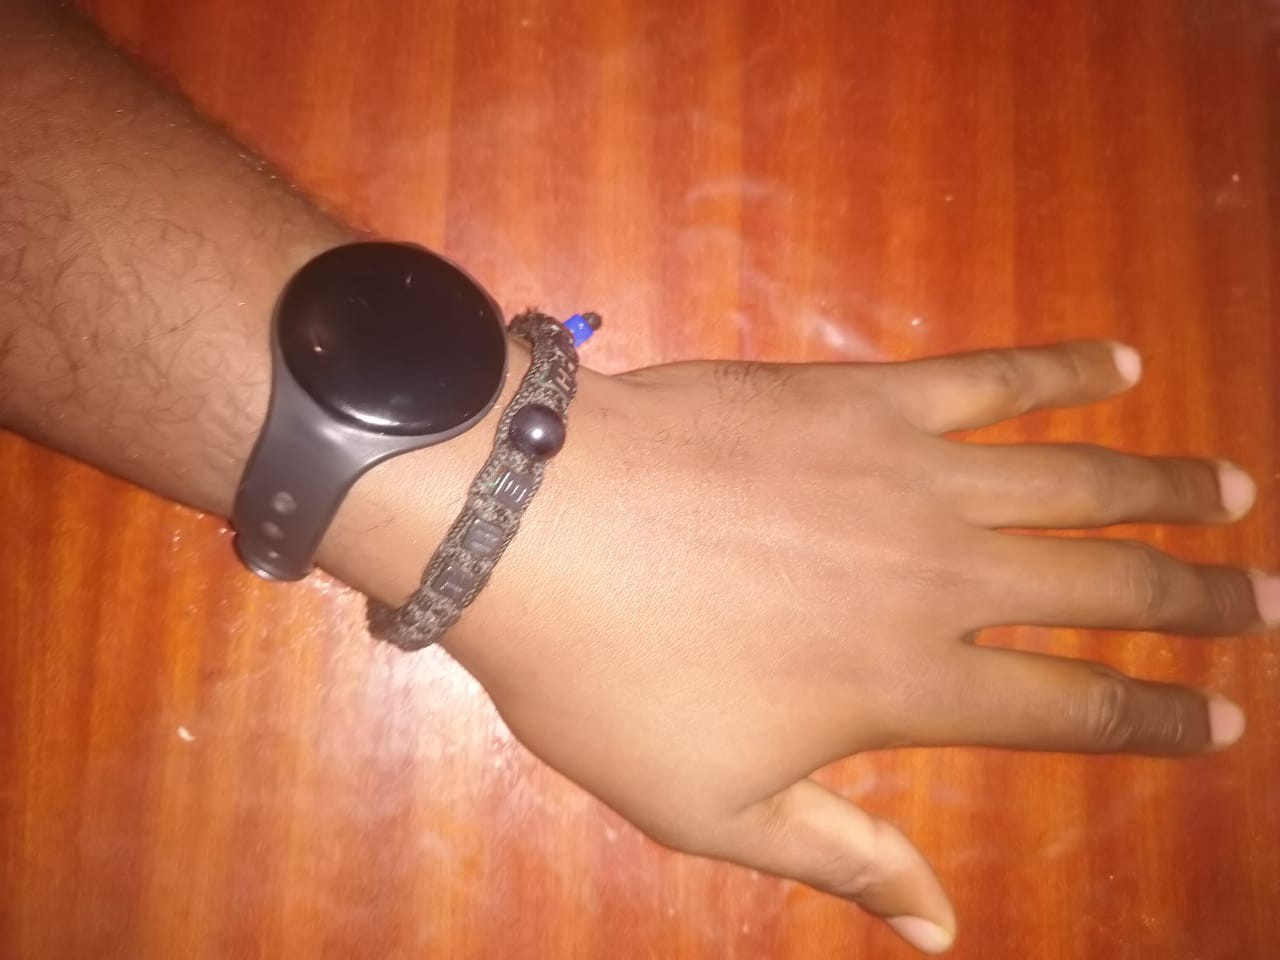
- Configuring the handheld wrist beacon for activity sensing.
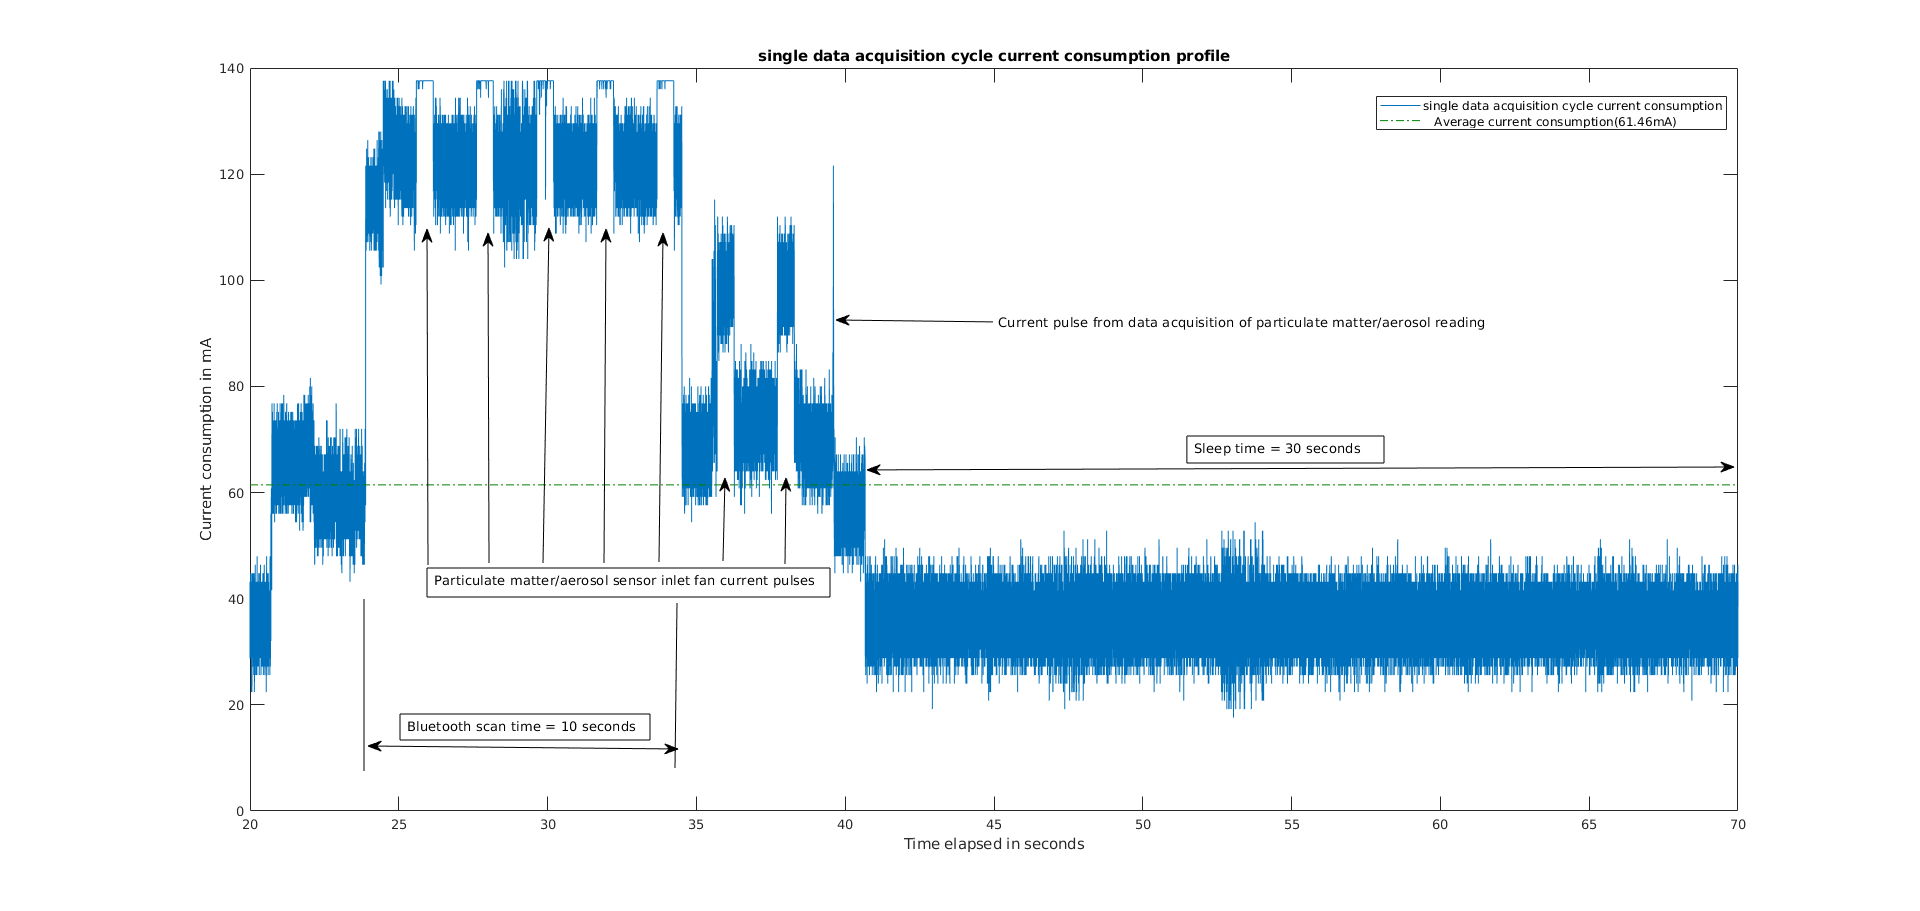
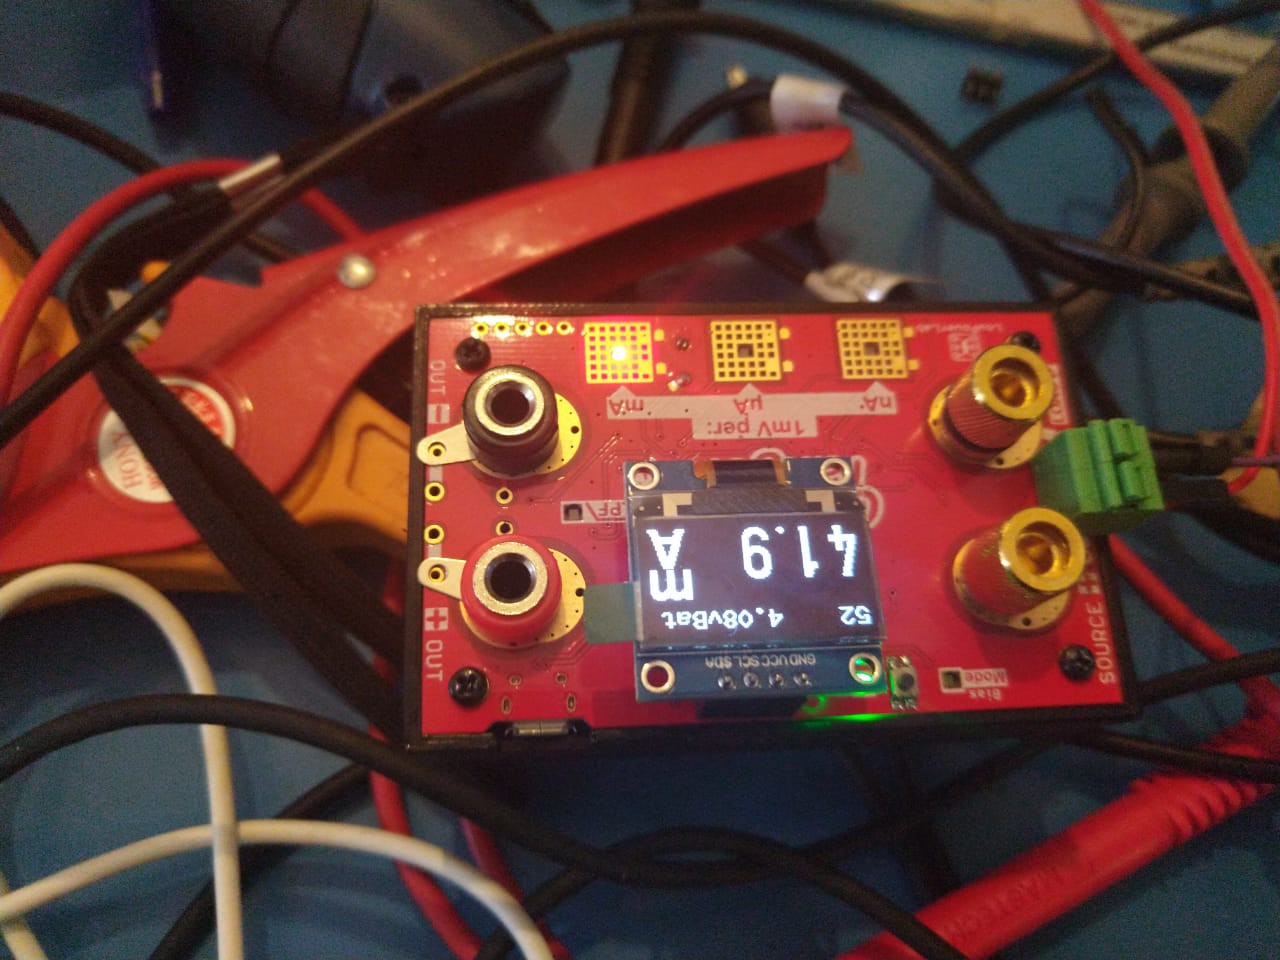
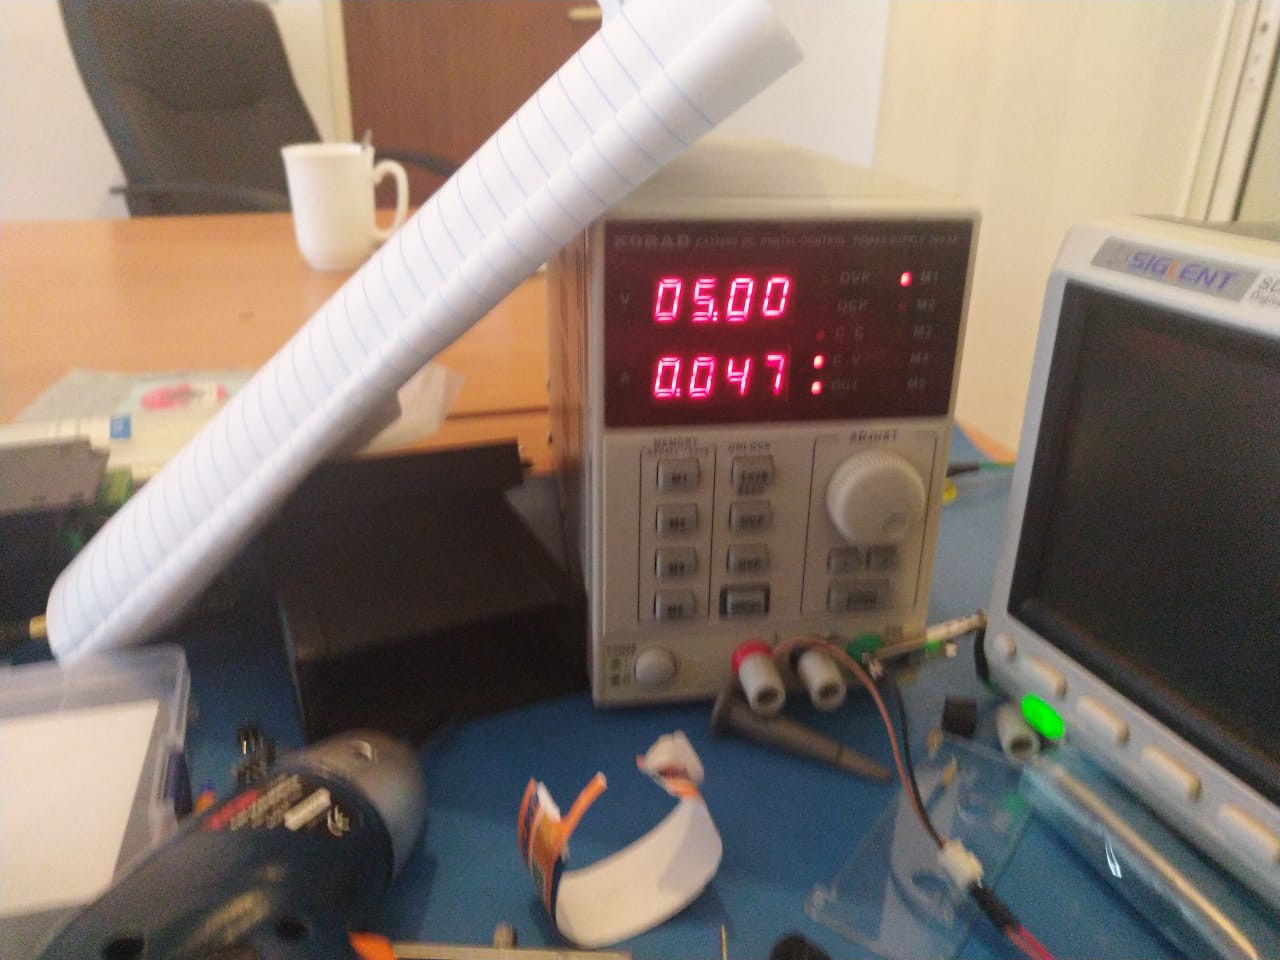
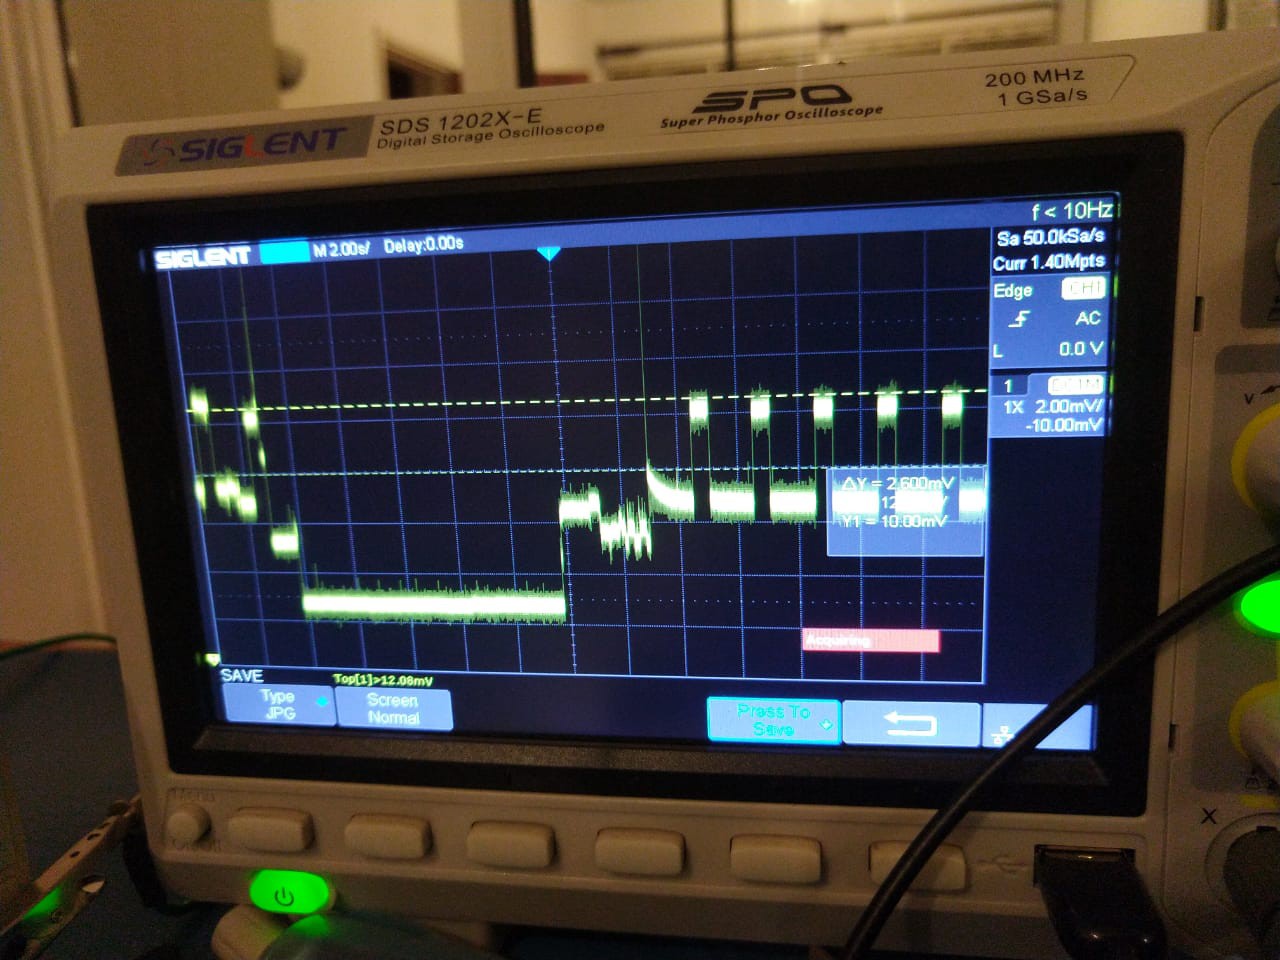
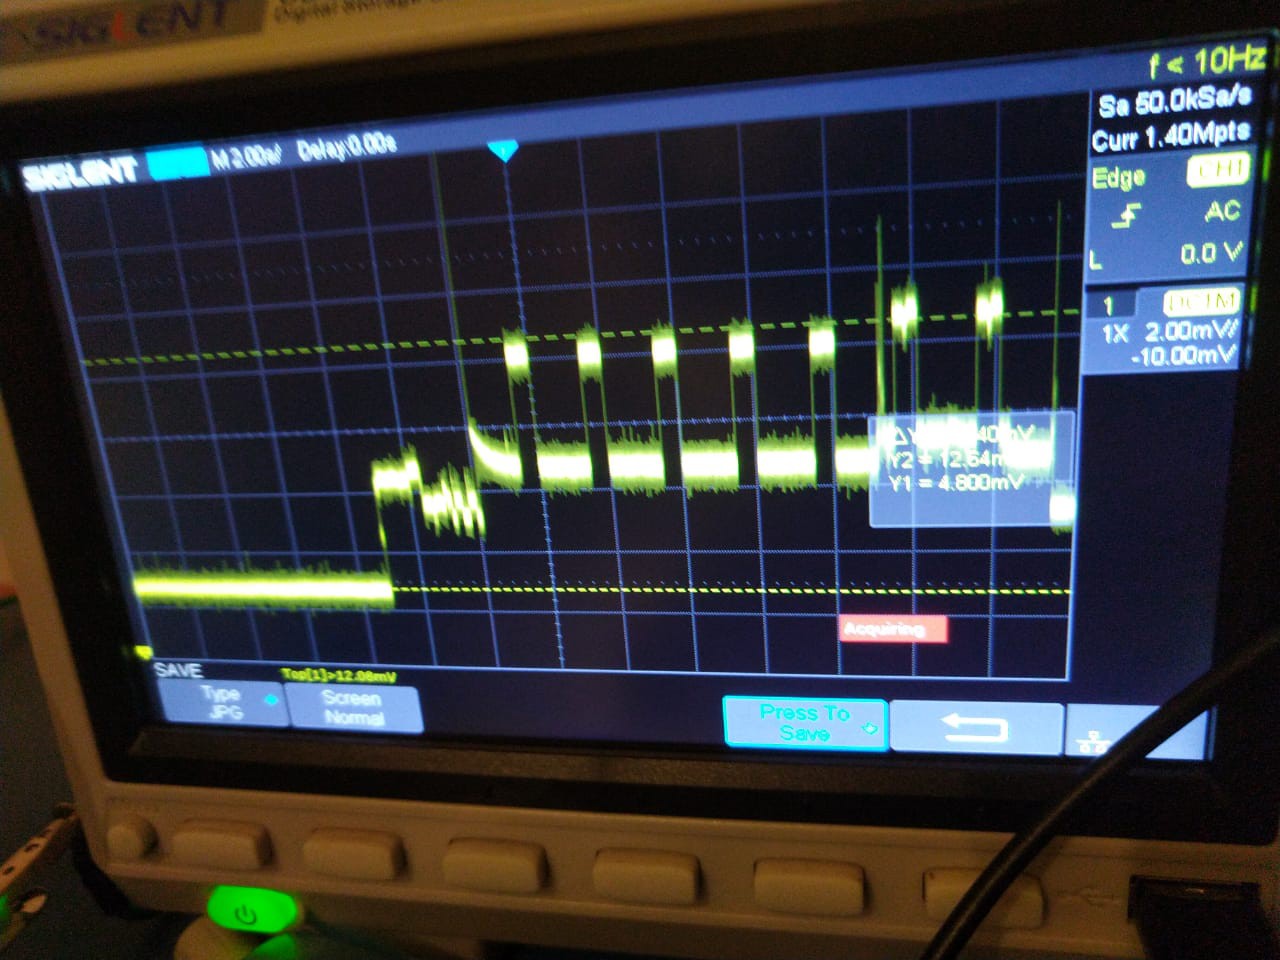
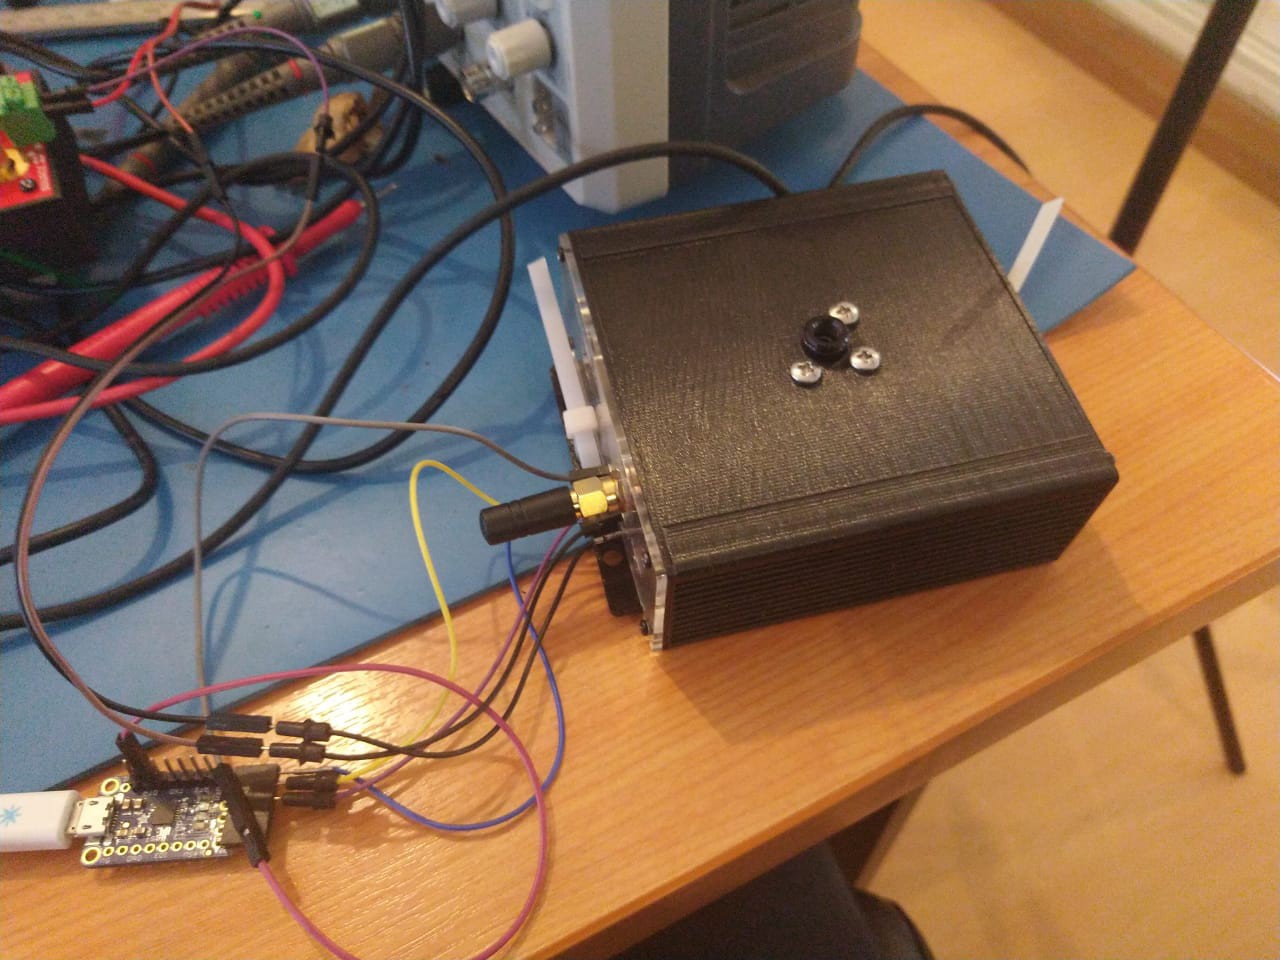
- Measuring power consumption of a single data acquisition cycle
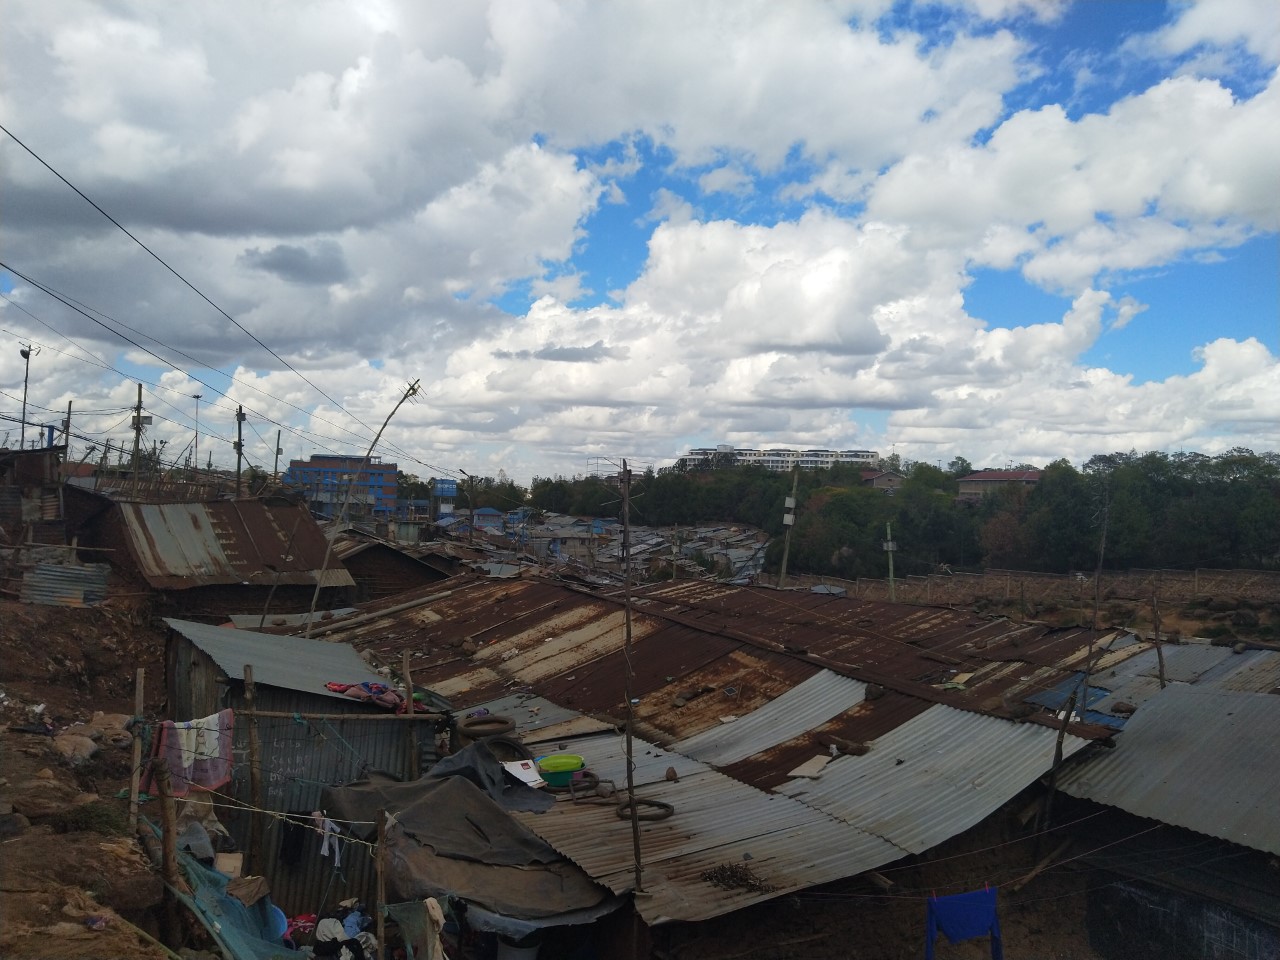
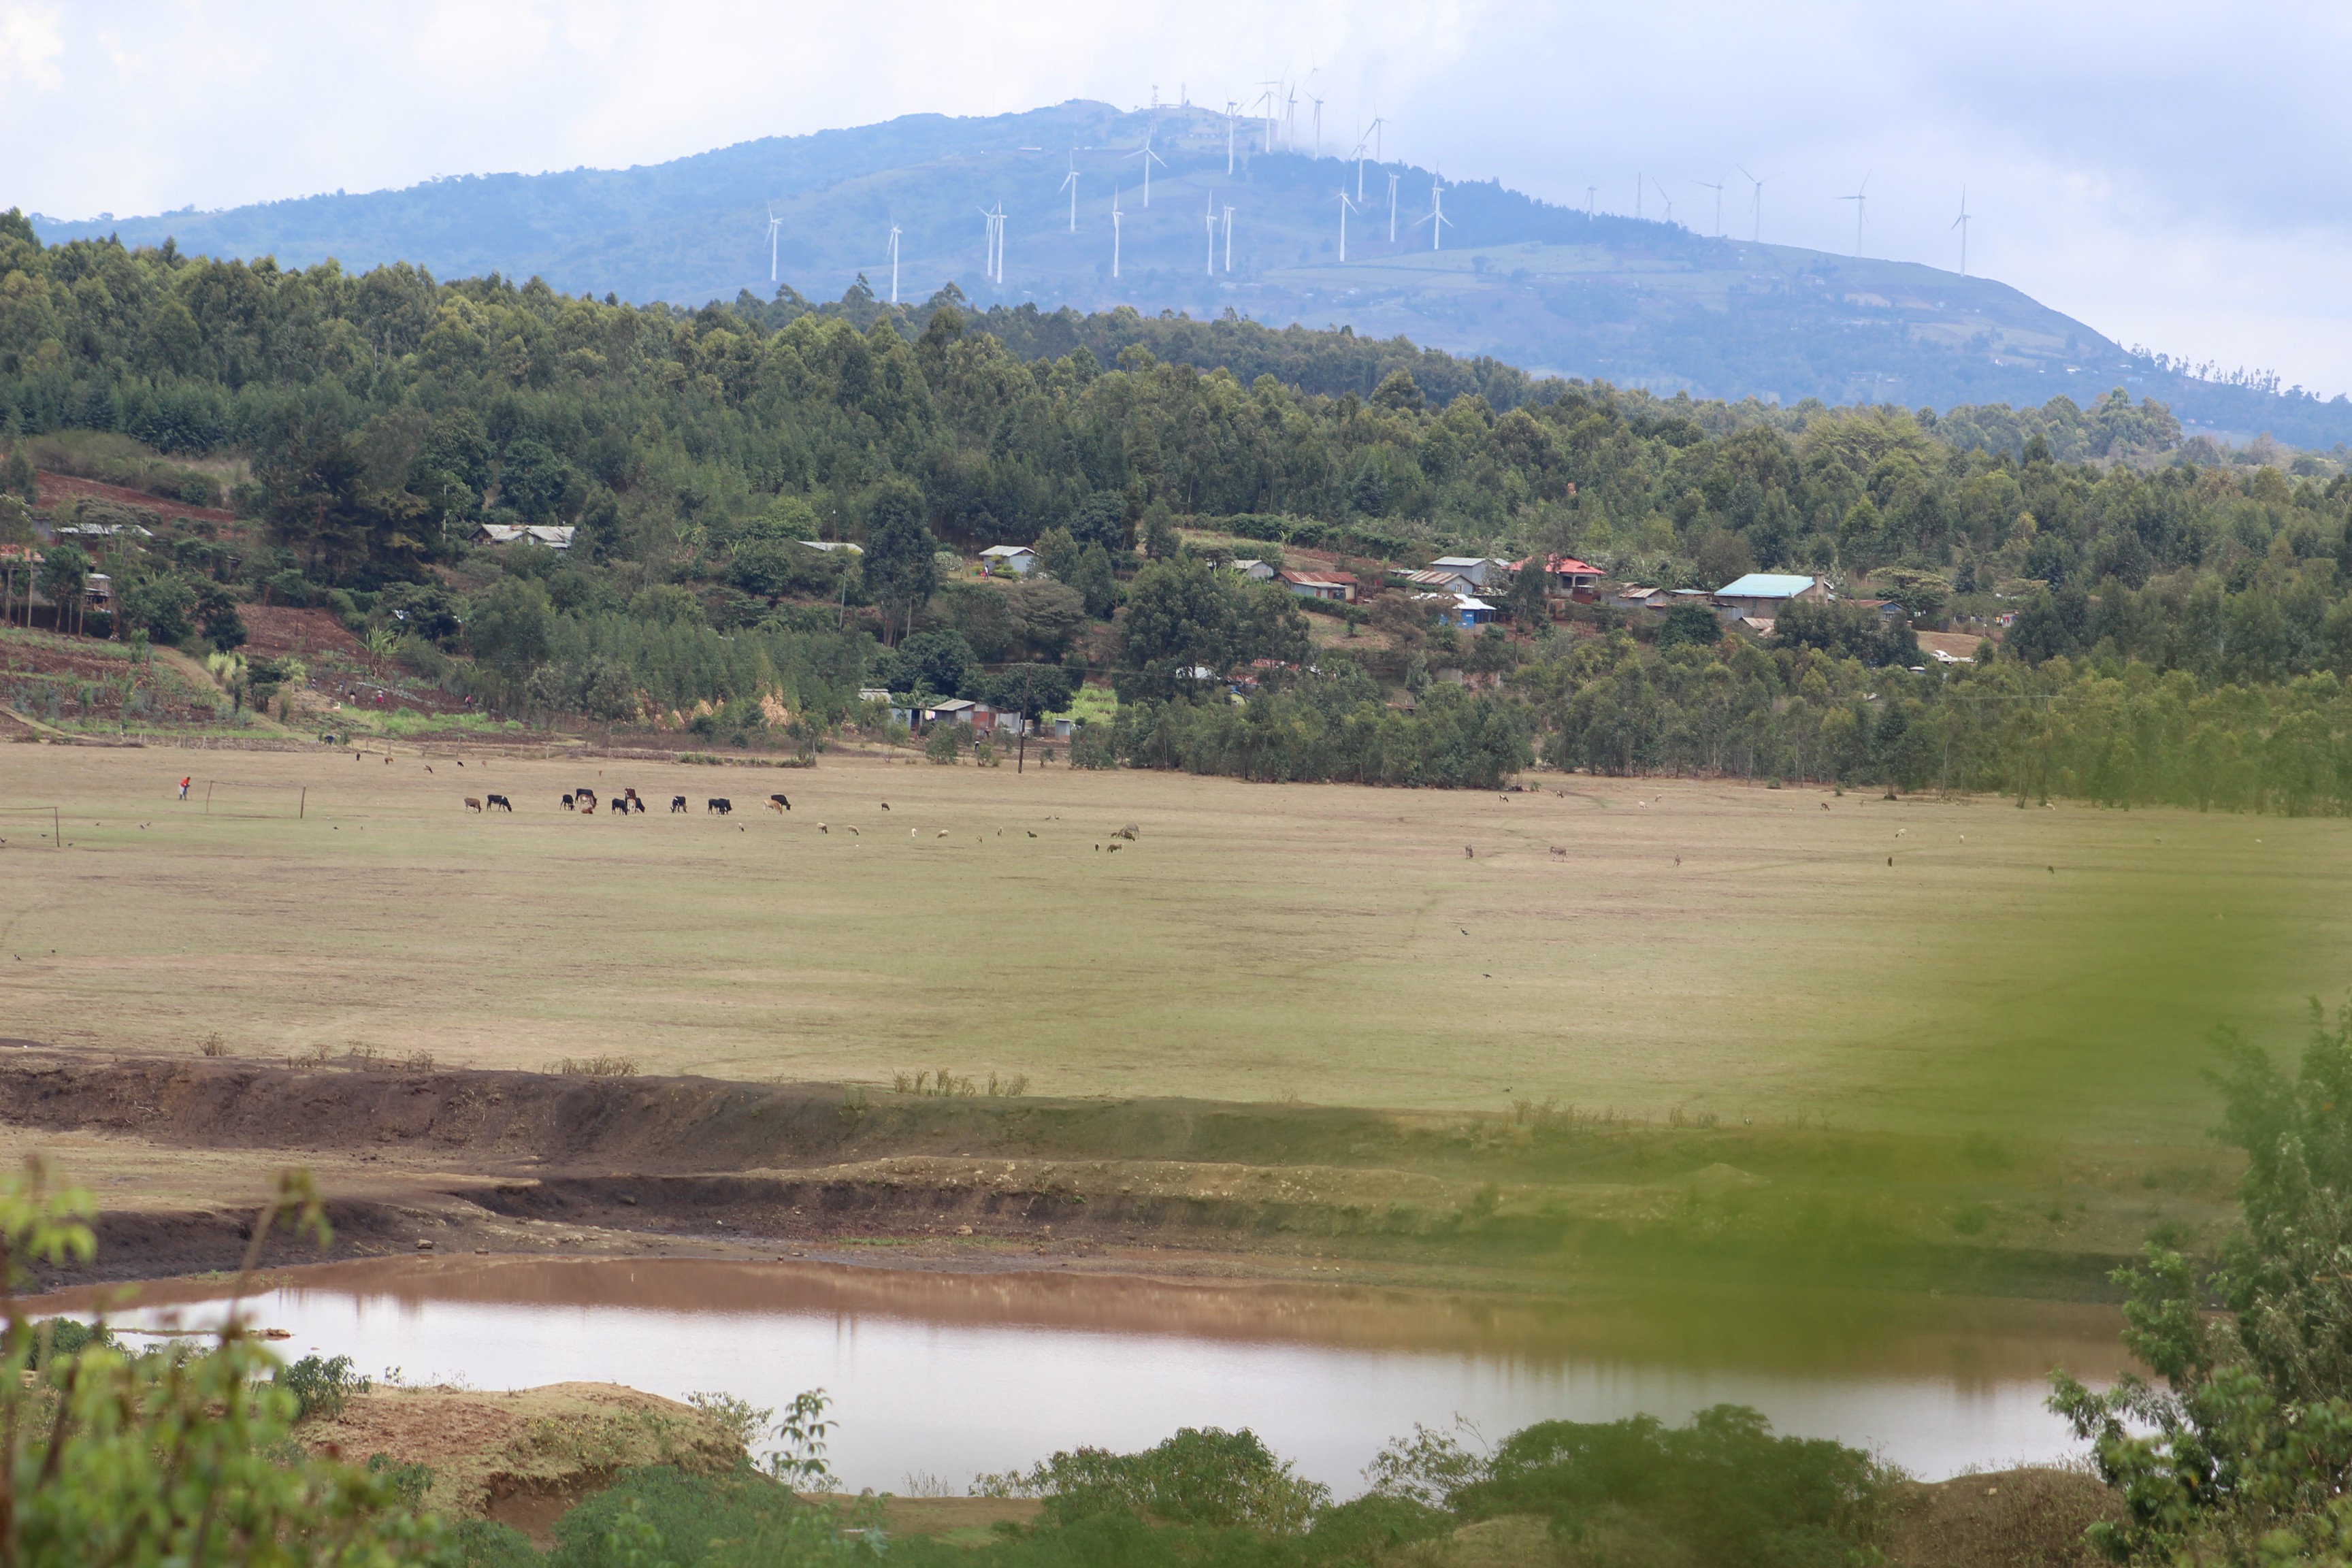
- Real world test - Rural Kenya - Copy of first log
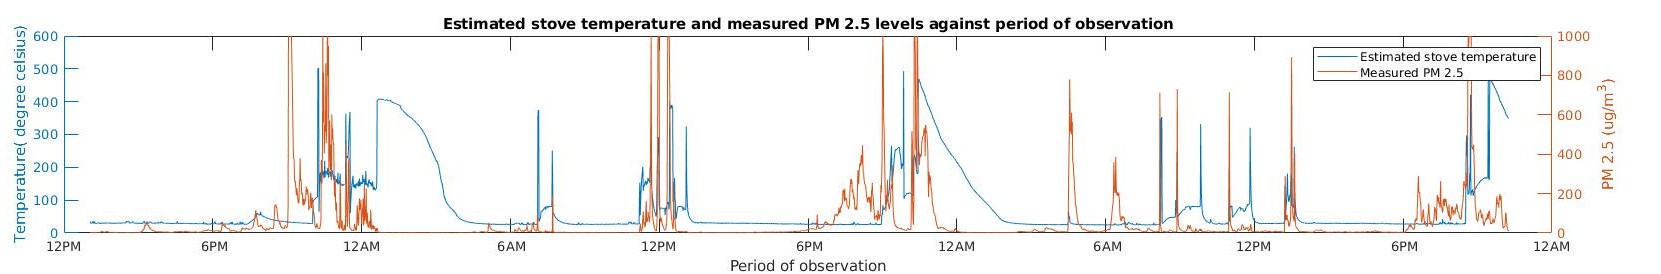
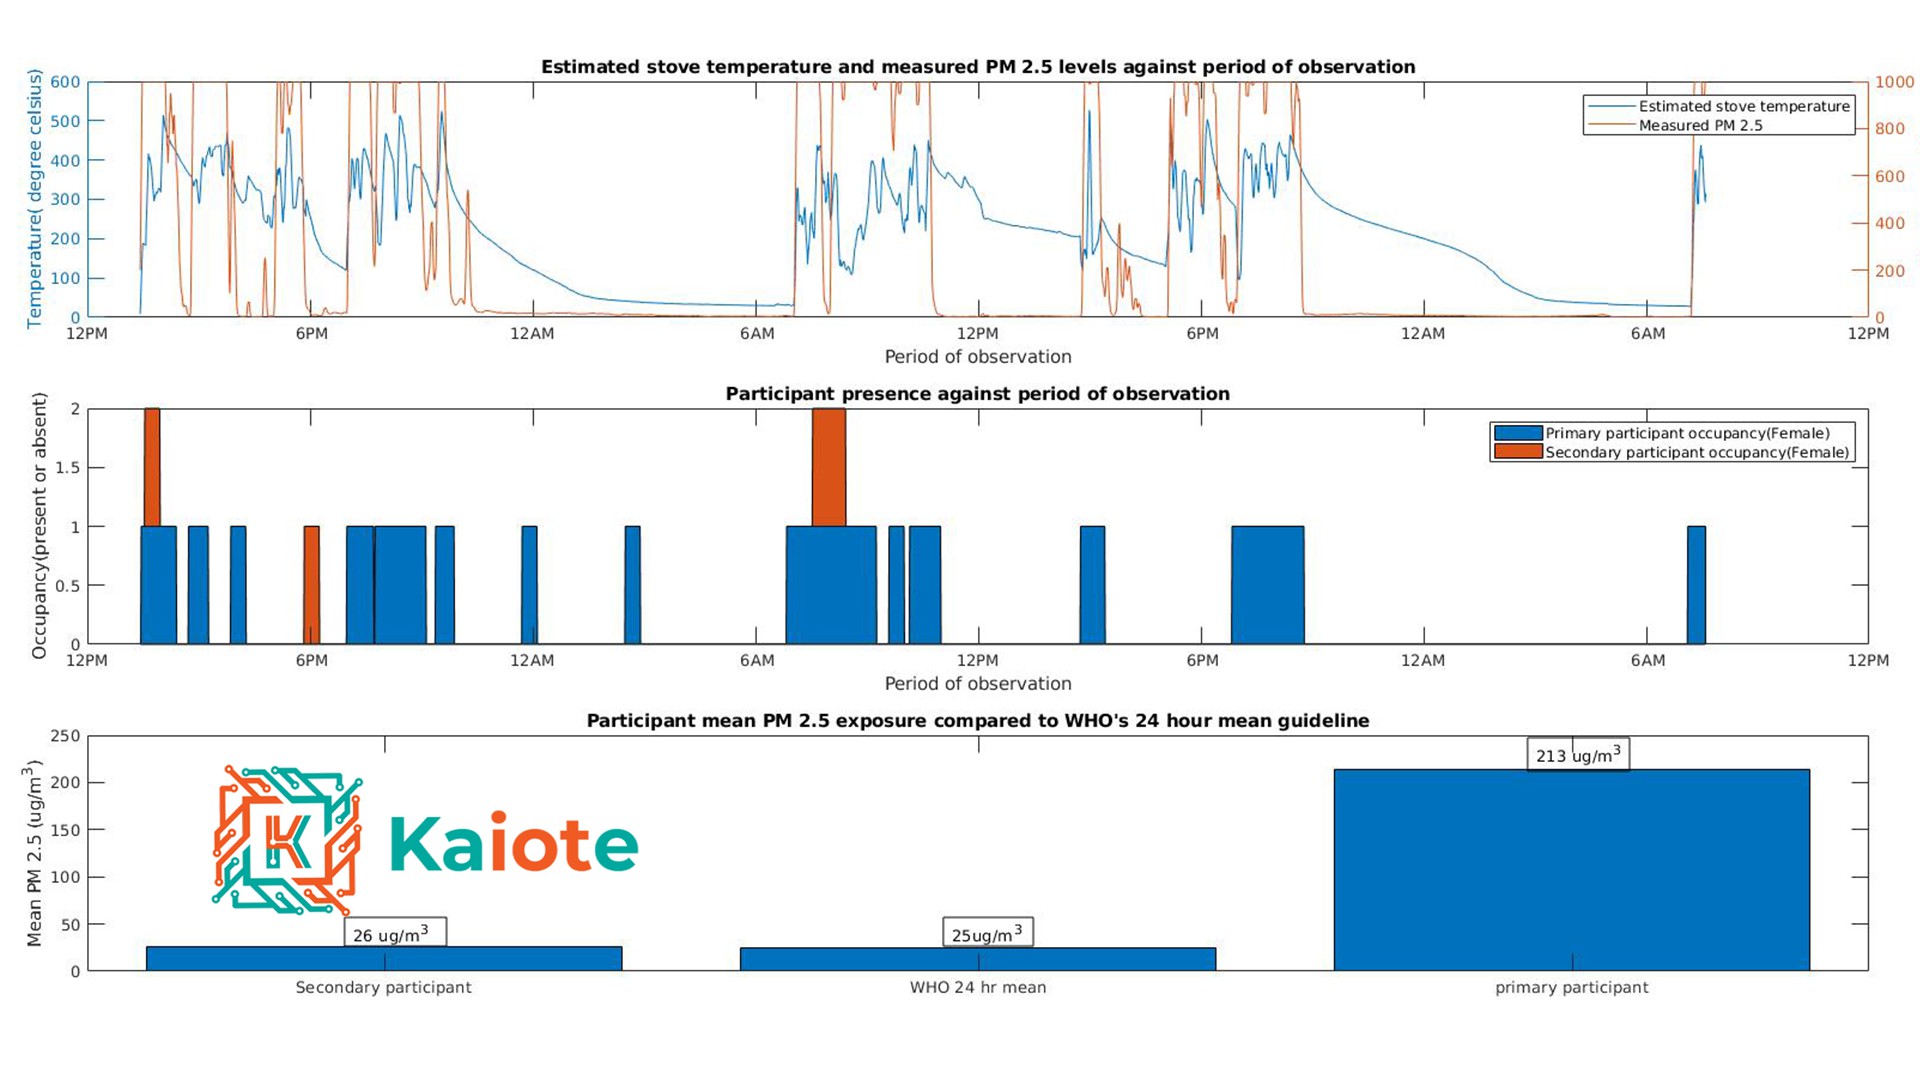
- Real world test - Urban low income - A family of four - Must read
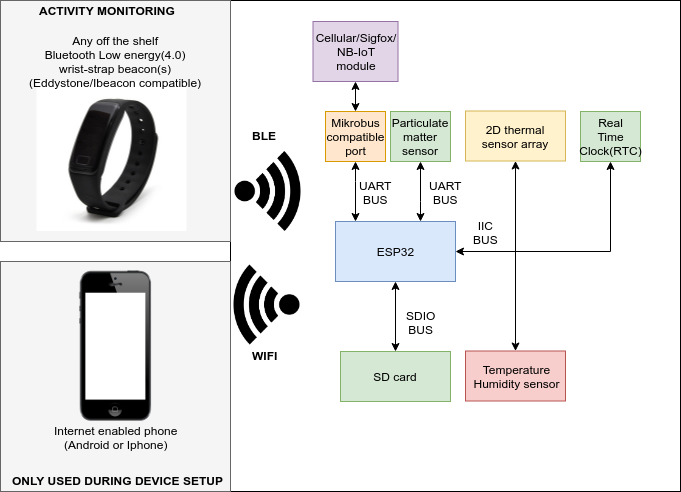
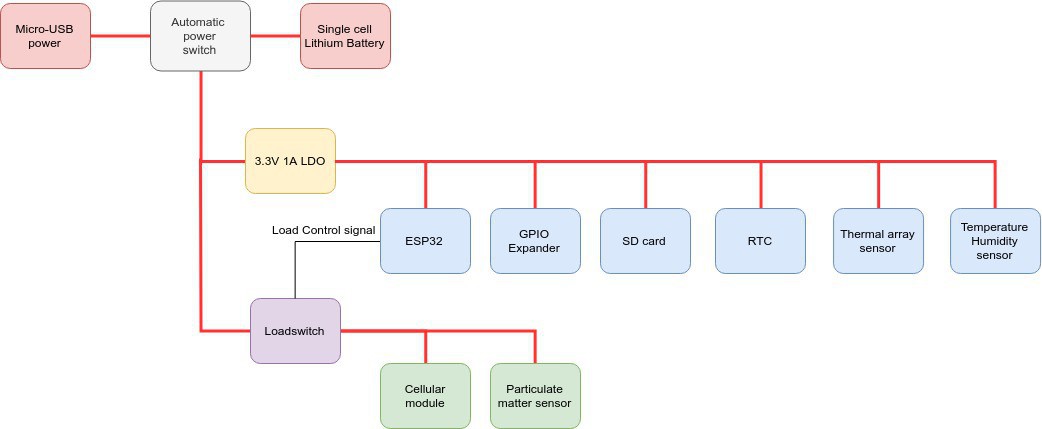
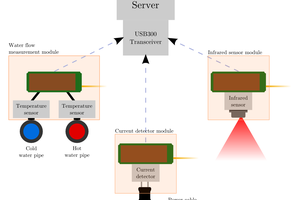
OpenHAP block diagram

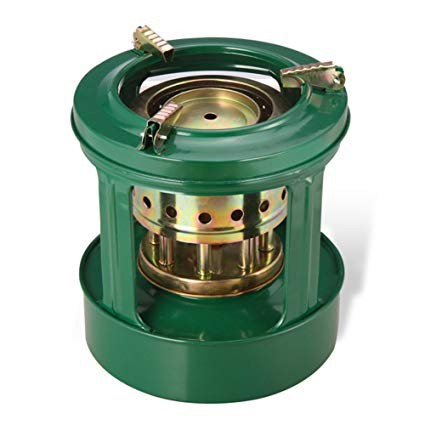
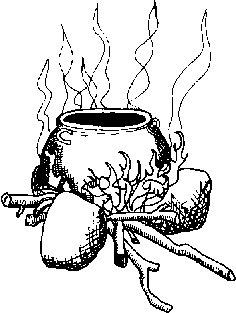
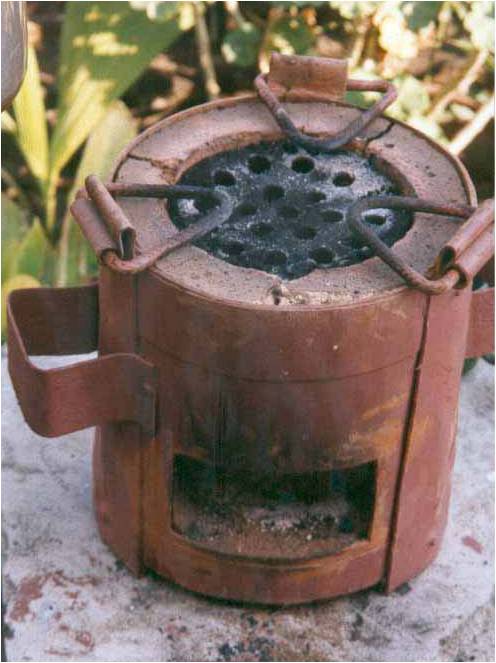 A sample briquette stove
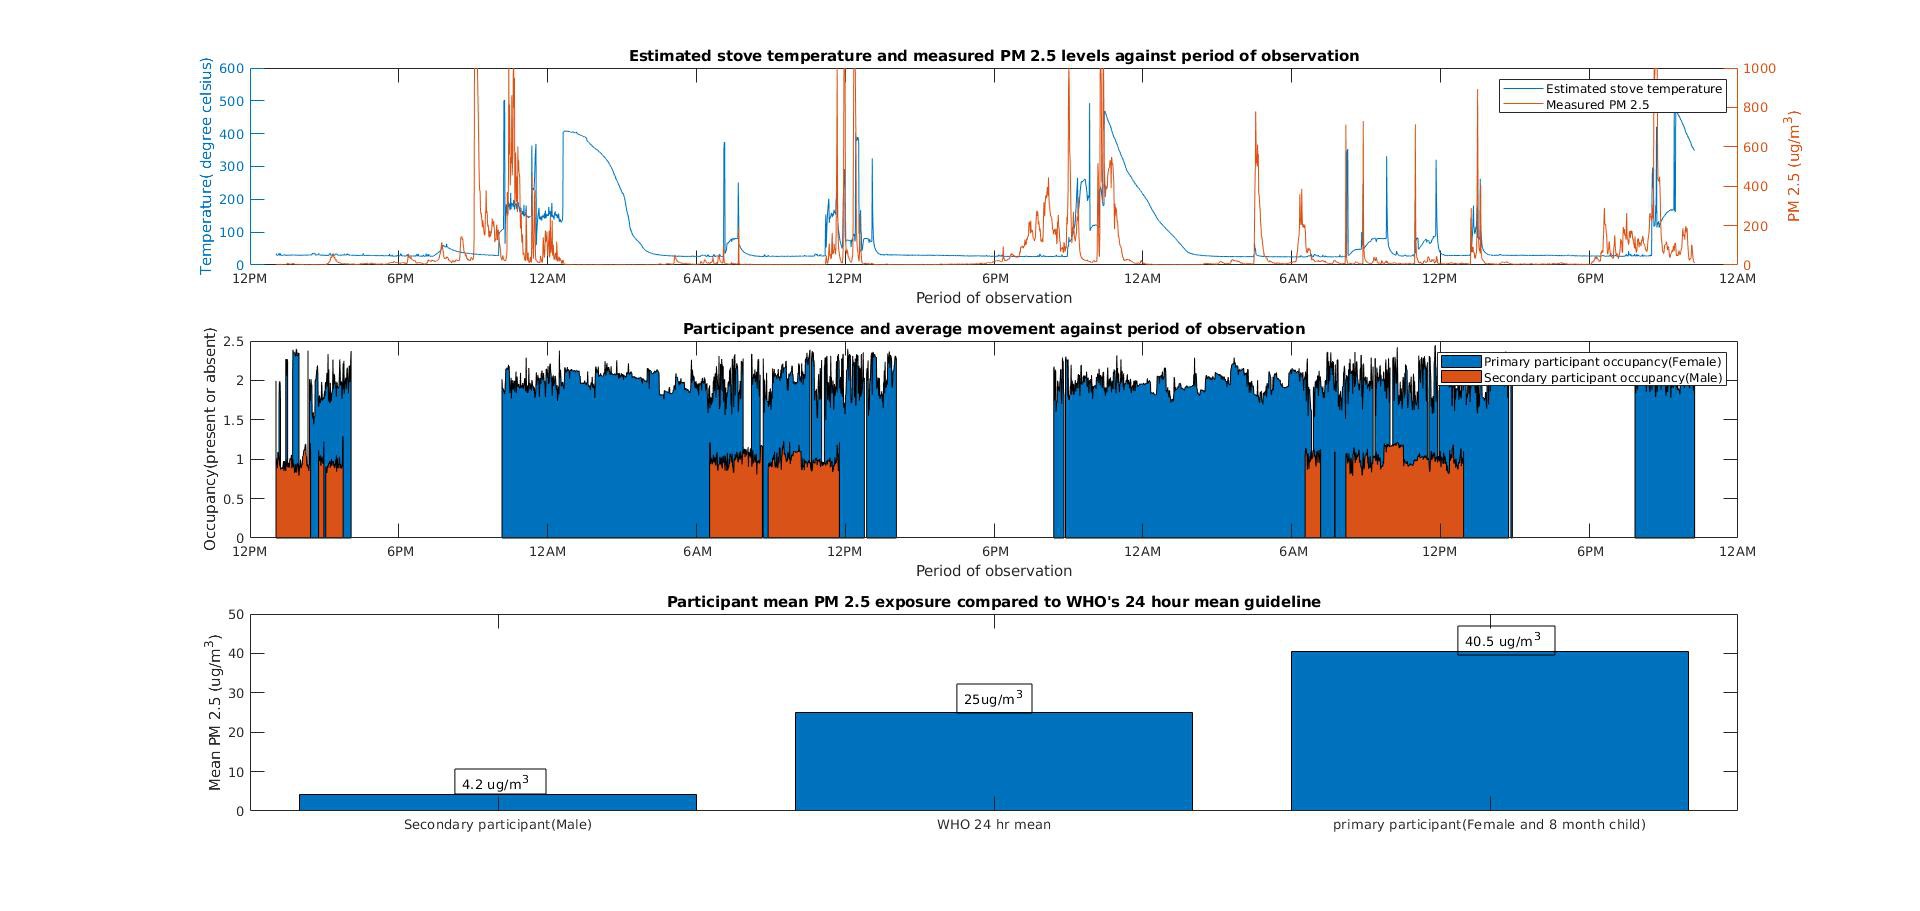


 karpour
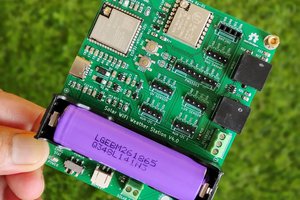
 Open Green Energy
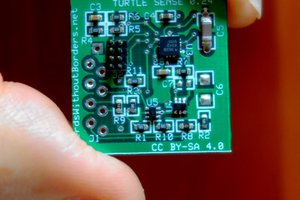
 Samuel Wantman
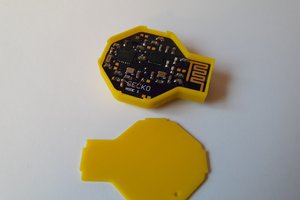
 Max.K
Max.K
Yes. This problem is not regional but global.
In Africa people have own ppm and in NY they have own... But ppm are the same, kill us in the same way.
Of course, we can find out how bad situation is. What if we do not have time for after actions?! What about try to resolve problems before?... So at least we need much better stoves, now!
In Europe, for example, we have ridiculous situation. The smog eats us day by day. We have better and better monitoring systems but still nobody cares how to effectively reduce pollution sources. A typical, household "eco" stove costs thousands of euro... But we know how to make really eco stove for hundred bucks...
So problem is only in our mentality. We have tools but we do not have will.