 Guillermo Perez Guillen
How does my project works?
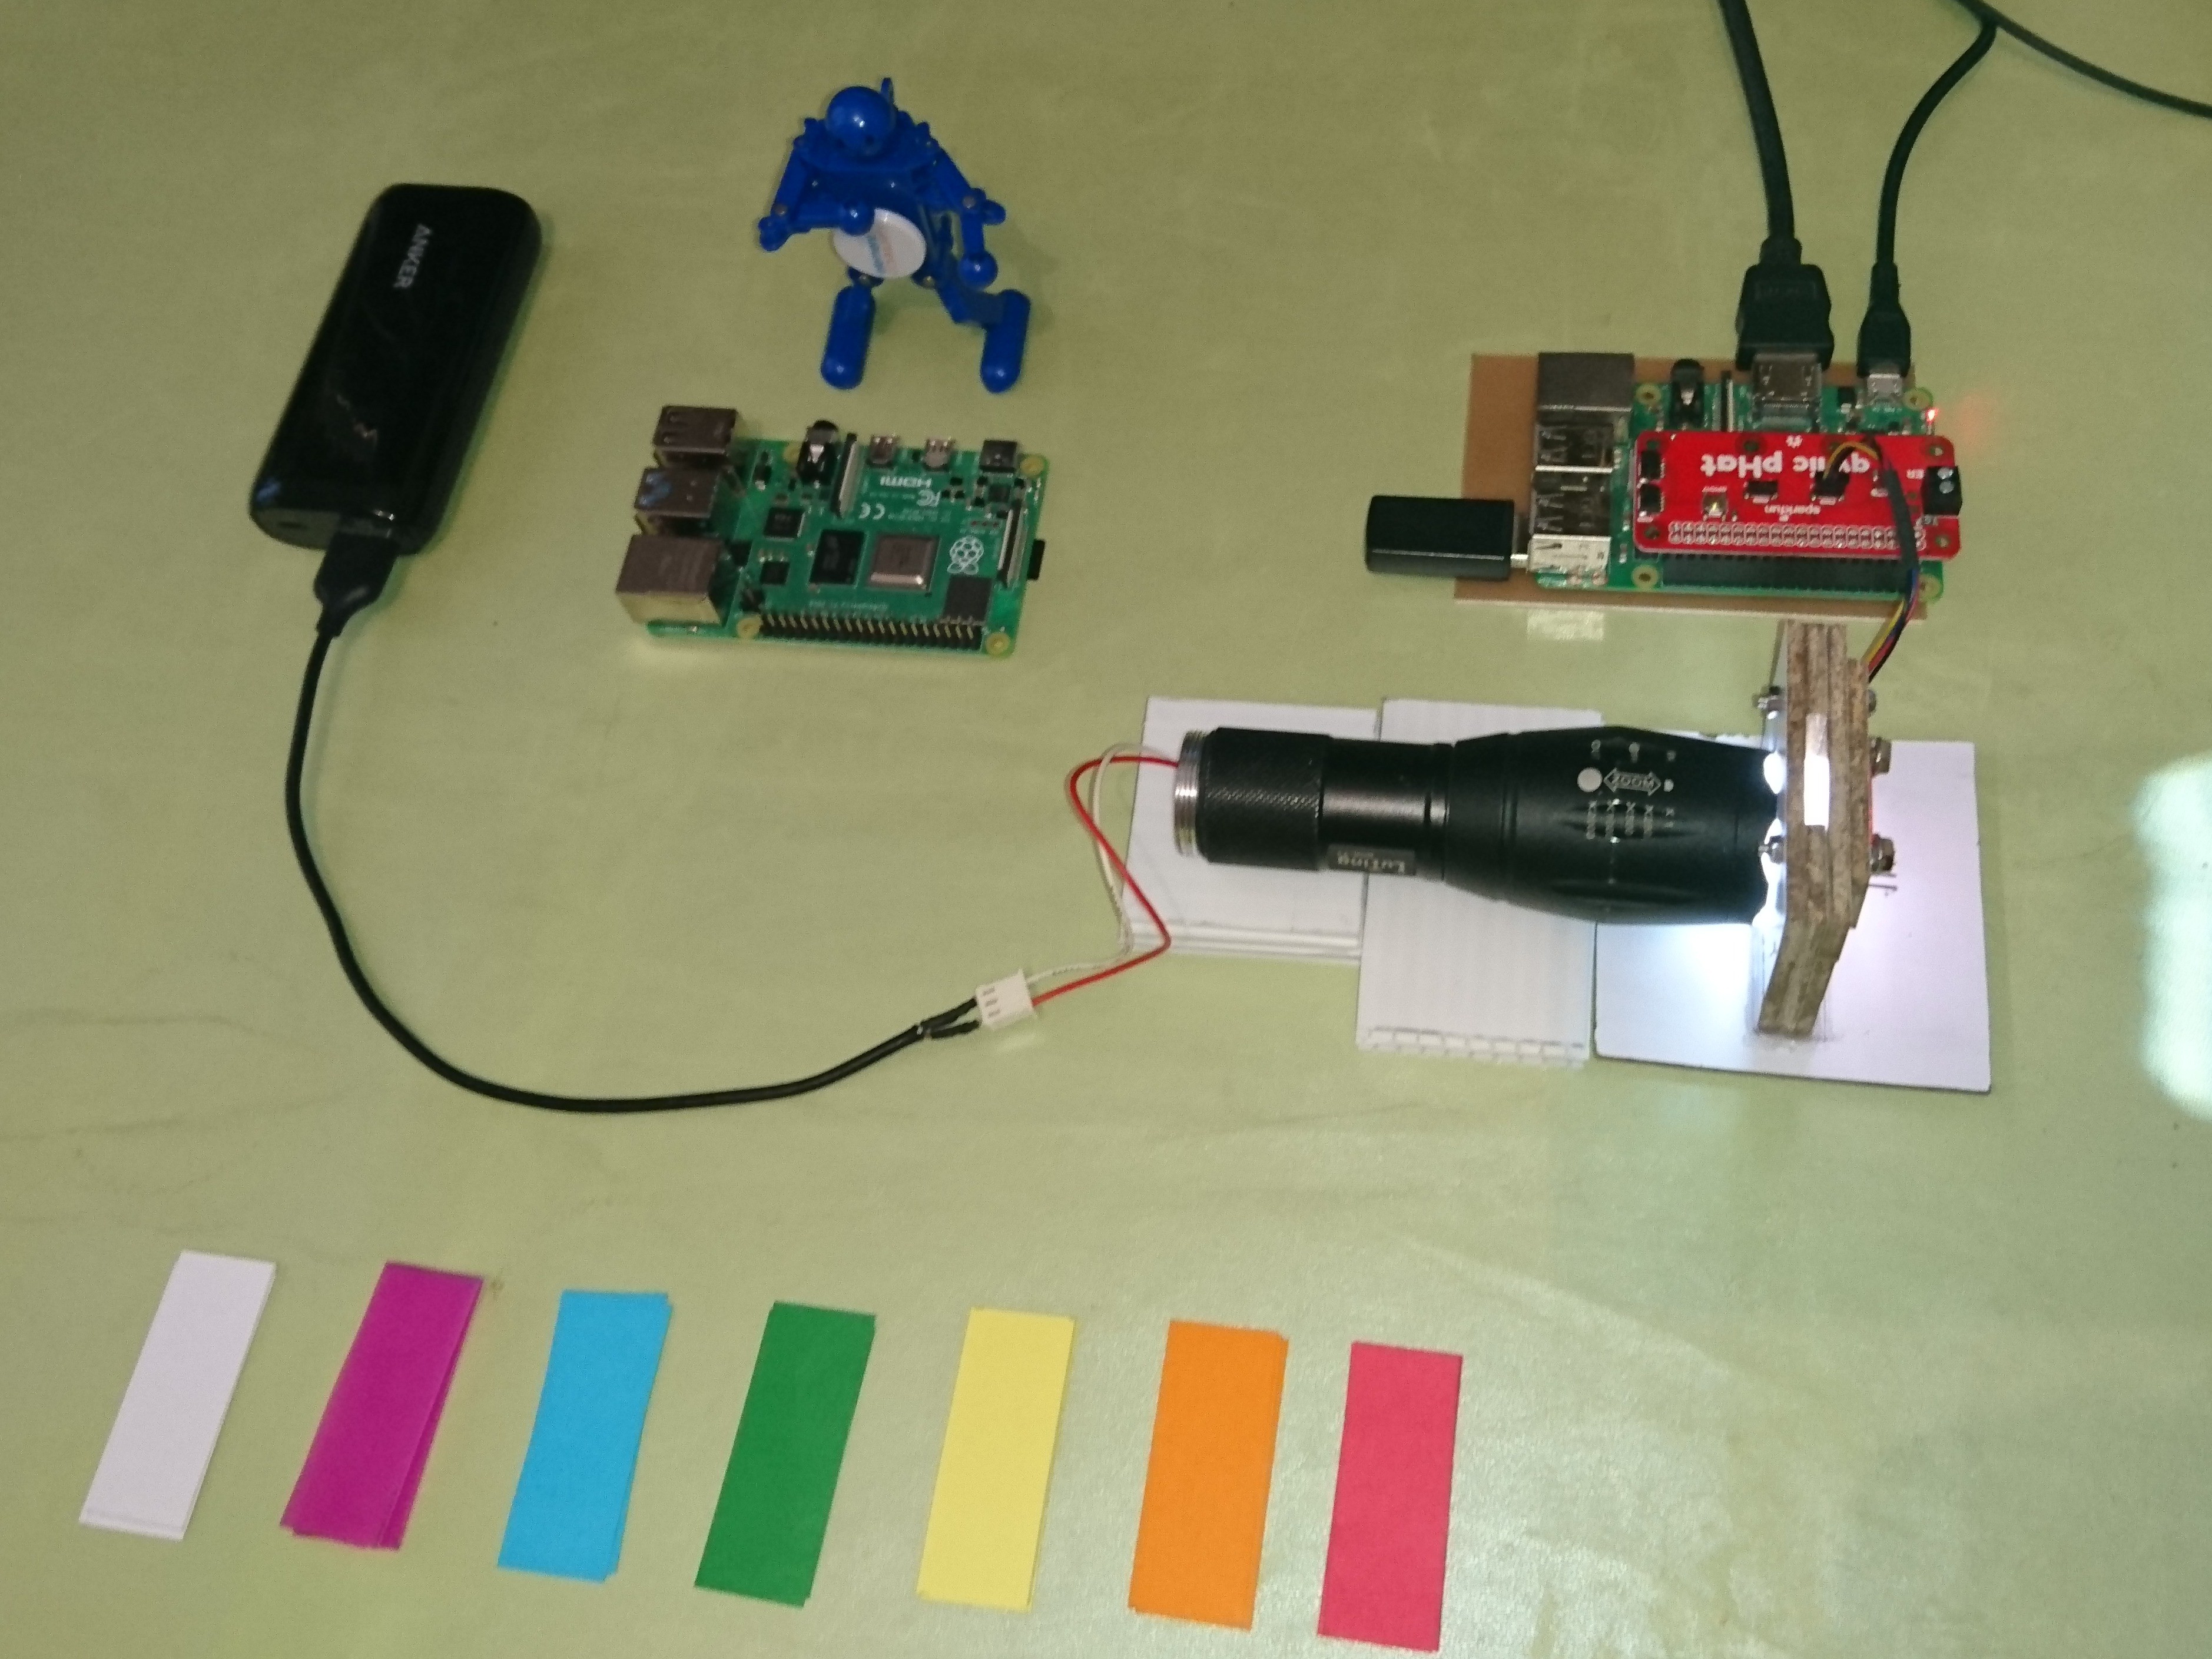
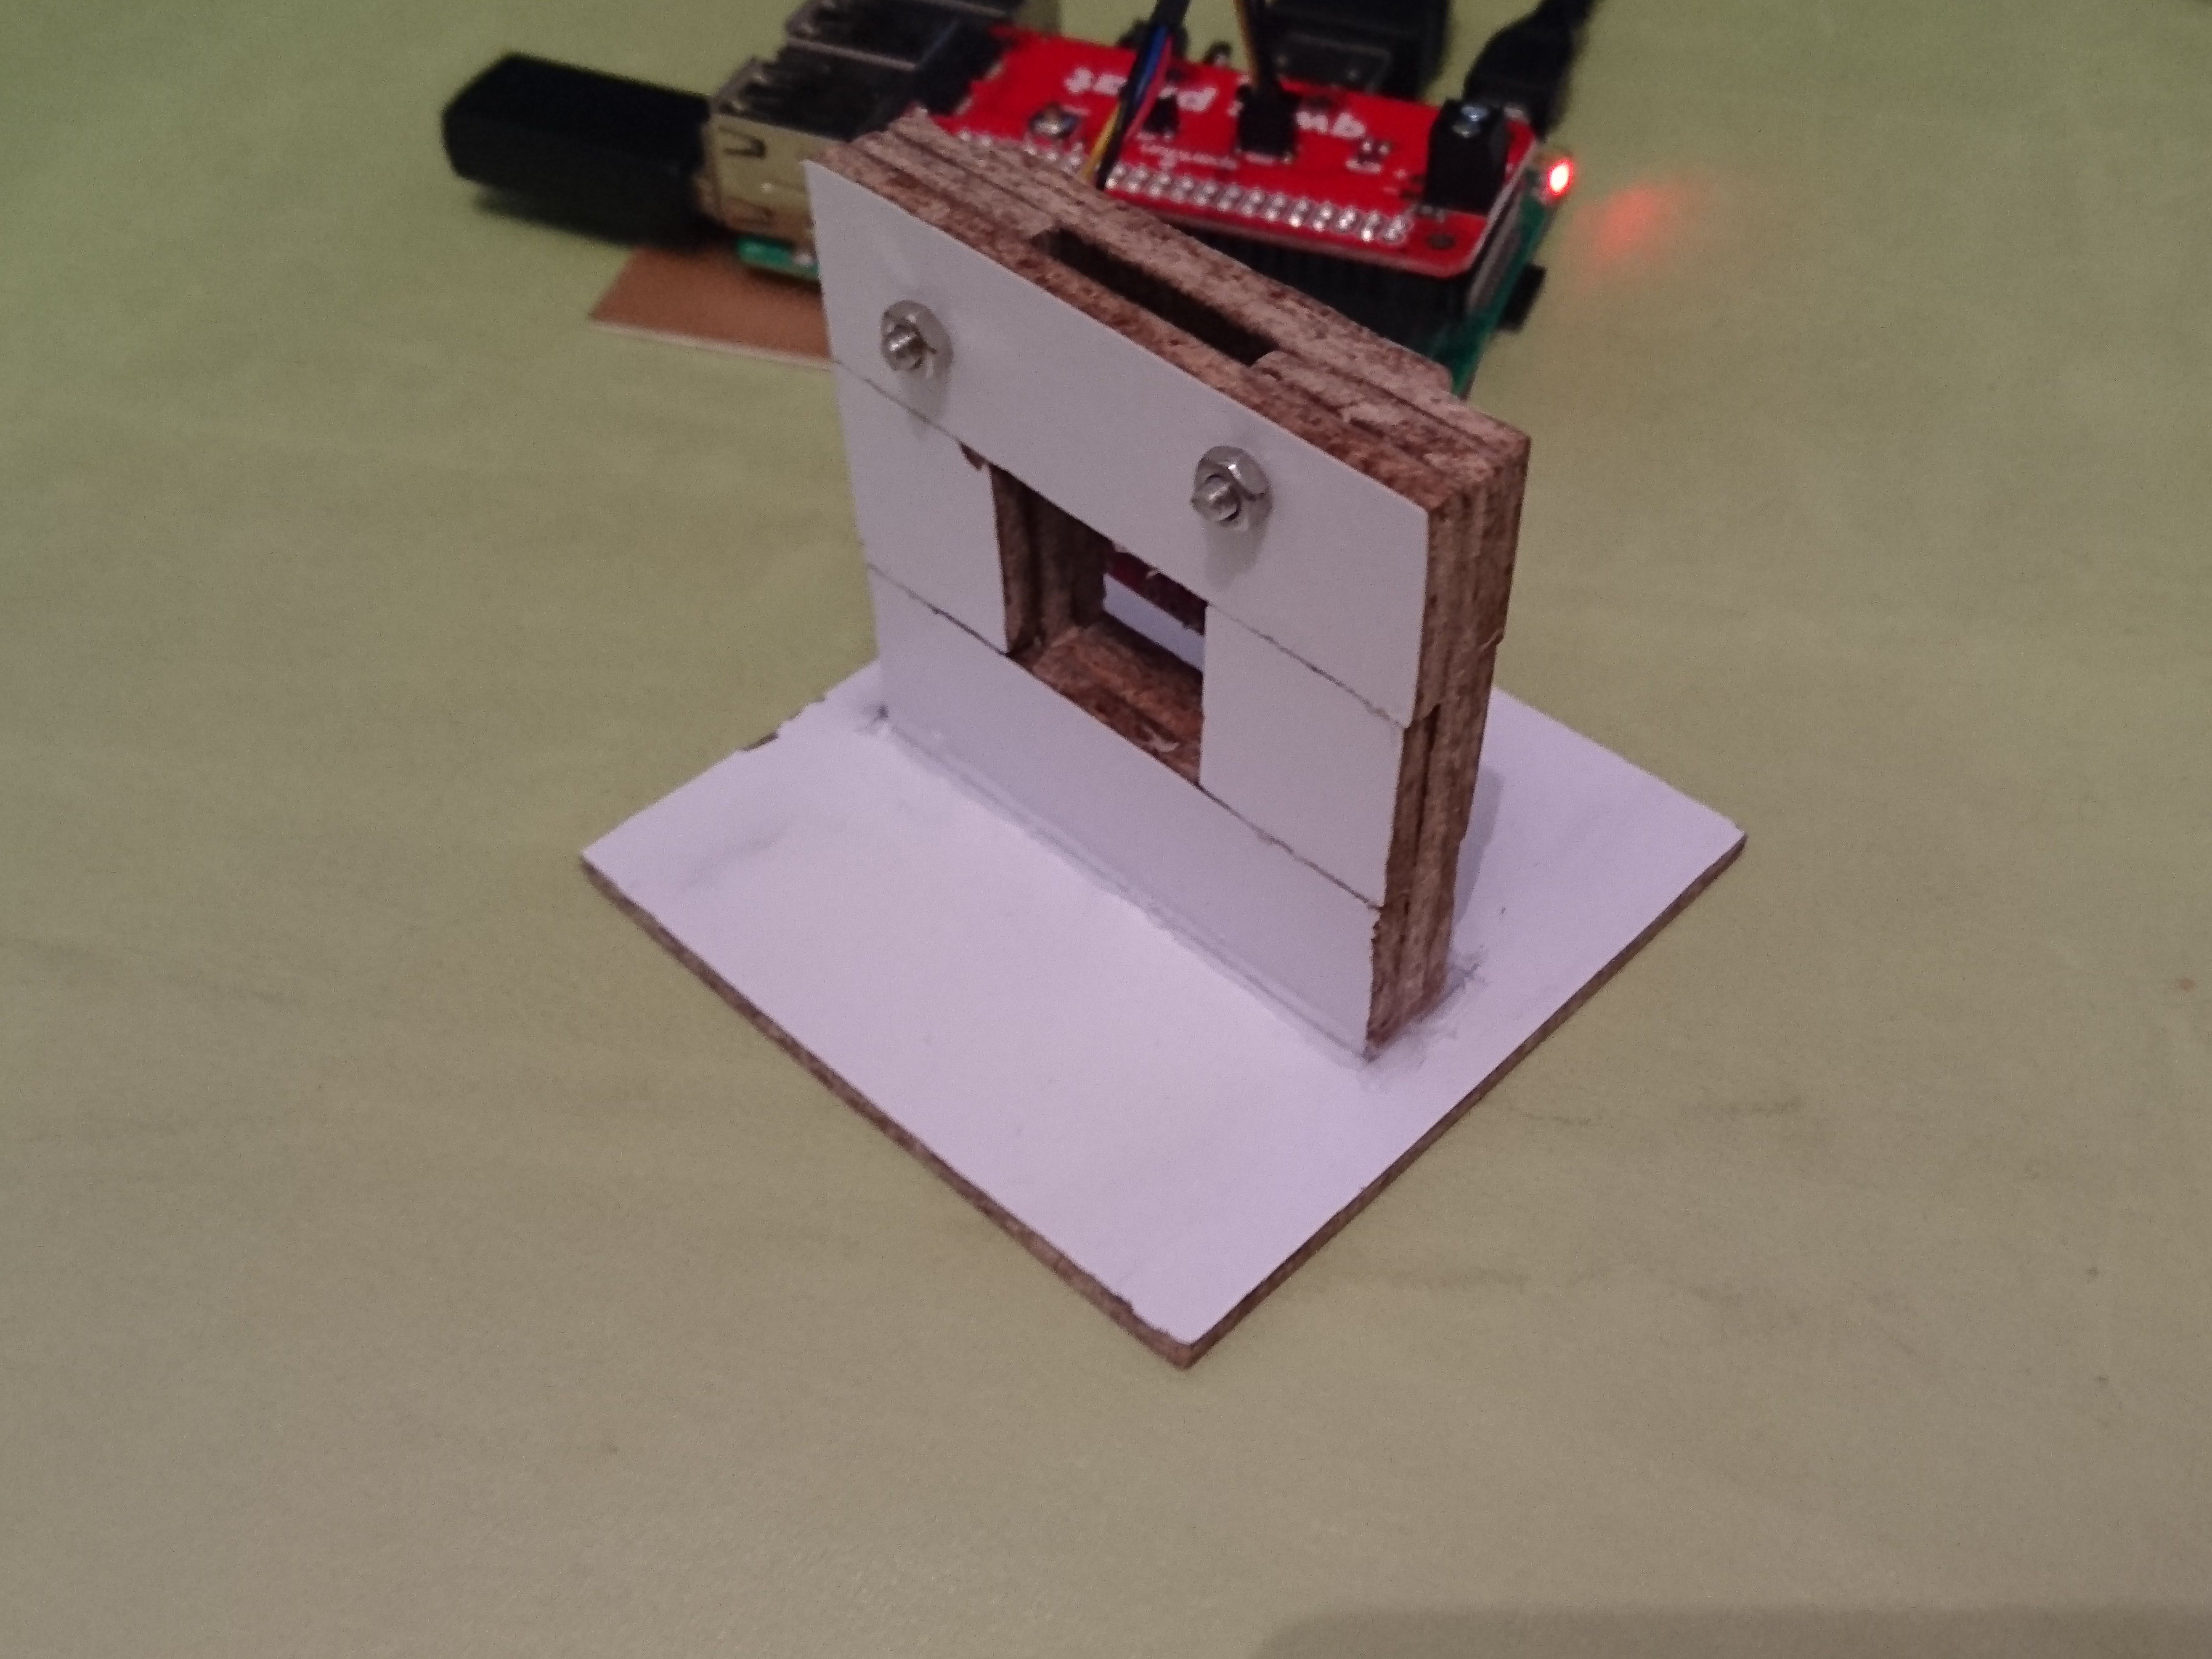
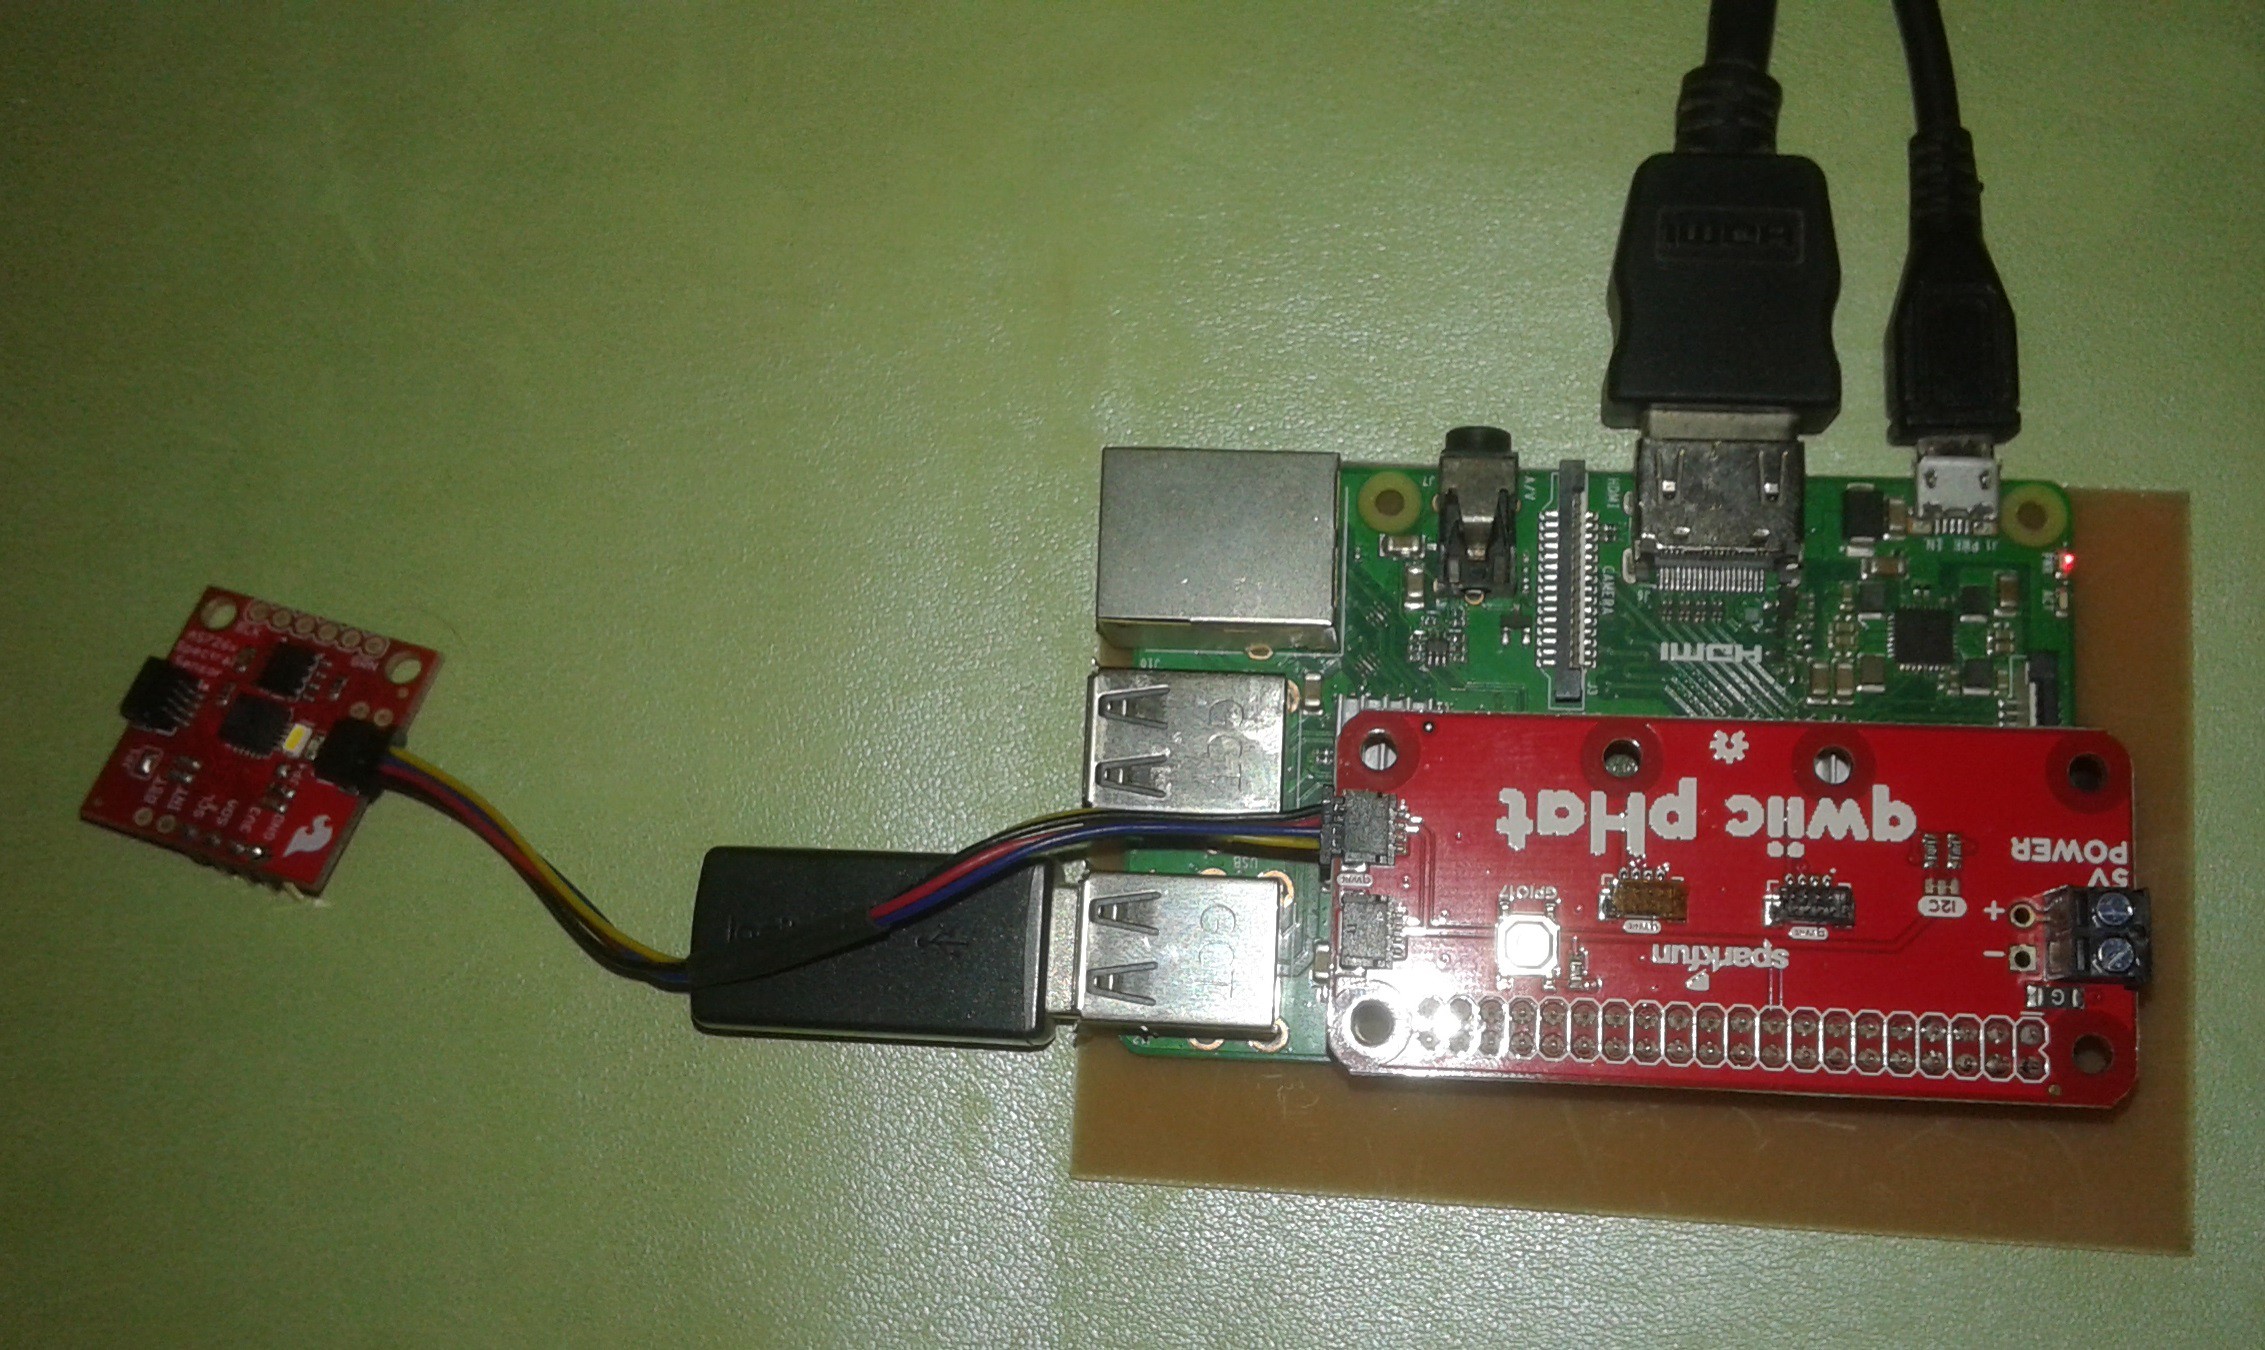
1. First, I will build a module to accommodate the AS7262 sensor. The goal is to prevent strange light interference.
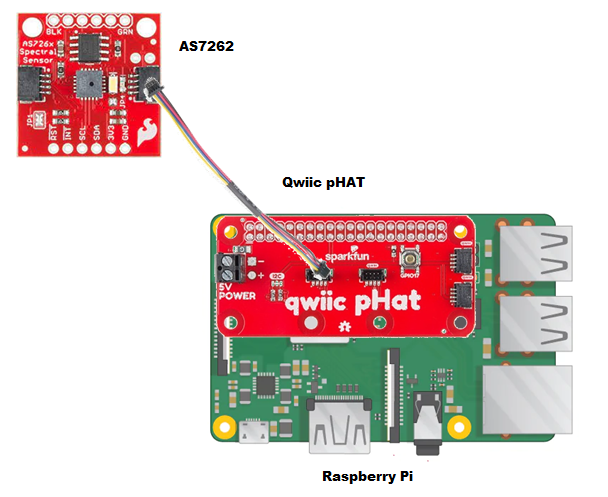
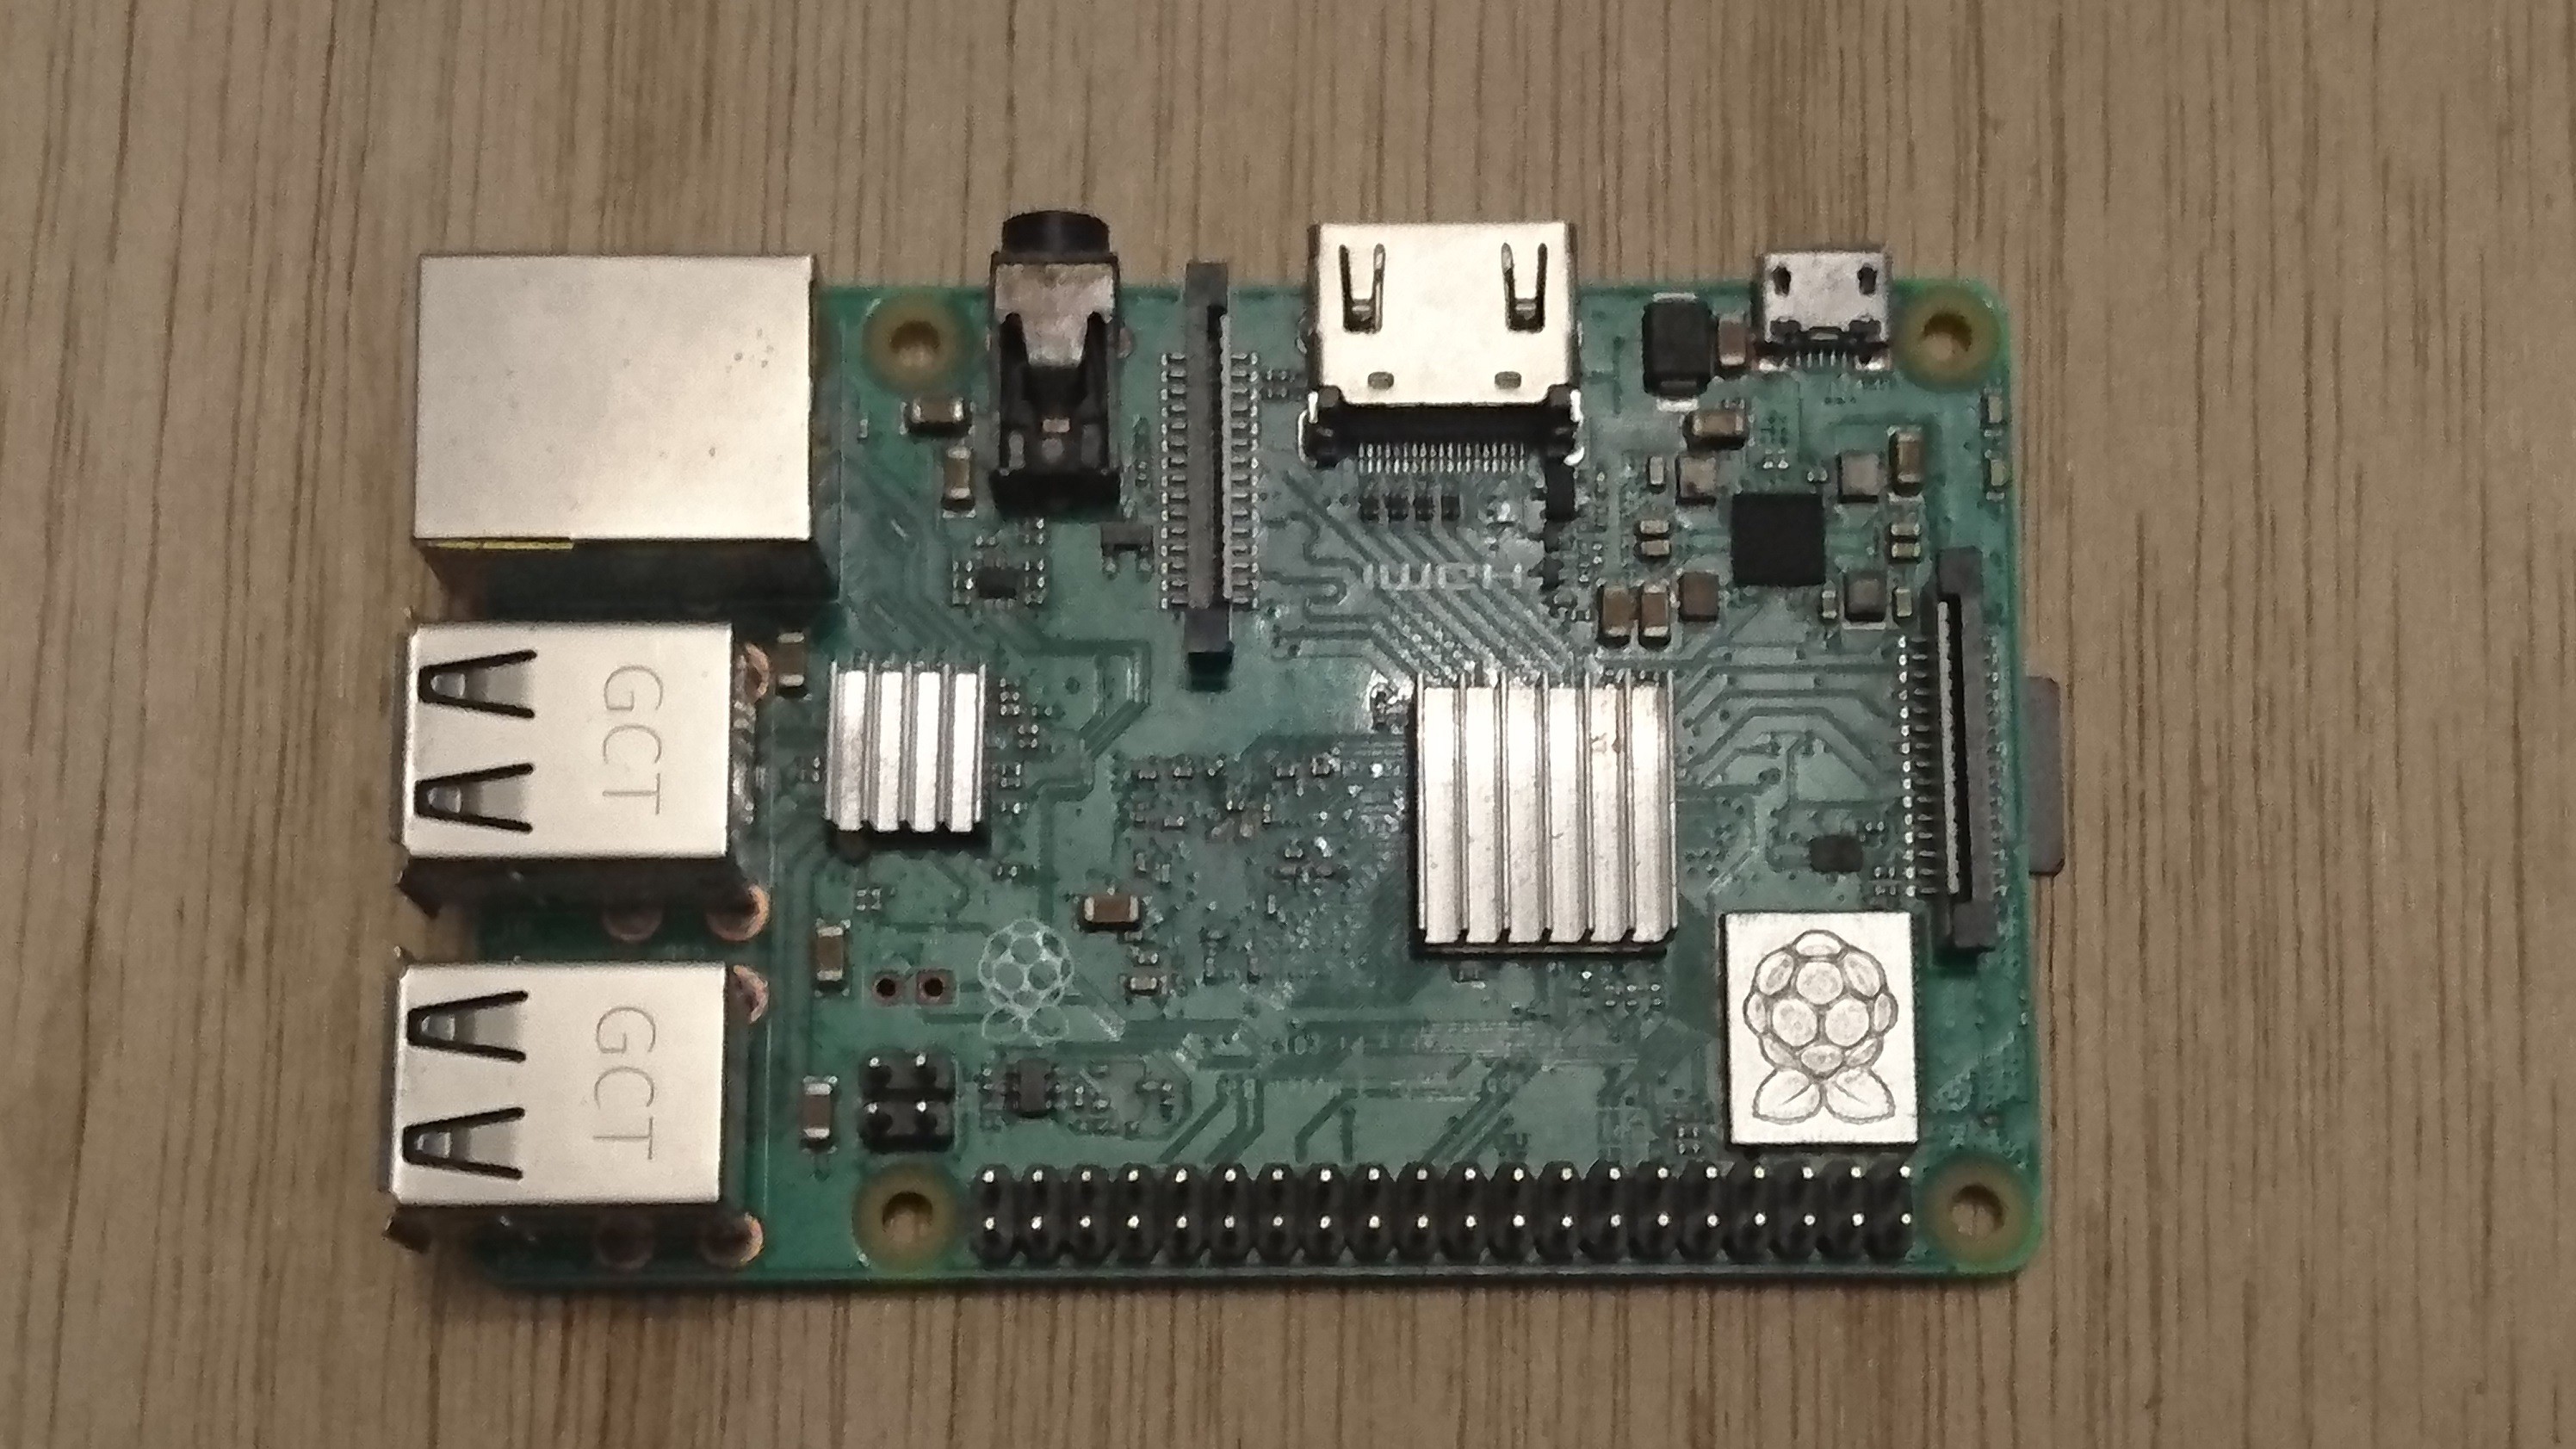
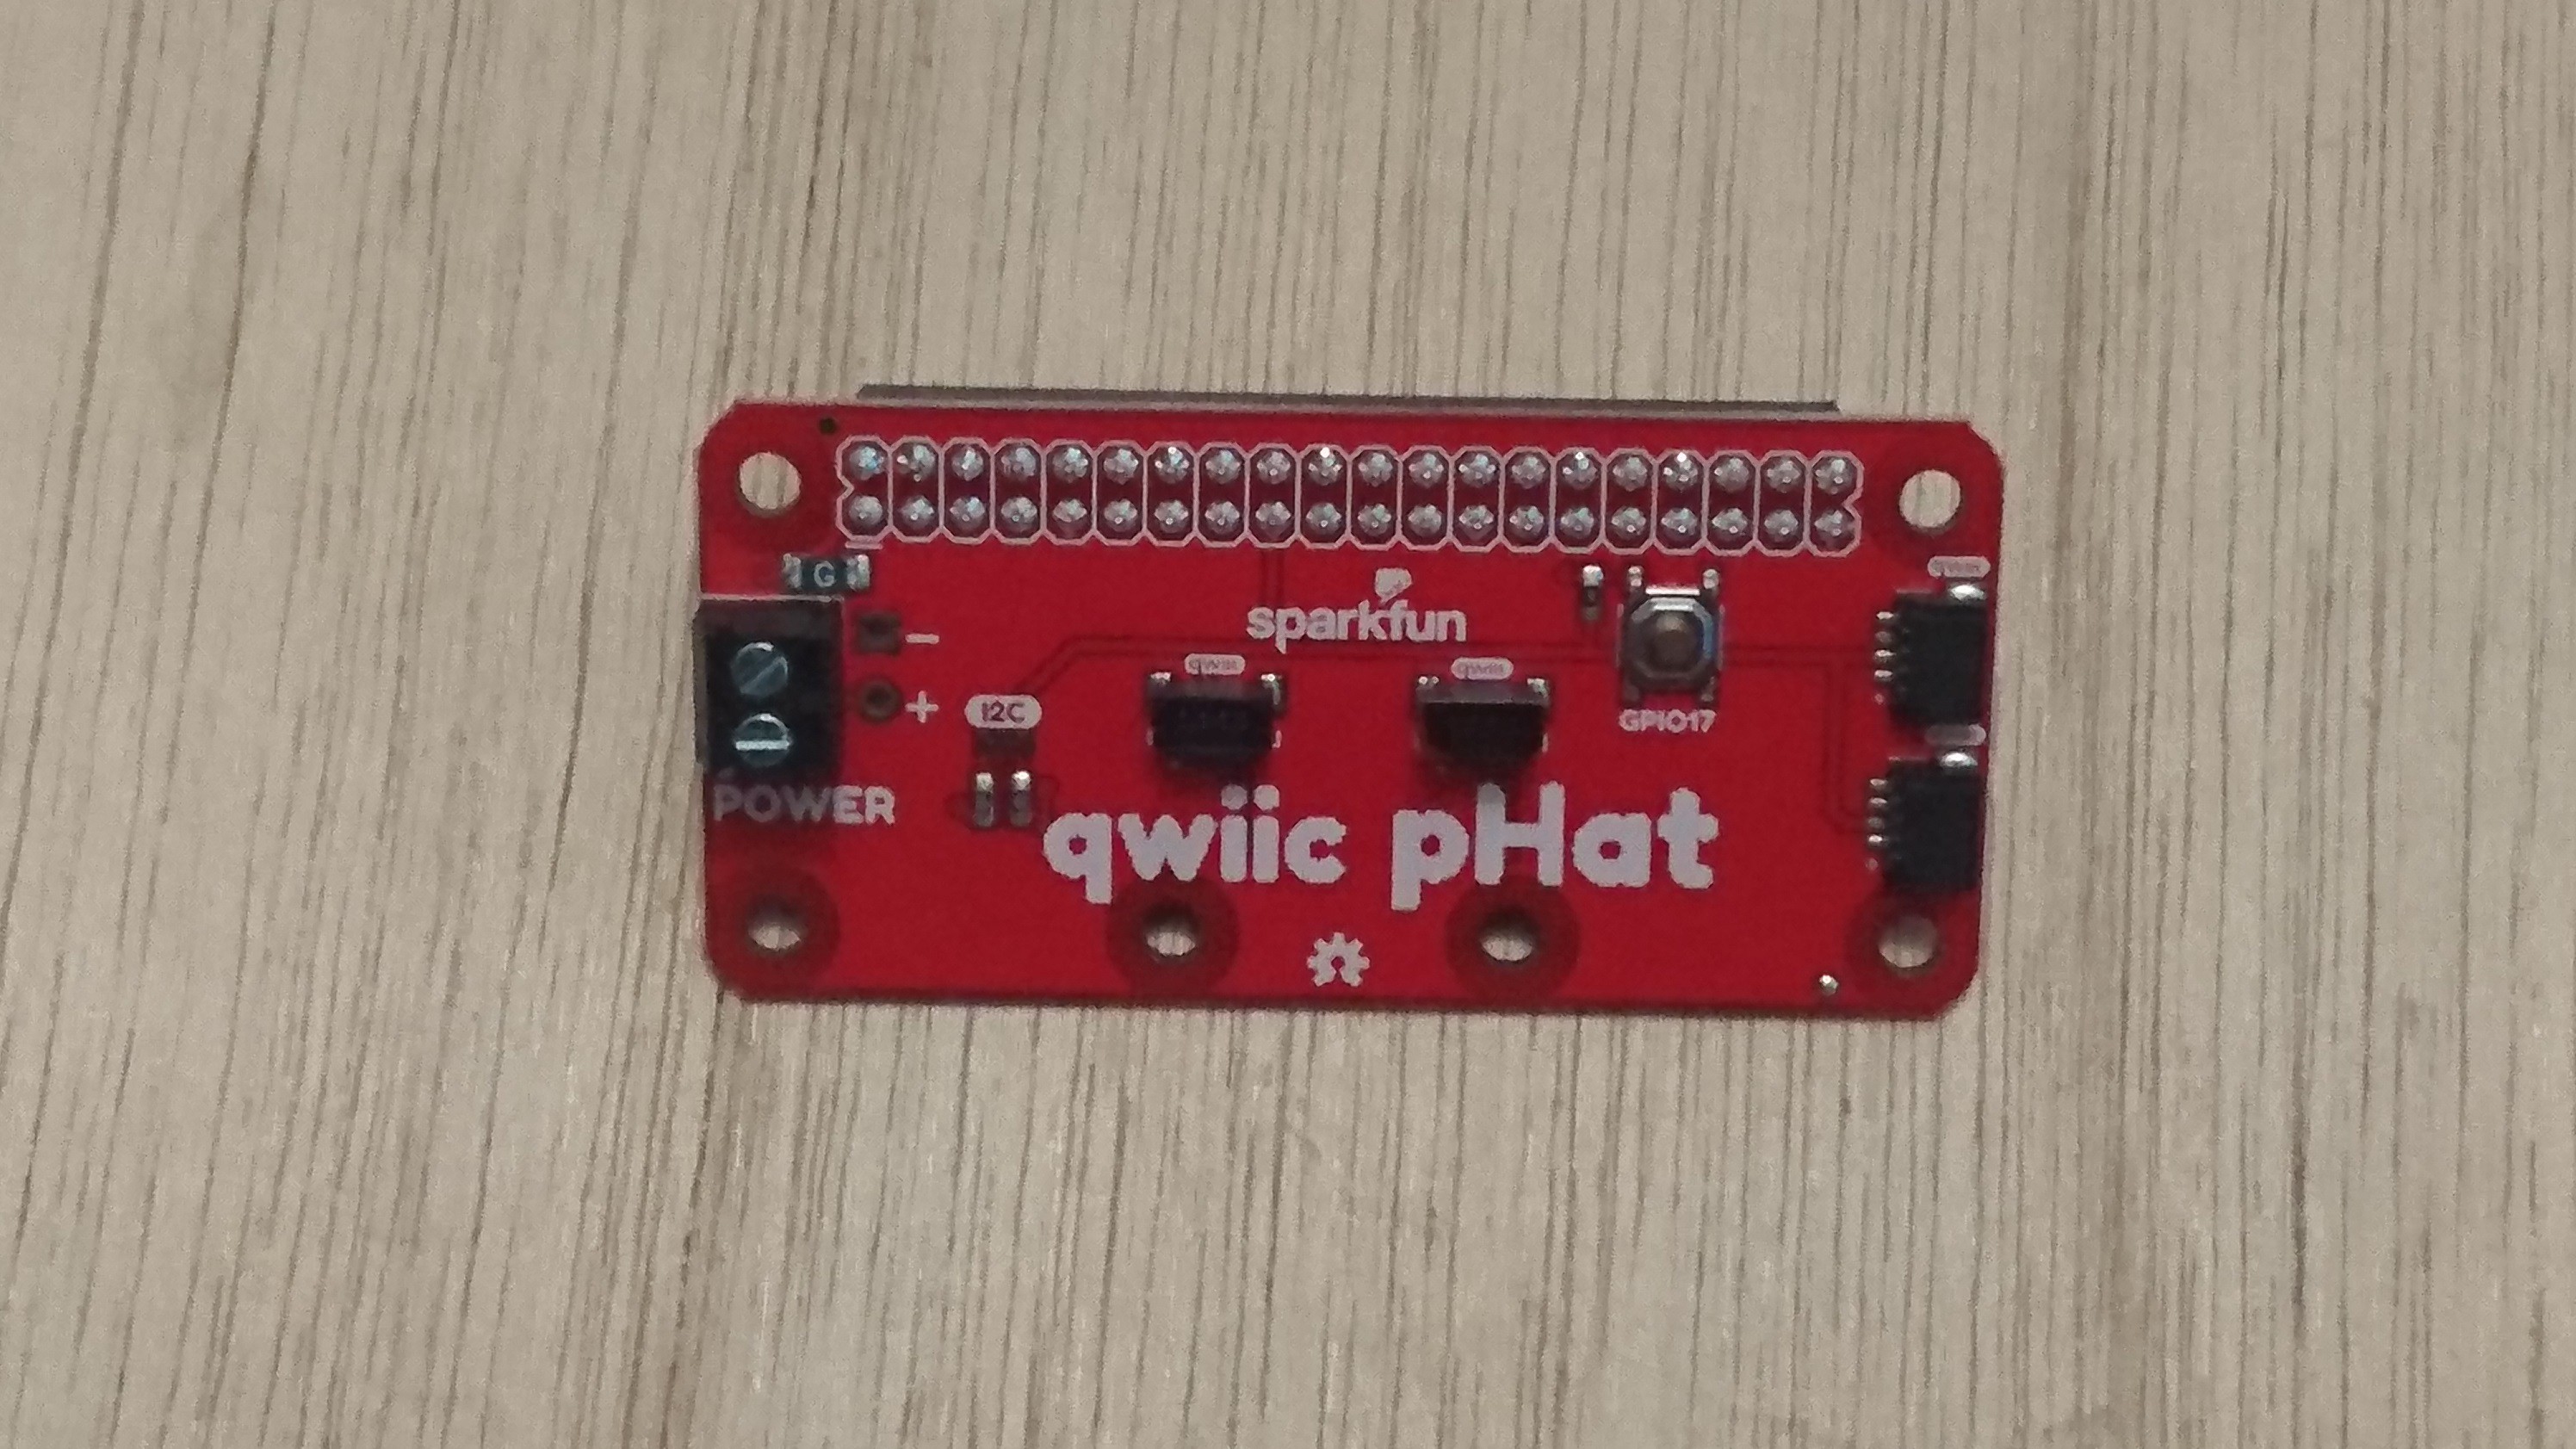
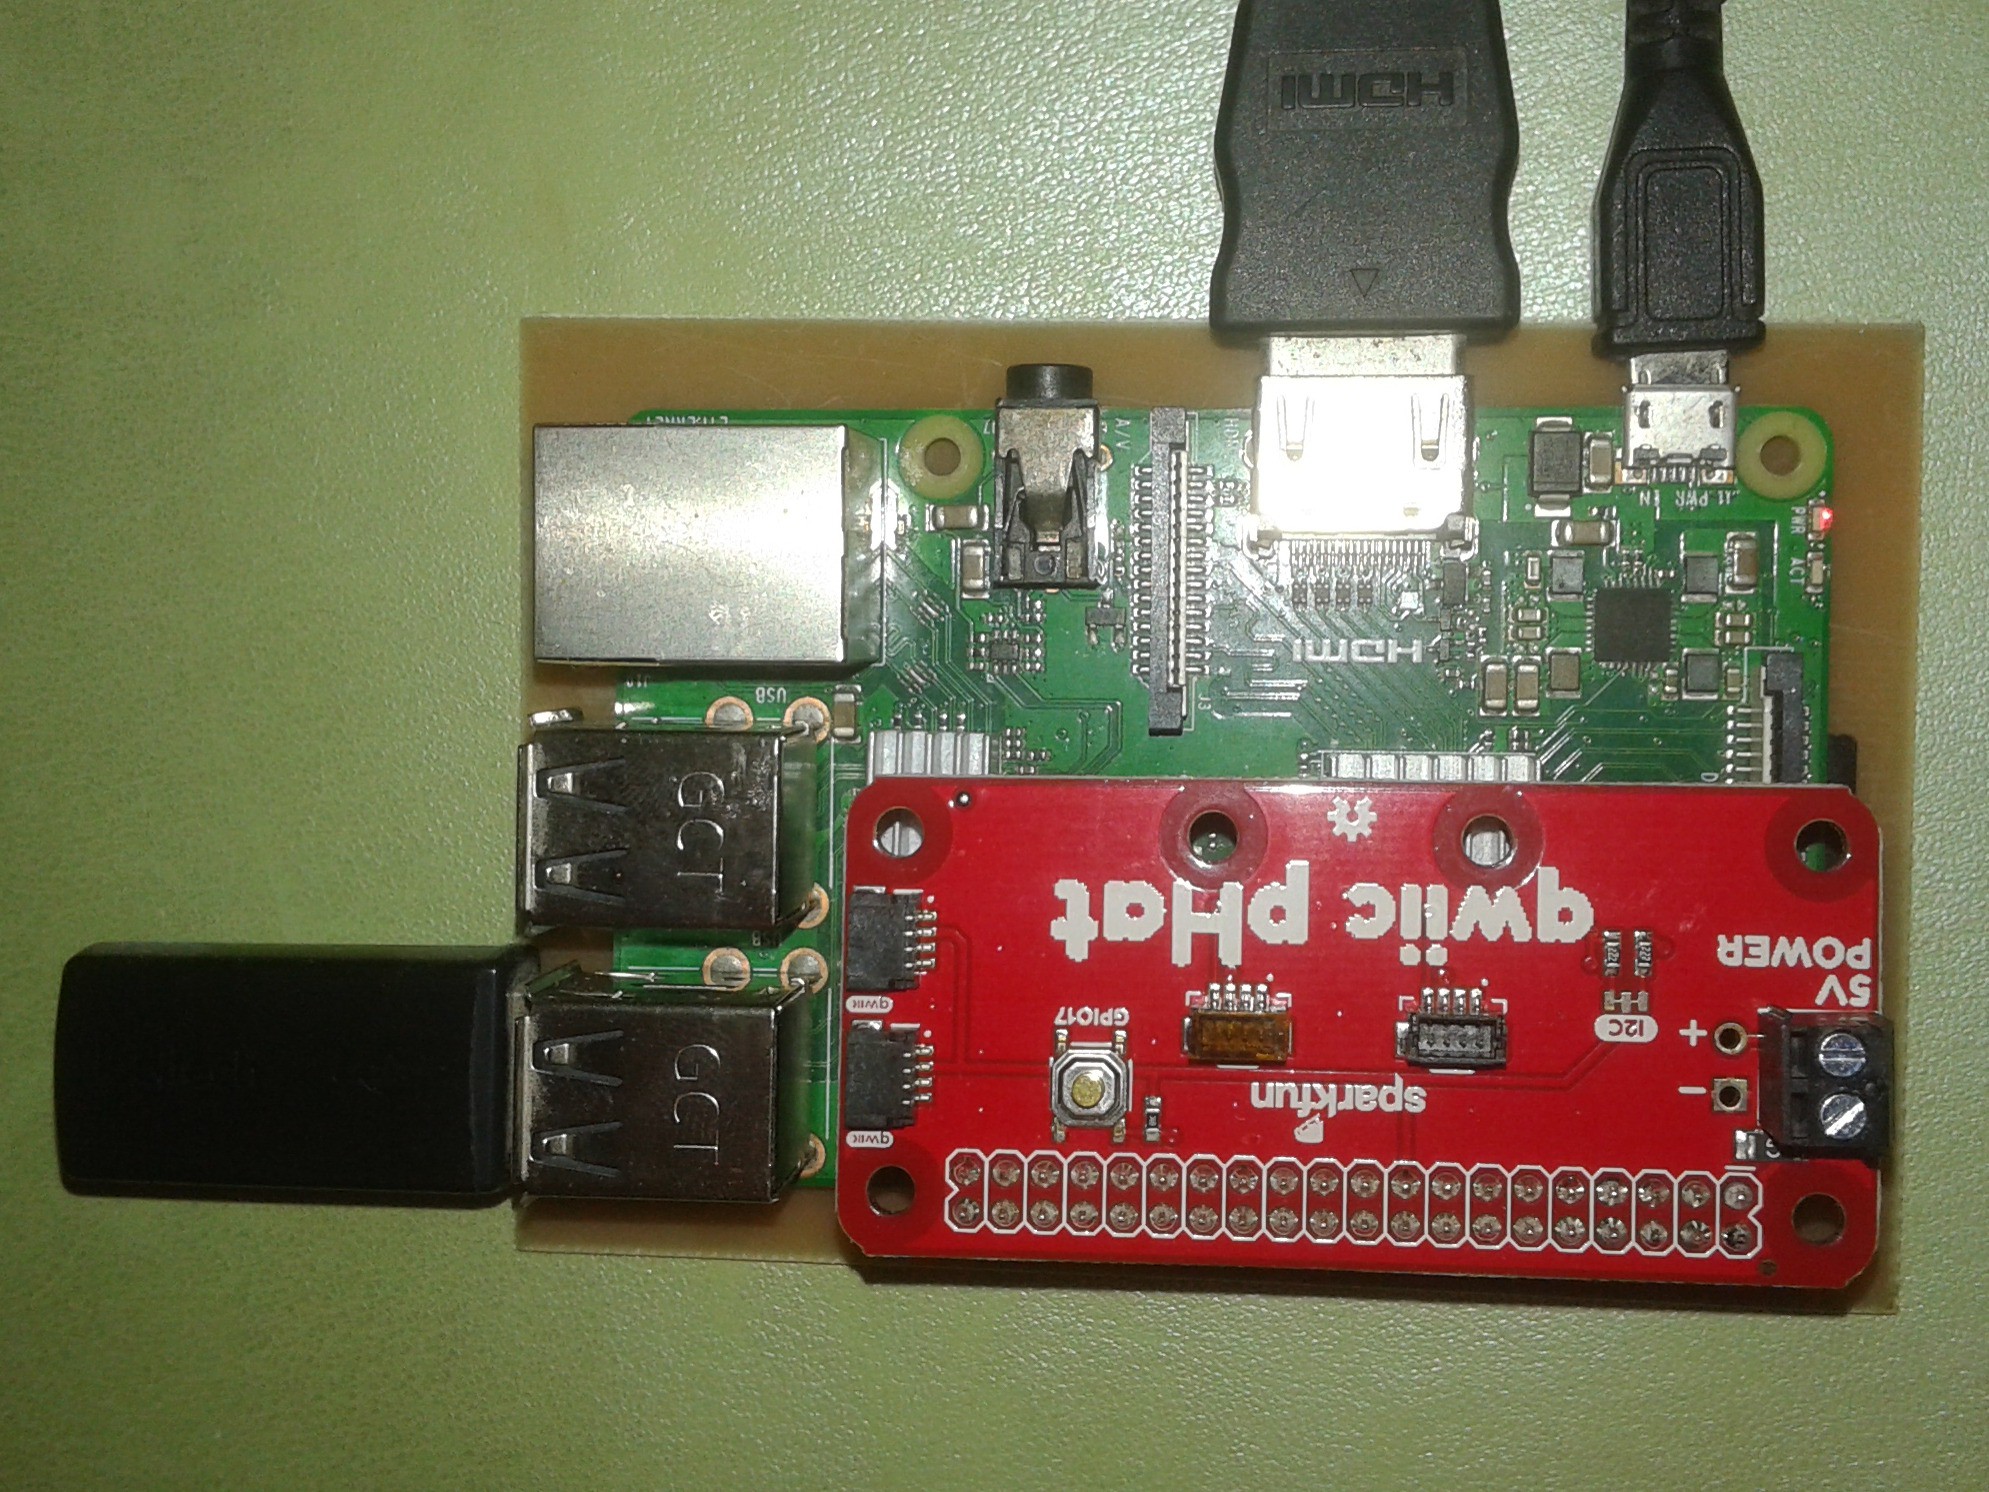
2. Then, the pHat module will be configured to interface the AS7262 sensor with the Raspberry Pi board.
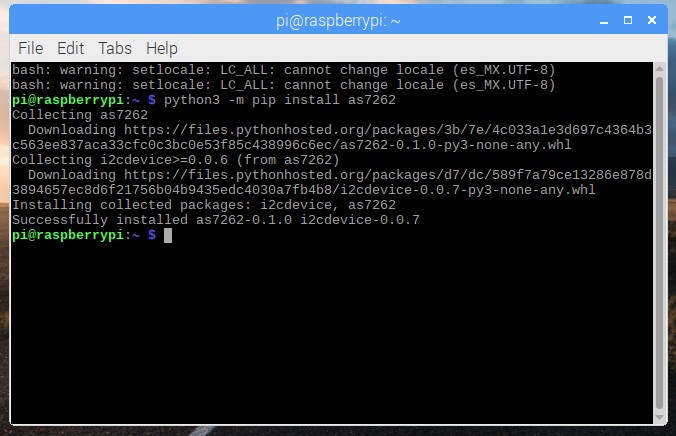
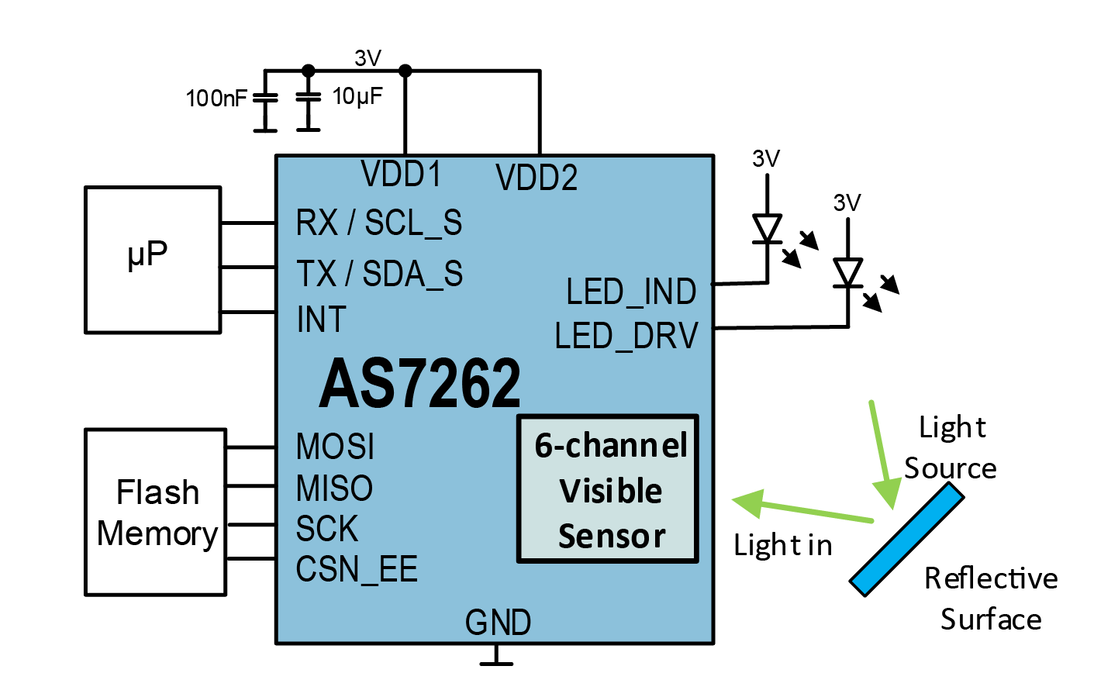
3. The AS7262 6-channel Visible Light Sensor libraries will be installed.
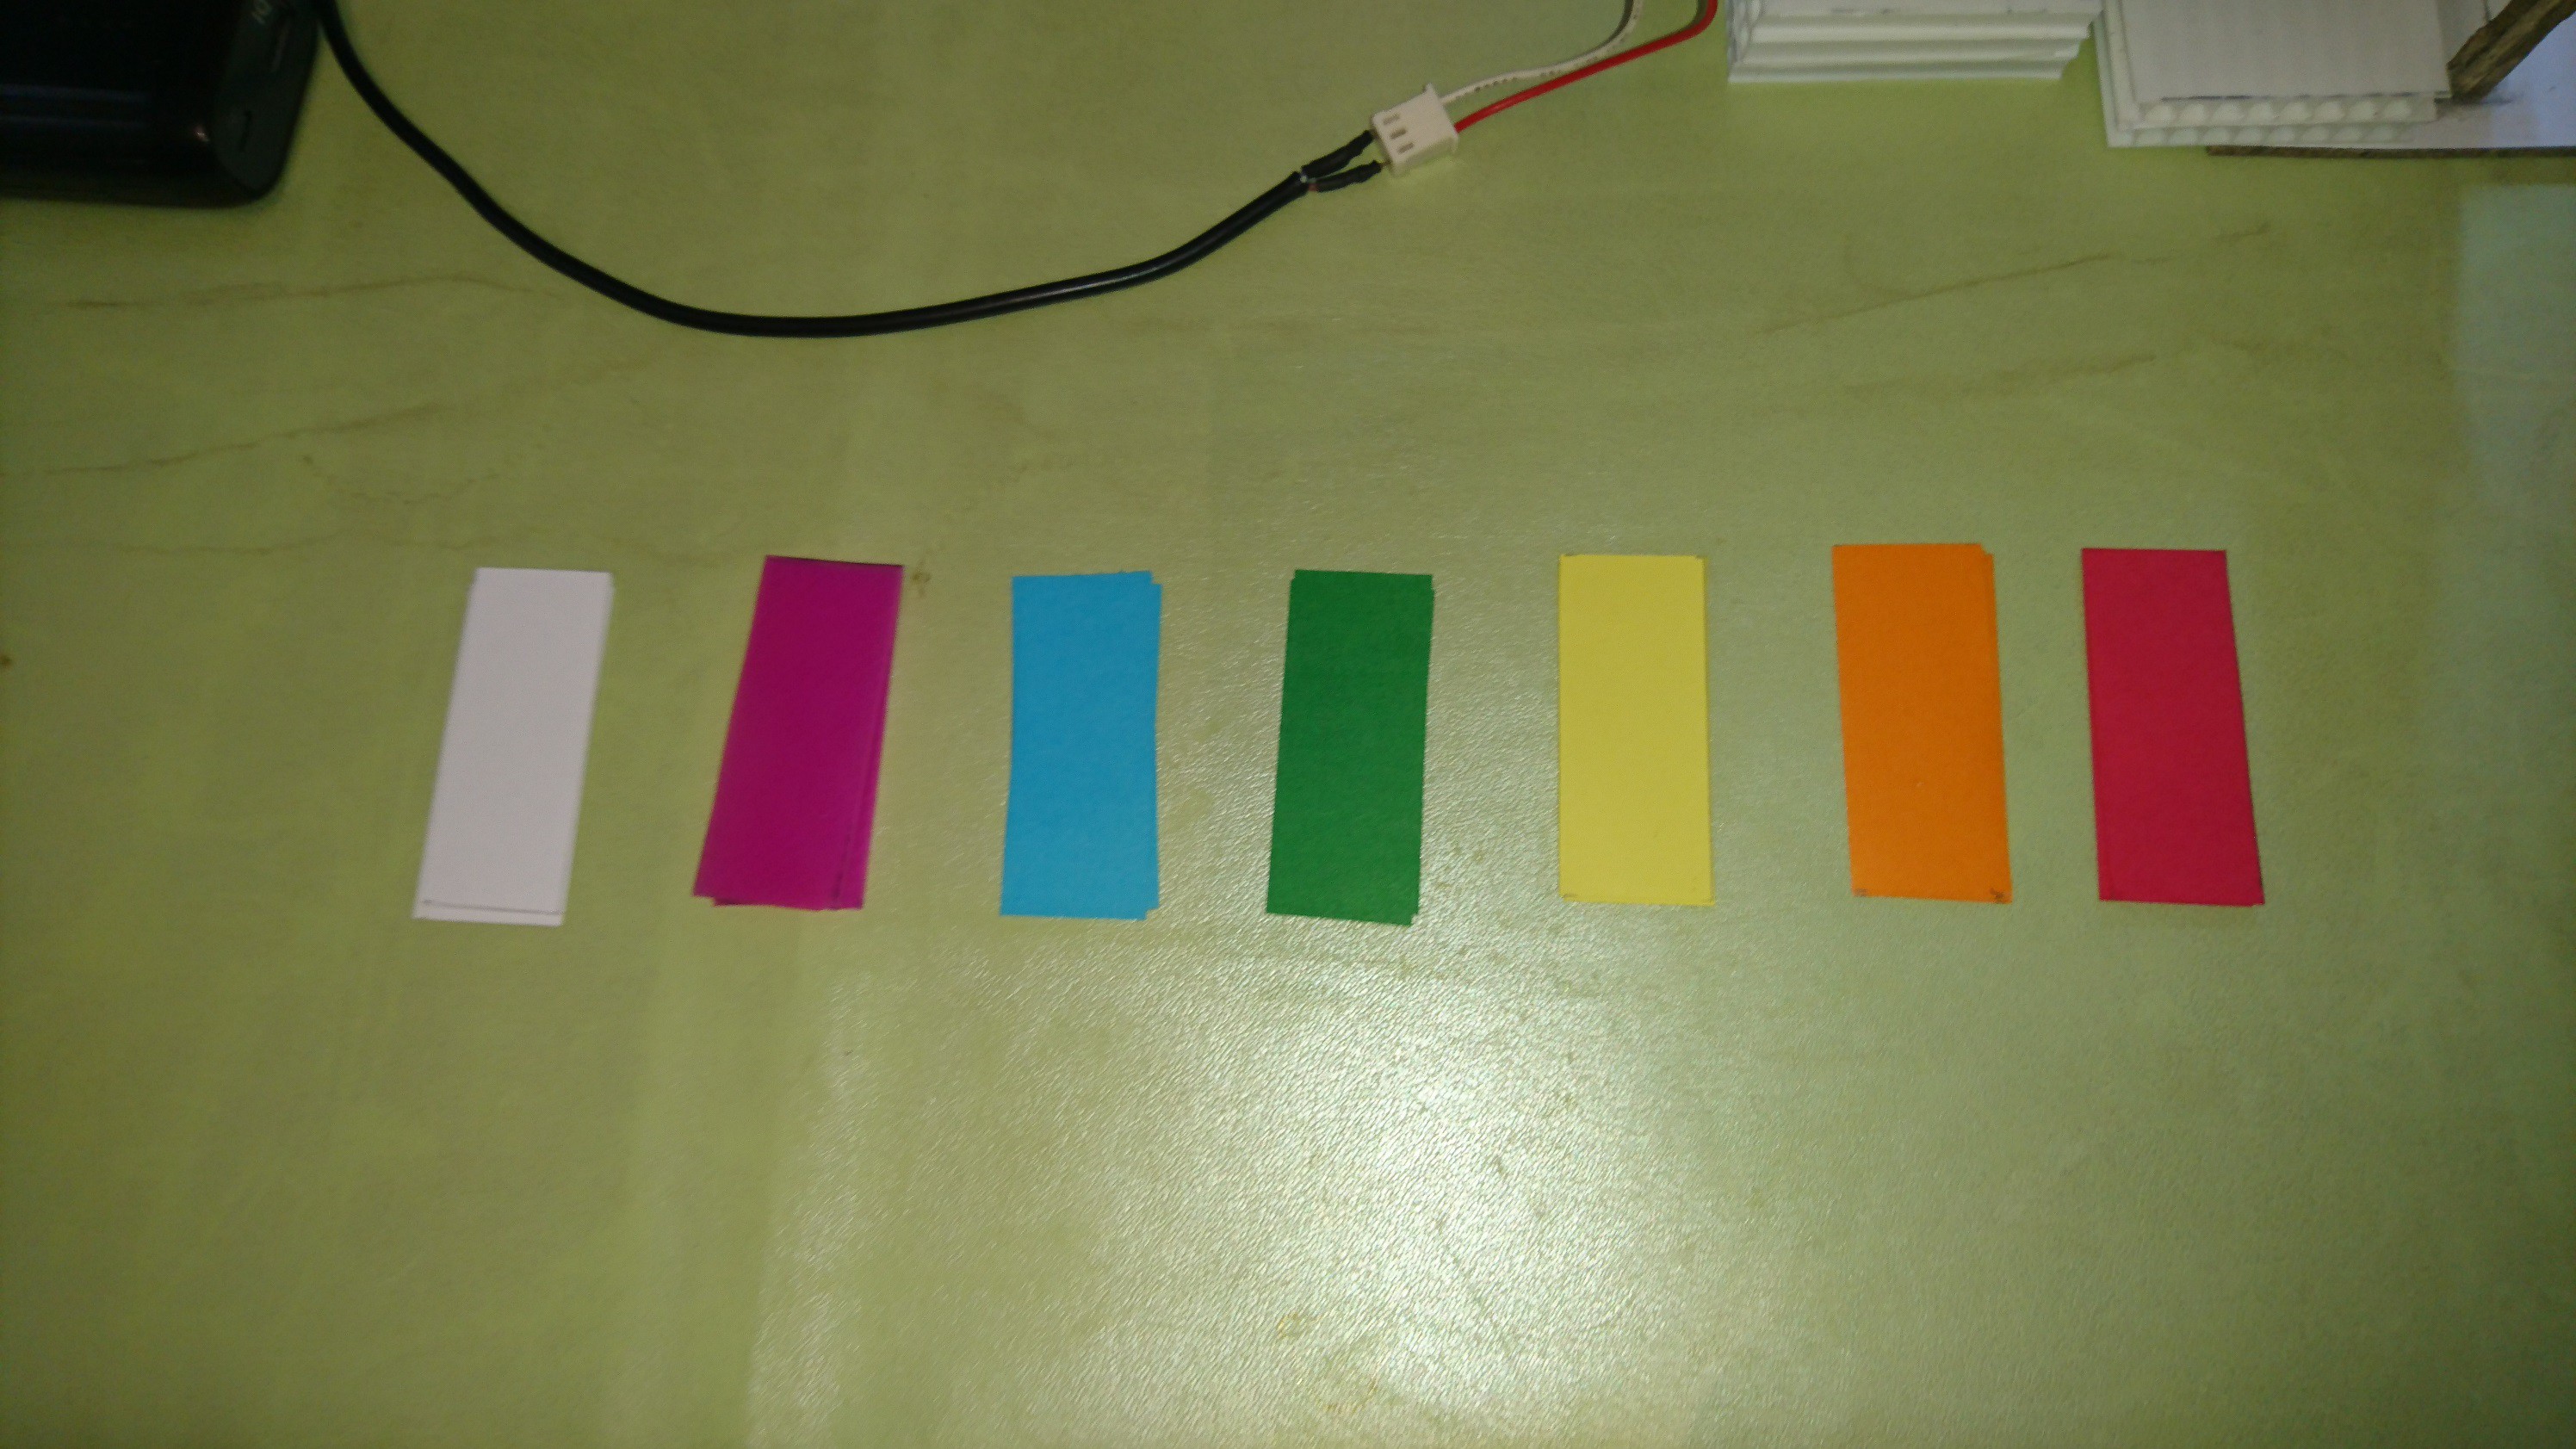
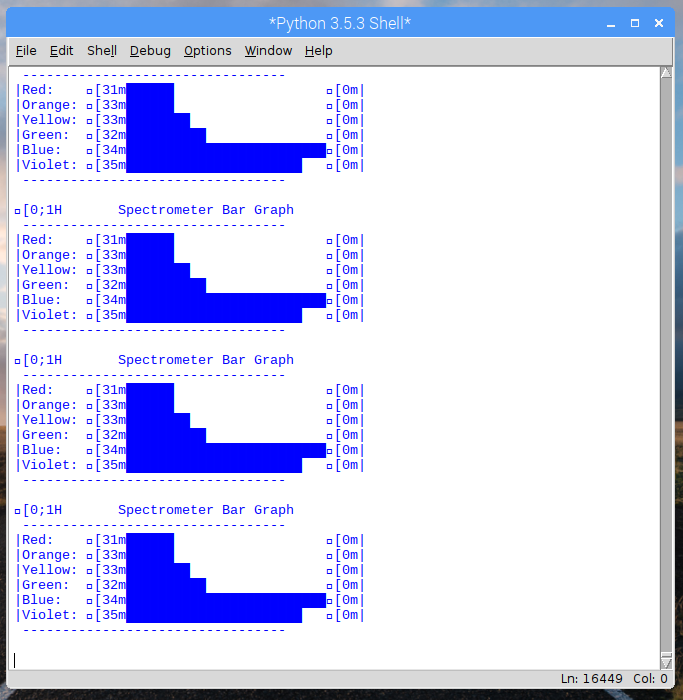
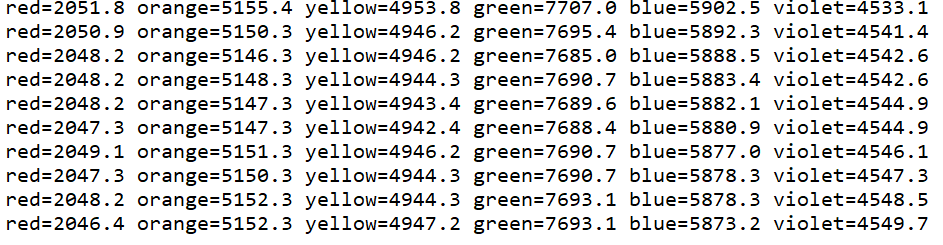
4. Tests with colored filters begin to verify the response of the sensor to different tonalities such as the red, green, blue, yellow, and white.
5. The second experiment will be done with an RGB LED to find out the light spectrum of its generated colors. The AS7262 sensor will be used to know if its colors are pure or a mixture of several colors.
6. The following experiment will be done with liquid substances of different colors. Here a container will be used and it will be adapted to a new module so that the AS7262 sensor can monitor the container color. The goal is to find out what percentage of each color these substances make up.
7. The fourth experiment consists of adapting an IoT monitoring system in real time. The goal is to do experiments and send data to the internet cloud so that colleagues around the world can see the data from our experiments in real time.
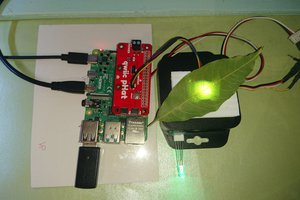
8. The fifth and last experiment will be a plant foliage health monitor of a green area of my community. Here I will use the AS7263 NIR (near infrared) sensor, and I will adapt a new module to do the tests. The objective is to analyze samples of plant leaves and verify their health status as "HEALTHY" or "UNHEALTHY".
Below you can see a video that shows working this prototype.


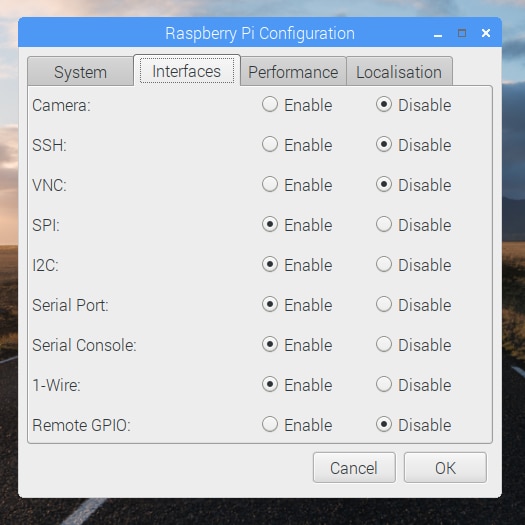 It's recommend restarting your Pi to ensure that the changes to take effect....


 Brenda Armour
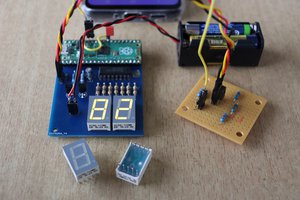
 Florian Wilhelm Dirnberger
 Takahiro
This project fits "Save the World Wildcard" challenge, since it is a kit that can be useful for both re-engineering education and green hacks topics... this is an open source kit that will grow in the future